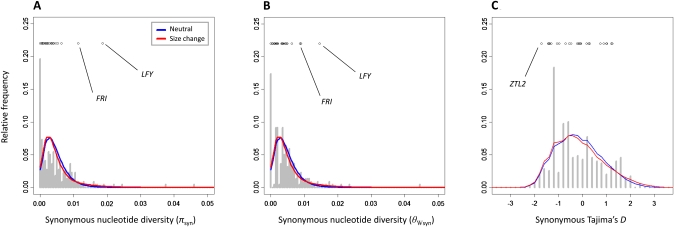
Figure 3 .
Comparison of nucleotide diversity (A and B) and site frequency spectrum (C) at synonymous sites for phenology genes (points), background reference loci (shaded bars), and coalescent simulations from approximate Bayesian computation (ABC) demographic models (colored lines). The two ABC models with high posterior probability are shown: a standard neutral model (blue) and a size change model (red).

