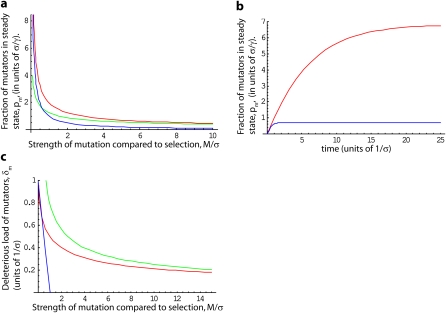
Figure 2 .
Expected behavior when the effects of deleterious mutations are exponentially distributed with mean σ. (a) Steady-state fraction of mutators in the population, pm, in units of . The exact result, Equation 21, is shown in red. The approximations for weak and strong selection relative to mutation, M/σ ≪ 1 and M/σ ≫ 1 in Equation 22, are shown in blue and green, respectively. (b) Dynamics of pm, from Equation 21, in units of . In red, α = 0.2, and in blue α = 5. Note that δm increases linearly at rate γ for (red line) or (blue line), before saturating at its steady-state value. (c) Average deleterious load δm of a mutator. The exact result, Equation 23, is shown in red. The approximations for M/σ ≪ 1 and M/σ ≫ 1 in Equation 24 are shown in blue and green, respectively. Note the results in b and c make use of the approximation λ ≫ 1.

