Our results demonstrate that parenchymal texture features are more strongly correlated with breast percent density at digital breast tomosynthesis (DBT) than at digital mammography, suggesting that DBT image texture analysis can provide more informative imaging features with which to characterize parenchymal patterns.
Abstract
Purpose:
To correlate the parenchymal texture features at digital breast tomosynthesis (DBT) and digital mammography with breast percent density (PD), an established breast cancer risk factor, in a screening population of women.
Materials and Methods:
This HIPAA-compliant study was approved by the institutional review board. Bilateral DBT images and digital mammograms from 71 women (mean age, 54 years; age range, 34–75 years) with negative or benign findings at screening mammography were retrospectively collected from a separate institutional review board–approved DBT screening trial (performed from July 2007 to March 2008) in which all women had given written informed consent. Parenchymal texture features of skewness, coarseness, contrast, energy, homogeneity, and fractal dimension were computed from the retroareolar region. Principal component analysis (PCA) was applied to obtain orthogonal texture components. Mammographic PD was estimated with software. Correlation analysis and multiple linear regression with generalized estimating equations were performed to determine the association between texture features and breast PD. Regression was adjusted for age to determine the independent association of texture to breast PD when age was also considered as a predictor variable.
Results:
Texture feature correlations to breast PD were stronger with DBT than with digital mammography. Statistically significant correlations (P < .001) were observed for contrast (r = 0.48), energy (r = −0.47), and homogeneity (r = −0.56) at DBT and for contrast (r = 0.26), energy (r = −0.26), and homogeneity (r = −0.33) at digital mammography. Multiple linear regression analysis of PCA texture components as predictors of PD also demonstrated significantly stronger associations with DBT. The association was strongest when age was also considered as a predictor of PD (R2 = 0.41 for DBT and 0.28 for digital mammography; P < .001).
Conclusion:
Parenchymal texture features are more strongly correlated to breast PD in DBT than in digital mammography. The authors’ long-term hypothesis is that parenchymal texture analysis with DBT will result in quantitative imaging biomarkers that can improve the estimation of breast cancer risk.
© RSNA, 2011
Supplemental material: http://radiology.rsna.org/lookup/suppl/doi:10.1148/radiol.11100966/-/DC1
Introduction
The assessment of breast cancer risk has become increasingly important for establishing screening recommendations (1–4) and forming preventive strategies (5,6). Growing evidence suggests that mammographic breast density, in addition to affecting the sensitivity of mammography by obscuring breast lesions (7), is a strong independent risk factor for breast cancer (8–12); in fact, it is the strongest known attributable risk factor after age (13). Several studies have shown that the relative risk of breast cancer increases with increasing mammographic density (9–12) and that breast density can be used to improve risk stratification at the individual level by improving the discriminatory accuracy of breast cancer risk assessment models (14–17). Boyd et al (10,18) have established risk stratification levels based on mammographic breast percent density (PD), as follows: 0% < PD < 10%, relative risk = 1.2; 10% ≤ PD < 25%, relative risk = 2.2; 25% ≤ PD < 50%, relative risk = 2.4; 50% ≤ PD < 75%, relative risk = 3.4; and 75% ≤ PD < 100%, relative risk = 5.3.
Although useful for estimating the risk of breast cancer, the methods currently used to assess breast density lack automation and are highly subjective to inter- and intrarater variability (19,20). Byng et al (21,22) showed that mammographic texture analysis can be used to automate the analysis of breast density patterns. Manduca et al (23) demonstrated that mammographic texture features have similar odds ratios to those of breast PD and can help predict breast cancer risk at a similar magnitude. Studies with digitized mammograms have also shown that mammographic texture features can help differentiate women who are carriers of BRCA1/2 from those at low risk for breast cancer (24–28).
Mammography, however, is limited in the performance of parenchymal texture analysis. Because mammography is a projection imaging technique, texture features reflect an admixture of overlapping tissues, including fibroglandular, fatty, and superficial skin tissue layers (29). Because the risk of breast cancer based on breast texture and/or density is mainly associated with the properties of fibroglandular tissue (ie, dense tissue), the texture projected from the skin or the subcutaneous fat could be regarded as “noise” and potentially affect the information content of the computed texture features.
Digital breast tomosynthesis (DBT) is an emerging radiographic imaging modality in which tomographic breast images are reconstructed from multiple low-dose projections acquired at different angles of the x-ray tube (30–34). DBT alleviates the effect of tissue superposition, offering the ability to analyze the fibroglandular tissue texture selectively (Fig 1). We performed this study to correlate parenchymal texture features seen at DBT and digital mammography with breast PD in a screening population of women. Our hypothesis was that the superior parenchymal tissue visualization with DBT will provide texture features that are more informative in characterizing breast parenchymal patterns and ultimately result in more accurate measures with which to estimate breast cancer risk.
Figure 1a:
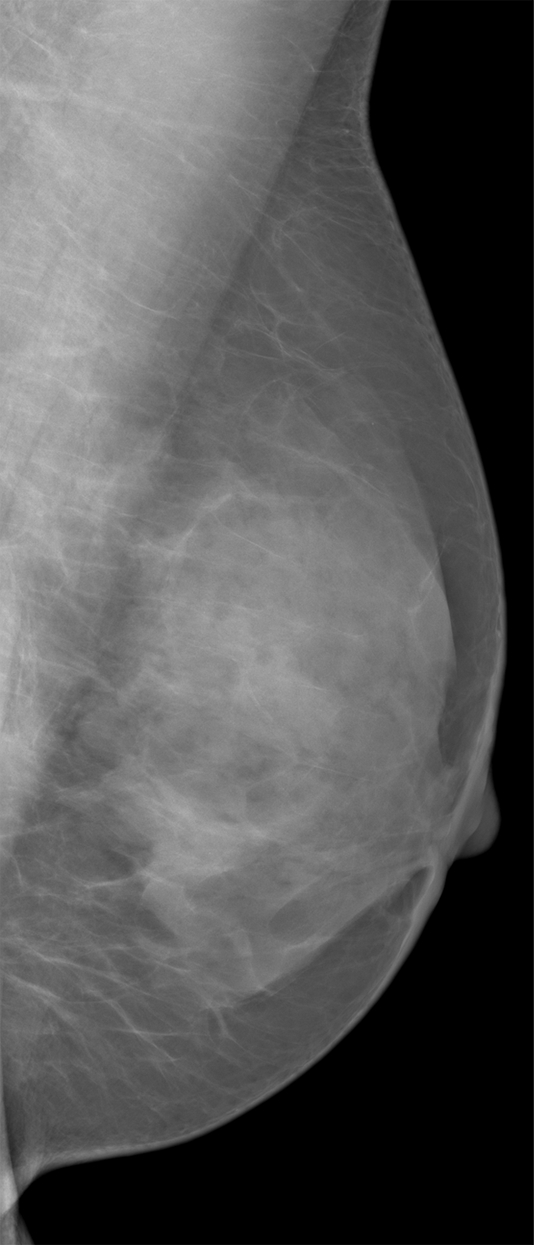
Differences in parenchymal tissue texture visualization in a 56-year-old woman on (a) a digital mammogram, where parenchymal tissue layers are superimposed, and (b, c) DBT images, where the superficial skin layer, in which the skin pore texture is seen in b, is separated from the deeper fibroglandular tissue layers, as seen in c.
Figure 1b:
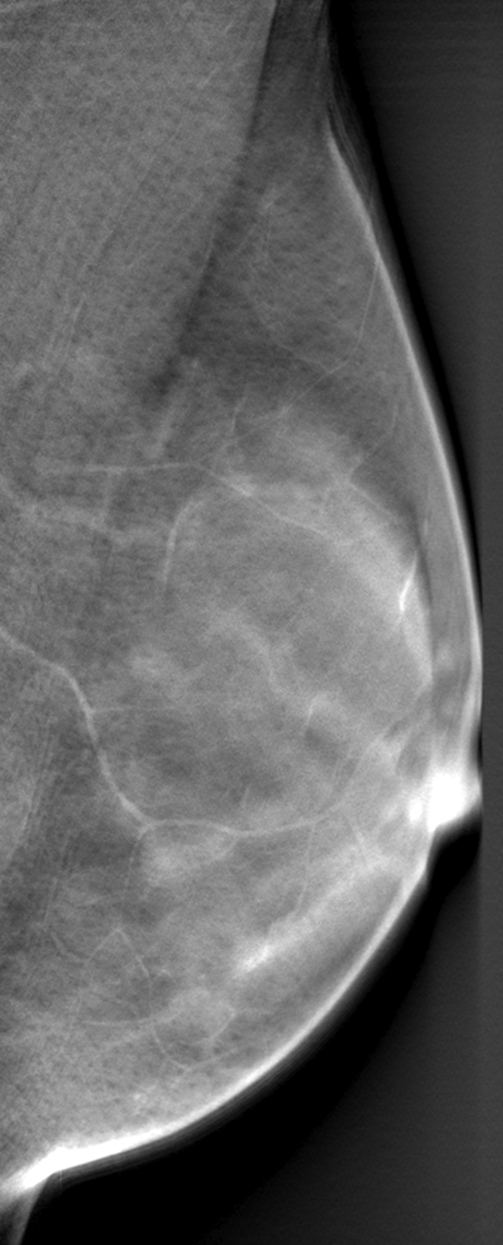
Differences in parenchymal tissue texture visualization in a 56-year-old woman on (a) a digital mammogram, where parenchymal tissue layers are superimposed, and (b, c) DBT images, where the superficial skin layer, in which the skin pore texture is seen in b, is separated from the deeper fibroglandular tissue layers, as seen in c.
Figure 1c:
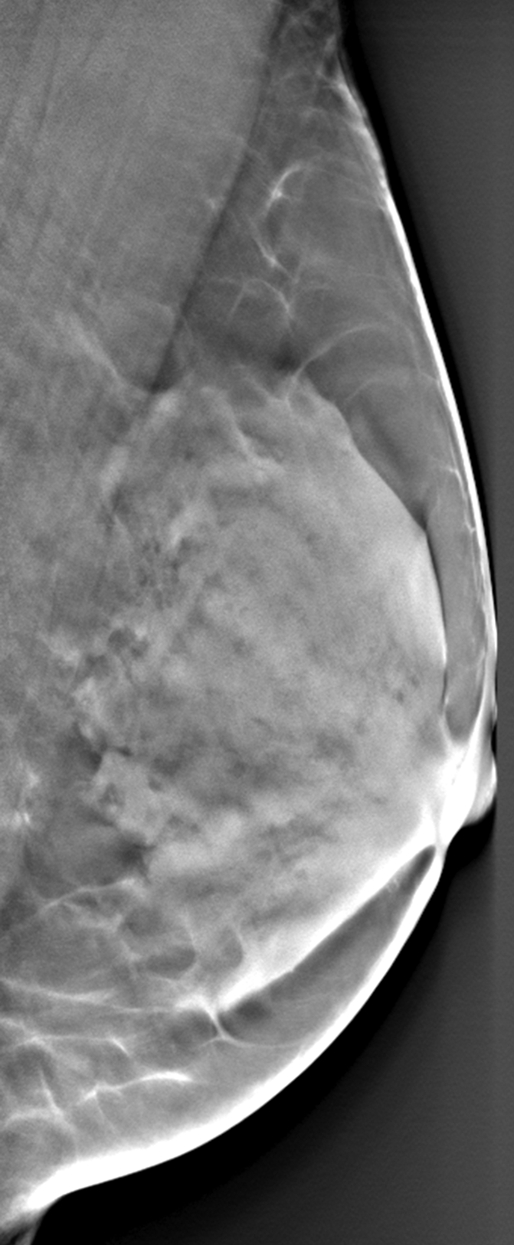
Differences in parenchymal tissue texture visualization in a 56-year-old woman on (a) a digital mammogram, where parenchymal tissue layers are superimposed, and (b, c) DBT images, where the superficial skin layer, in which the skin pore texture is seen in b, is separated from the deeper fibroglandular tissue layers, as seen in c.
Materials and Methods
Imaging
This study was in compliance with the Health Insurance Portability and Accountability Act and received institutional review board approval. Anonymized images from DBT and digital mammography were retrospectively collected from a separate institutional review board–approved DBT screening trial that was previously completed in our department (performed from July 2007 to March 2008). Women who participated in the trial were asymptomatic volunteers who had presented for annual screening mammography, had given written informed consent before their participation, and had normal or benign results from screening. Bilateral imaging was performed with a DBT prototype system (Senographe DS; GE Healthcare, Chalfont St Giles, England). The x-ray tube was rotated to acquire 15 source projection images by varying the x-ray tube angle from −20° to +20° in increments of 2.65°. DBT source projections and the raw digital mammograms were acquired with a resolution of 0.1 mm per pixel at 14-bit gray levels. A filtered backprojection algorithm developed in our laboratory was used to reconstruct DBT images with 0.22-mm in-plane resolution at 15-bit gray levels with 1-mm tomographic section spacing. The raw digital mammograms were processed with the Premium View algorithm (GE Healthcare) to produce 12-bit gray level postprocessed images. Of the 83 women originally enrolled in the trial, one was diagnosed with breast cancer and therefore excluded from our study. In addition, five women had incomplete imaging data (three unilateral and two bilateral image data sets were missing), five women had substantial DBT reconstruction image artifacts within the retroareolar region (four of which were attributed to the presence of calcifications), and one woman had insufficient image quality. Therefore, these 11 women were also excluded (mean age, 54 years; age range, 40–77 years), yielding a total of 71 women (mean age, 54 years; age range, 34–75 years) with bilateral DBT images and digital mammograms available for retrospective analysis.
Mammographic Density Estimation
Breast PD was estimated by a medical physicist (P.R.B, with 10 years of experience in x-ray imaging physics, breast anatomy, and breast density estimation) (35,36) from the postprocessed (Premium View) digital mammograms by using Cumulus (version 4.0; University of Toronto, Toronto, Ontario, Canada), a widely validated software used to estimate mammographic density (10,37–39). Although Cumulus was originally developed for use with digitized screen-film mammograms, recent studies have also applied Cumulus to digital mammograms to estimate cancer risk (36,40,41). We have previously reported high intra- and interreader agreement of clinical radiologists when using Cumulus to estimate breast PD from postprocessed digital mammograms (42). In addition, the difference in PD obtained from raw versus postprocessed digital mammograms is relatively small (<1%) compared with the validated Boyd risk categories, indicating that image postprocessing is unlikely to have a substantial effect on density-based breast cancer risk stratification in clinical practice (43). With use of Cumulus, the image background and pectoral muscle region are excluded and gray level intensity thresholds are manually defined to outline the fibroglandular tissue regions within the breast (38). Breast PD is then estimated as the percentage of the total breast area occluded by the segmented fibroglandular tissue as follows: (AD/AB) × 100%, where AD and AB represent the area of dense tissue and the total breast area, respectively.
Parenchymal Texture Analysis
Texture analysis was performed on all digital mammograms and DBT images within manually selected retroareolar regions of interest (ROIs). The placement and physical dimensions of the ROIs were chosen on the basis of previous studies (24–28), which indicated that the retroareolar breast region can provide the most discriminative texture features for differentiating women at high risk for cancer from those at low risk. The ROIs were placed in the central breast region immediately behind the nipple, which is usually texturally dense owing to the prominence of the underlying ductal network, and the placement was such that the subcutaneous fat region immediately under the skin was excluded. The ROIs used for DBT were 2.5 cm3 (116 × 116 × 26 voxels). The ROIs used for digital mammography were placed in identical spatial locations to those on corresponding DBT images and were 2.5 cm2 (256 × 256 pixels).
Parenchymal texture descriptors of skewness, coarseness, contrast, energy, homogeneity, and fractal dimension were computed by using established computerized methods (24–28). These descriptors have been previously used to characterize breast parenchymal patterns and have been shown to be predictive of the risk for developing breast cancer (21–28). Briefly, skewness reflects the asymmetry of the gray-level pixel value distribution and has been used to assess parenchymal density (26,38). Coarseness reflects the local granularity (ie, roughness) in image texture and is based on the computation of the neighborhood gray tone difference matrix (26,44). Contrast, energy, and homogeneity, as originally proposed by Haralick et al (45), require the computation of the gray-level spatial co-occurrence matrix. Contrast quantifies variation in image intensity, providing a measure of gray-level contrast between neighboring pixels over the entire image. Energy is a measure of texture uniformity of the gray-level spatial distribution. Homogeneity reflects the heterogeneity of the texture pattern and decreases with contrast. Fractal dimension indicates the measure of self-similarity in the texture pattern and the overall texture roughness at different scales (28,46). Details of the mathematical notations and the computation of these texture features have been previously published (26,28), including in our preliminary study (35), and are provided in Appendix E1 (online).
For the DBT ROIs, a feature was computed for each of the six texture descriptors (ie, skewness, coarseness, contrast, energy, homogeneity, and fractal dimension) from each of the 26 tomographic sections of the three-dimensional ROI, resulting in a texture feature vector of 26 × 6 = 156. The average value over the 26 tomographic ROI sections was used as the representative feature, providing an estimate of the mean global texture within the ROI for each of the six main texture descriptors considered in our experiments. For the digital mammography ROIs, the equivalent single-valued texture feature was computed from the corresponding two-dimensional ROIs (Fig 2). Gray-level quantization was implemented to optimize the computation of the co-occurrence statistics, as previously defined in the literature (23,24,47), to cover a wide range of spatial scales and feature strengths relative to noise. Briefly, the initial range Ng of gray-level values in each ROI was linearly reduced by uniformly dividing the gray-level range by a constant. Details of the gray-level quantization method are provided in Appendix E1 (online). For the experiments reported herein, a representative value (Ng/16) was selected.
Figure 2a:
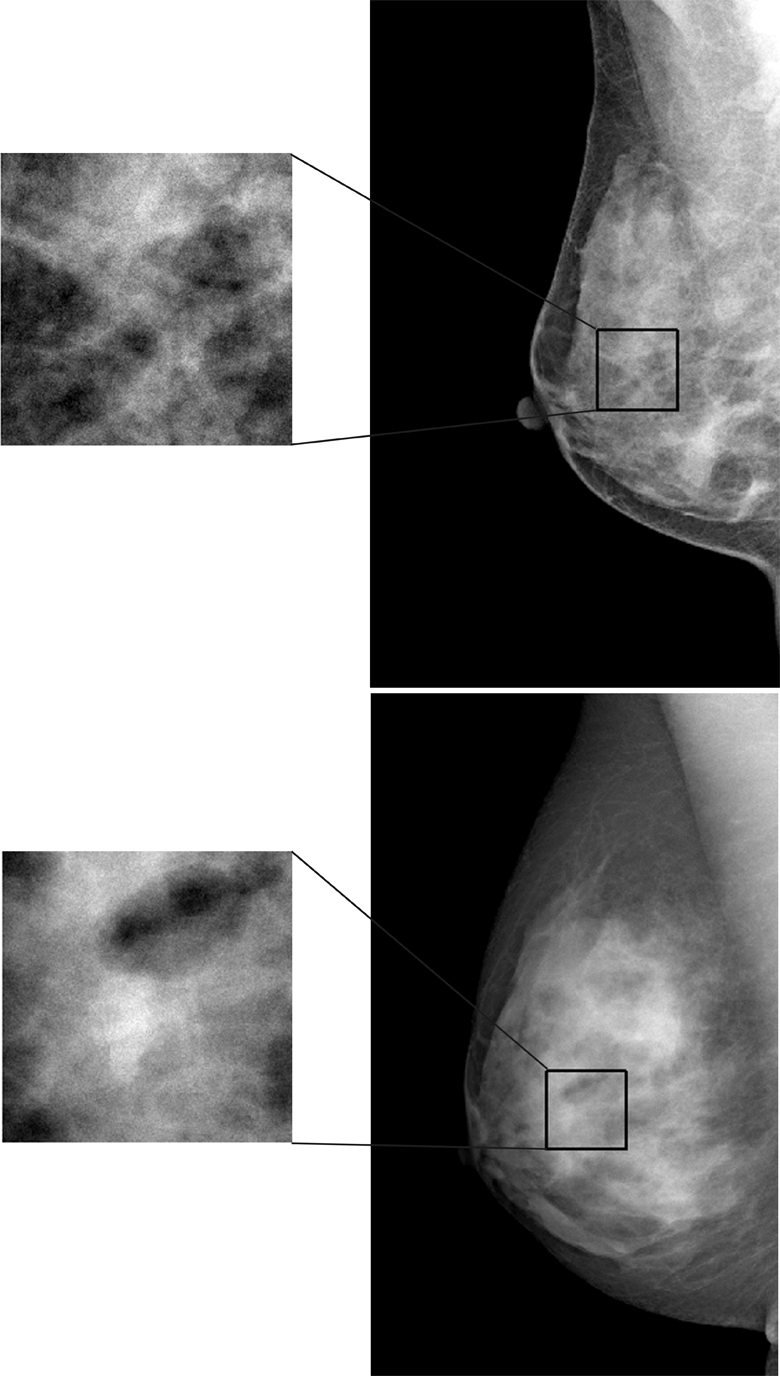
Examples of (a) digital mammograms and (b) corresponding DBT images in two 41-year-old women with the same overall PD (45%) and different parenchymal patterns, as demonstrated by a range of different parenchymal texture descriptors in the retroareolar breast region. Top images are from one woman and bottom images are from another. For upper image in a: skewness = 0.161, coarseness = 2.773 × 10⁻⁴, contrast = 1.607, energy = 0.018, homogeneity = 0.617, and fractal dimension = 2.538; for lower image in a: skewness = −0.146, coarseness = 3.558 × 10⁻⁴, contrast = 1.619, energy = 0.013, homogeneity = 0.616, and fractal dimension = 2.548. For upper image in b: skewness = 0.051, coarseness = 0.0015, contrast = 588.06, energy = 7.383 × 10⁻⁵, homogeneity = 0.112, and fractal dimension = 2.835; for lower image in b: skewness = 0.817, coarseness = 0.0016, contrast = 313.32, energy = 1.160 × 10⁻⁴, homogeneity = 0.142, and fractal dimension = 3.123.
Figure 2b:
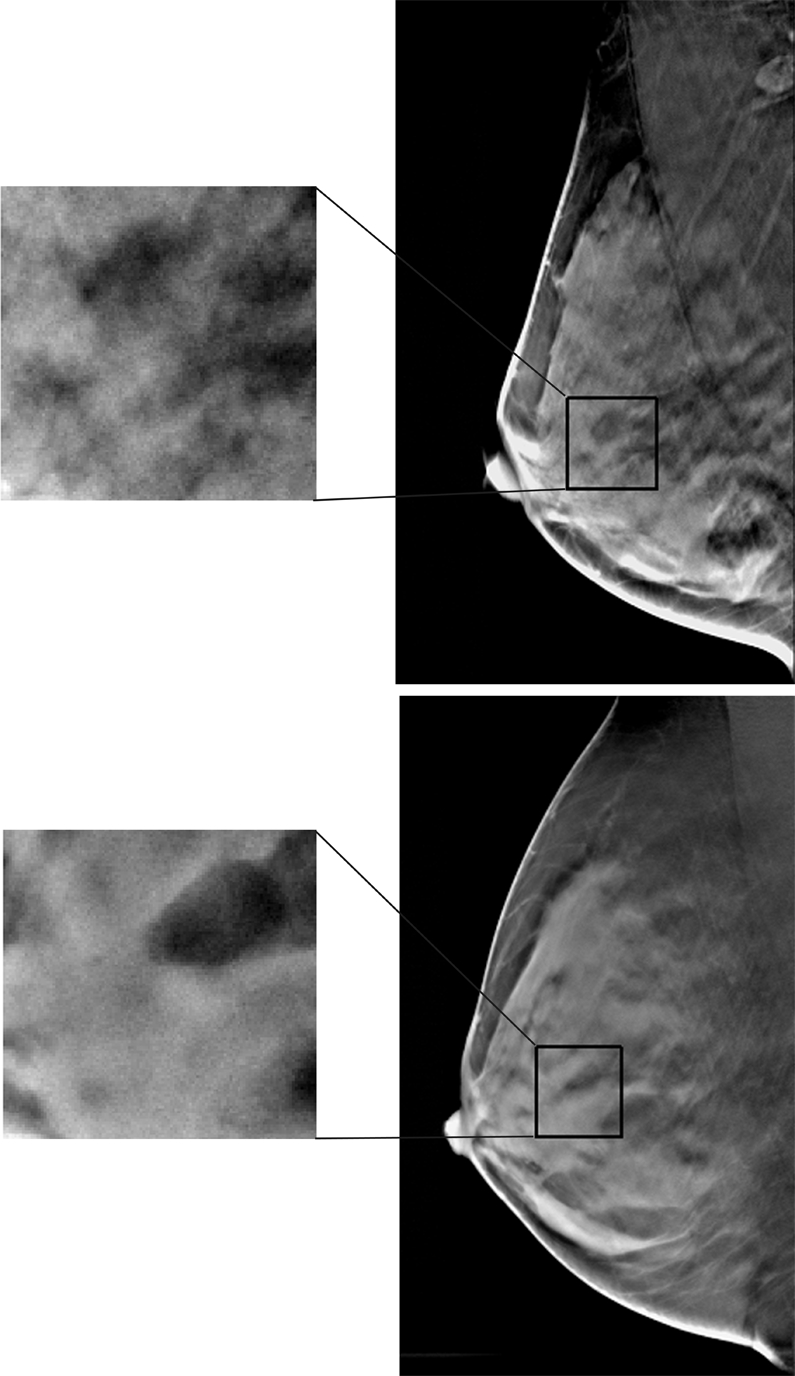
Examples of (a) digital mammograms and (b) corresponding DBT images in two 41-year-old women with the same overall PD (45%) and different parenchymal patterns, as demonstrated by a range of different parenchymal texture descriptors in the retroareolar breast region. Top images are from one woman and bottom images are from another. For upper image in a: skewness = 0.161, coarseness = 2.773 × 10⁻⁴, contrast = 1.607, energy = 0.018, homogeneity = 0.617, and fractal dimension = 2.538; for lower image in a: skewness = −0.146, coarseness = 3.558 × 10⁻⁴, contrast = 1.619, energy = 0.013, homogeneity = 0.616, and fractal dimension = 2.548. For upper image in b: skewness = 0.051, coarseness = 0.0015, contrast = 588.06, energy = 7.383 × 10⁻⁵, homogeneity = 0.112, and fractal dimension = 2.835; for lower image in b: skewness = 0.817, coarseness = 0.0016, contrast = 313.32, energy = 1.160 × 10⁻⁴, homogeneity = 0.142, and fractal dimension = 3.123.
Statistical Analysis
Correlation analysis and univariate linear regression were performed to determine the association between the individual texture features and the corresponding breast PD estimates (Matlab R2010b; Mathworks, Natick, Mass). To investigate associations between texture feature combinations and breast PD, principal component analysis (PCA) was performed to construct orthogonal texture components and remove multicolinearity effects (48). Texture features were normalized before PCA by using the z score (49). Multiple linear regression with a generalized estimating equation (50,51) was applied to model the association between the orthogonal PCA texture components and breast PD. The generalized estimating equation was implemented by using the robust covariance matrix (52) to adjust for bilateral correlations of the PCA texture components in the regression analysis. Age was also evaluated as a predictor of breast PD both independently and as an additional predictor in the multivariate models. The R2 and adjusted R2 metrics were used to assess goodness of fit. A P value threshold of .01 was used to determine statistically significant differences. The Akaike information criterion (53) was used as a measure of goodness of fit to compare the performance between the different models. Bonferroni correction was considered to adjust for multiple comparisons in statistical significance across the different models (P = .01/5 = .002 with Bonferroni adjustment).
Results
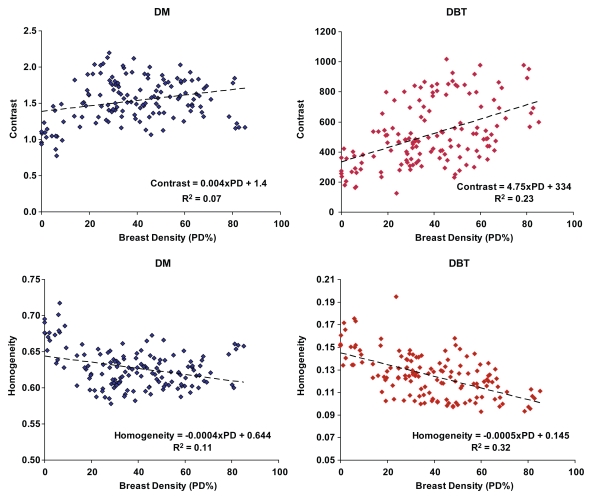
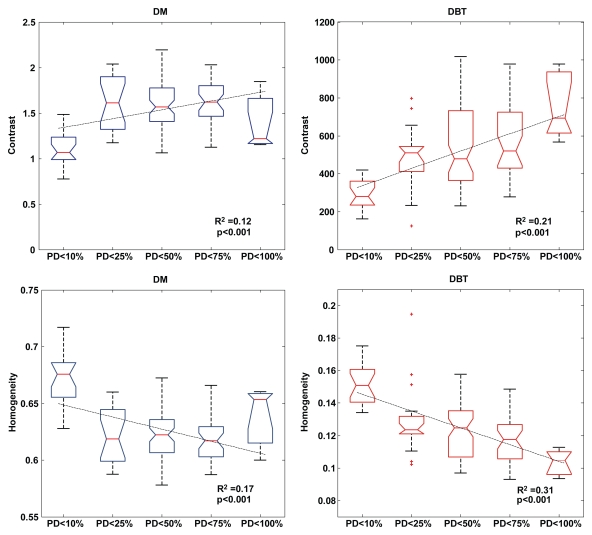
The computed breast PD varied from 0.07% to 85.11%, with a mean of 38.54%. For both digital mammography and DBT, the strongest correlations were observed for the Haralick co-occurrence texture features—which were stronger with DBT than with digital mammography (Table 1). Statistically significant correlations (P ≤ .001) were observed for contrast (r = 0.48), energy (r = −0.47), and homogeneity (r = −0.56) with DBT and for contrast (r = 0.26), energy (r = −0.26), and homogeneity (r = −0.33) with digital mammography. Texture features at DBT showed stronger linear trends with the computed breast PD values compared with those at digital mammography, as evidenced by the steeper slopes and higher R2 estimates (Fig 3). Compared with the texture features at digital mammography, texture features at DBT had a stronger dependency on the different breast PD categories, as evidenced by the steeper linear trends and higher R2 estimates (Fig 4).
Table 1.
Correlation between Parenchymal Texture Features and Breast PD

Data are Pearson correlation coefficients.
Figure 3:
Scatterplots of contrast and homogeneity versus breast PD for digital mammography (DM) and DBT. Fitted linear regression lines are also shown. Texture features have stronger linear trends over the range of breast PD estimates with DBT than with digital mammography.
Figure 4:
Box plots, with fitted linear regression lines, of contrast and homogeneity at digital mammography (DM) and DBT versus increasing categories of breast PD, as established by Boyd et al (10,18). Texture features at DBT have a stronger dependency on the different categories of breast PD than do those at digital mammography.
When we investigated the association between combinations of texture features and breast PD, the DBT multiple linear regression models demonstrated stronger associations between the PCA texture components and breast PD than did the digital mammography models, as evidenced by the lower mean square error of the residual fits (mean square error for digital mammography: 354; mean square error for DBT: 298.16), the higher R2 estimates (R2 = 0.28 for digital mammography and 0.38 for DBT), and the significant P values (P = .21 for digital mammography and <.001 for DBT).
The results of the different multiple regression models correlating PCA texture components and breast PD for digital mammography and DBT are shown in Table 2 (details about the model coefficients are provided in Appendix E1, online). The model including only the digital mammography PCA texture components as PD predictors was not statistically significant (R2 = 0.28; P = 0.21, analysis of variance [ANOVA]). When age was added as an additional predictor of breast PD, the regression model was statistically significant (R2 = 0.28, P = .002, ANOVA) and the fifth and sixth PCA texture components were identified as the most significant predictors (P = .02 for the fifth PCA component; P < .001 for the sixth PCA component) in addition to age (P = .005).
Table 2.
Multiple Linear Regression Models of PCA Texture Components and Age as Predictors of Breast PD

DM-I = digital mammography model with only PCA texture components as predictors; DM-II = digital mammography model with PCA texture components and age as predictors; DBT-I = DBT model with only PCA texture components as predictors; DBT-II = DBT model with PCA texture components and age as predictors; AGE = model with age as the only predictor.
AIC = Akaike information criterion.
Both of the corresponding regression models for DBT were statistically significant (R2 = 0.38 for the model including only PCA texture components as predictors, R2 = 0.41 for the model with PCA components and age as predictors; P < .001, ANOVA). In the model including only the PCA texture components as predictors of breast PD, the first two components were identified as the most significant (P = .002 for the first component, P < .001 for the second component). When age was included as an additional predictor of breast PD, the first two PCA texture components were again identified as the most significant (P = .003 for the first component, P < .001 for the second component) in addition to age (P < .001), and the observed predictive association was stronger.
For comparison, regression was also performed with age as the only predictor of breast PD (P < .001, ANOVA). As shown in Table 2, the observed associations between combinations of the PCA texture features and age as predictors of breast PD were stronger than the corresponding association when age alone was considered as the only predictor of breast PD (R2 = 0.09) for both digital mammography and DBT. The DBT model incorporating PCA texture components and age as predictor variables of breast PD achieved the best performance based on the Akaike information criterion (Table 2, lowest Akaike information criterion = 810.49). Note that even when Bonferroni correction was considered at a significance level of P = .01 for the five models compared, all models, except the one with only PCA texture components as predictors, retained statistical significance (P = .002 with Bonferroni adjustment).
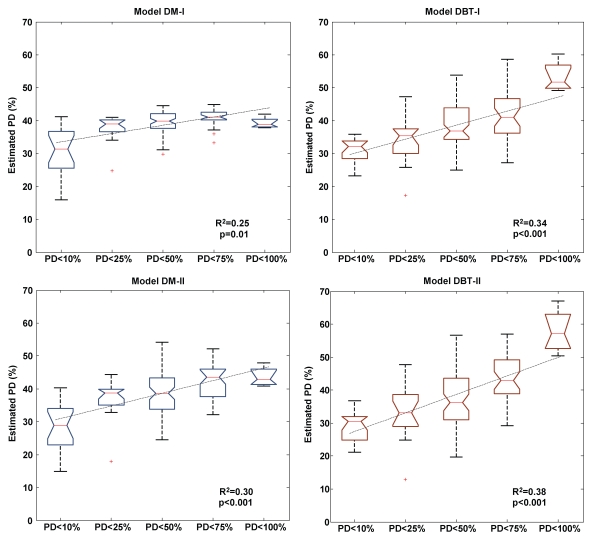
Breast PD estimates obtained with the DBT regression models were more strongly associated with the different categories of breast PD, as evidenced by the steeper slopes of the linear regression fits, the higher R2 values, and the statistically significant P values (P < .001, Fig 5). The observed associations with both digital mammography and DBT models are again stronger when age was added as an additional predictor of the breast PD category of risk.
Figure 5:
Box plots, with fitted linear regression lines, of breast PD estimated with multiple linear regression models versus increasing categories of breast PD, as established by Boyd et al (10,18). The DBT model estimates are more strongly associated with the different breast PD categories of risk than are the digital mammography model estimates. DBT-I = DBT model with only PCA texture components as predictors, DBT-II = DBT model with PCA texture components and age as predictors, DM-I = digital mammography model with only PCA texture components as predictors, DM-II = digital mammography model with PCA texture components and age as predictors.
Discussion
Our results demonstrate that parenchymal texture features at DBT are more strongly correlated with breast PD than are those at digital mammography, suggesting that DBT image texture analysis can provide more informative imaging features with which to characterize parenchymal patterns. Our results from this screening population of women are in agreement with data published from our previous pilot study with a diagnostic population of women at high risk for breast cancer (35). Given that breast cancer risk assessment is likely to have value primarily in the screening setting for prevention and early detection, this confirmatory study with a screening population of women investigates the potential impact of our previously reported techniques in the actual clinical population of interest.
In addition, in this study we built on our previous investigation by performing multivariate analysis to determine the combined effect of the parenchymal texture components, rather than just the individual components reported previously, in association with parenchymal density patterns. We also considered the effect of age both in combination with the extracted image texture features and alone (ie, univariate model) as a predictor of density (ie, risk). We believe that this multivariate analysis will pave the way for an integrated modeling approach that will incorporate demographics, familiar risk factors, and novel imaging markers into an augmented breast cancer risk assessment model for the general population.
We attribute the stronger linear association of the DBT texture features with breast PD to the tomographic separation of the parenchymal tissue layers in DBT. By alleviating the effect of tissue superposition in digital mammography, DBT offers the ability to analyze the fibroglandular tissue texture selectively, therefore providing features that are more strongly associated with the underlying fibroglandular (ie, dense) tissue patterns.
Starting with the pioneering work of Wolfe in 1976 (54), several studies have demonstrated an association between breast parenchymal pattern complexity and breast cancer risk (10–12,55,56). In our study, breast PD was used as a short-term surrogate of breast cancer risk. Although significant associations were detected between the extracted parenchymal texture features and breast PD, the observed correlations indicate that the variability in breast PD does not appear to be fully accounted for by the texture feature components, as evidenced by the R2 values of the corresponding regression models (R2 = 0.28 with the digital mammography model when only PCA texture components were used as predictors, R2 = 0.38 with use the DBT model when only PCA texture components were used as predictors).
Currently, there is no standard lexicon that reflects parenchymal complexity completely; in mammography, breast density is the only image-based descriptor in the standard clinical Breast Imaging Reporting and Data System lexicon (57). Breast PD is a measure of the amount of fibroglandular tissue in the breast. Parenchymal texture features characterize the complexity of the parenchymal tissue composition, as reflected by the underlying epithelial and stromal breast tissue components (58,59), by quantifying properties of the distribution of the gray-level values in the image. Therefore, these textural features capture different information than that provided by breast PD with respect to the complexity of the parenchymal pattern and could ultimately be combined with breast density measures to provide more comprehensive imaging descriptors of breast tissue composition and complexity.
The research question yet to be fully investigated is to what extent parenchymal texture descriptors can complement breast density measures in breast cancer risk estimation. Most studies published to date addressing this question have used digitized screen-film mammograms for parenchymal texture analysis (23,55,56). Manduca et al (23) showed that parenchymal texture features can help predict breast cancer risk with similar odds ratios to that of breast density and that these features retain statistical significance even when breast density is included in a risk prediction model. Studies with BRCA1/2 carriers have shown that, despite observing the same distribution of breast density in BRCA1/2 carriers and the general population (60), mammographic texture features can help differentiate the patterns in BRCA1/2 carriers from those in women at low risk for cancer (24–28). A prospective clinical trial with digital mammography, DBT, and long-term patient follow-up will enable estimation of the relative risk of breast cancer and corresponding odds ratios associated with parenchymal texture in digital mammography versus DBT and will also allow the investigation of the attributable predictive value of various parenchymal texture descriptors when breast density measures are also considered in risk estimation. In our study, the observed associations between parenchymal texture features and breast PD were stronger when age was added as a predictor of PD (R2 = 0.38 with the DBT model when only PCA texture components were used as predictors, R2 = 0.41 with DBT model when PCA components and age were used as predictors, P < .001), indicating the need to consider additional patient risk factors to fully predict risk.
Our conclusions are limited by the use of a specific DBT prototype imaging system. Considering that image gray levels in DBT may be affected by factors such as the image acquisition geometry and the reconstruction algorithm (33,61), future work must investigate approaches to standardize the computed texture features across imaging platforms and processing algorithms. Preliminary studies with simulated phantoms have shown that although the angular range of the x-ray tube rotation and the number of source projections in DBT can affect the distributions of the computed texture features, the individual values are highly correlated and appear to follow specific nonlinear trends (62). Therefore, standardization of computerized descriptors should be feasible through investigation and, therefore, ultimately within reach of wide-scale dissemination. The concurrence of results, however, between our current study and the previous pilot study (35) despite the use of different imaging systems further validates the predictive value of our proposed imaging markers.
Future approaches may also include the investigation of areas of the breast other than the retroareolar region (eg, the entire breast region or the tissue regions specifically attributed to fibroglandular tissue) and the evaluation of a more comprehensive feature set of texture descriptors. In our study, considering the potential bias of overfitting due to the size of our dataset and issues with multiple comparisons, we chose to average the texture features over the DBT tomographic sections to obtain an estimate of the mean global texture within the ROI. We realize, however, that by estimating the mean value, additional information about the richness of the feature set, including higher moments and variance, could be lost. Larger clinical studies in the future will allow a more thorough investigation of feature extraction and feature merging algorithms in direct association with the clinical outcome of interest (ie, follow-up for cancer status).
There is increasing interest in the augmentation of breast cancer risk assessment models with measures of breast density to improve their discriminatory accuracy (14–17). Parenchymal texture analysis in DBT could provide a wide range of quantitative parenchymal pattern descriptors that can be implemented by automated computerized algorithms. The rapidly emerging technical improvements in DBT image quality and reconstruction (63–72), the relatively low cost, and the potential for superior clinical performance (73–79) will determine the ultimate role of DBT in clinical practice. Recent data suggest a substantial benefit from DBT in the reduction of recall rates and the number of subsequent unnecessary biopsies in women in the screening setting (74,80–82), indicating a potential future role for DBT in breast cancer screening.
The reproducibility and automation of DBT parenchymal texture descriptors could ultimately accelerate the incorporation of imaging biomarkers in clinical breast cancer risk assessment. A refined cancer risk estimator incorporating such imaging biomarkers of risk could be of great clinical advantage in reaching the goal of customizing screening recommendations on the basis of personal risk levels, tailoring individual treatments, and forming preventive strategies—especially for women at a higher risk of breast cancer.
Advances in Knowledge.
Computerized parenchymal texture analysis can be used to characterize breast parenchymal patterns quantitatively on digital breast tomosynthesis (DBT) images.
Texture features at DBT are more strongly correlated with breast density patterns than are those at digital mammography (Pearson correlation r: −0.56 ≤ r [DBT] ≤ 0.48, −0.33 ≤ r [digital mammography] ≤ 0.26).
Parenchymal texture features capture information different from that of breast density with respect to the complexity of the parenchymal pattern (linear regression R2: R2 = 0.38 with DBT and 0.28 < 1.0 with digital mammography).
Implications for Patient Care.
Parenchymal texture features at DBT have the potential to be used as imaging biomarkers to identify women at high risk for breast cancer, so that customized screening protocols and individualized risk reduction strategies may be implemented.
Parenchymal texture features could be combined with breast density measures to provide a more comprehensive index for characterizing parenchymal pattern complexity.
Disclosures of Potential Conflicts of Interest: D.K. Financial activities related to the present article: none to disclose. Financial activities not related to the present article: received payment from Hologic for lectures including service on speakers bureaus. Other relationships: none to disclose. L.C.I. No potential conflicts of interest to disclose. P.R.B. Financial activities related to the present article: none to disclose. Financial activities not related to the present article: institution received money from Real-Time Tomography for grants/grants pending. Other relationships: none to disclose. A.B.T. No potential conflicts of interest to disclose. E.F.C. Financial activities related to the present article: none to disclose. Financial activities not related to the present article: received a consulting fee from Hologic; received royalties from Elsevier. Other relationships: none to disclose. A.D.A.M. Financial activities related to the present article: none to disclose. Financial activities not related to the present article: received money for consultancy from Real-Time Tomography. Other relationships: none to disclose.
Supplementary Material
Acknowledgments
We thank Martin Yaffe, MD, for providing the Cumulus software. We also thank Johnny Kuo, MD, for developing the RSNA Medical Imaging Resource Center (MIRC) image database archive.
Received May 27, 2010; revision requested July 13; revision received December 23; accepted January 18, 2011; final version accepted May 17.
Funding: This research was supported by the National Institutes of Health (grant P01-CA85484).
Supported by a research fellow grant from the Radiological Society of North America (RF0707) and a postdoctoral fellowship from the Susan G. Komen for the Cure Foundation (KG080756).
Abbreviations:
- ANOVA
- analysis of variance
- DBT
- digital breast tomosynthesis
- PCA
- principal component analysis
- PD
- percent density
- ROI
- region of interest
References
- 1.Lehman CD, Blume JD, Weatherall P, et al. Screening women at high risk for breast cancer with mammography and magnetic resonance imaging. Cancer 2005;103(9):1898–1905 [DOI] [PubMed] [Google Scholar]
- 2.Saslow D, Boetes C, Burke W, et al. American Cancer Society guidelines for breast screening with MRI as an adjunct to mammography. CA Cancer J Clin 2007;57(2):75–89 [DOI] [PubMed] [Google Scholar]
- 3.Kerlikowske K. Evidence-based breast cancer prevention: the importance of individual risk. Ann Intern Med 2009;151(10):750–752 [DOI] [PubMed] [Google Scholar]
- 4.Lehman CD, Isaacs C, Schnall MD, et al. Cancer yield of mammography, MR, and US in high-risk women: prospective multi-institution breast cancer screening study. Radiology 2007;244(2):381–388 [DOI] [PubMed] [Google Scholar]
- 5.Smith KL, Isaacs C. Management of women at increased risk for hereditary breast cancer. Breast Dis 2006–2007;27:51–67 [DOI] [PubMed] [Google Scholar]
- 6.Thomsen A, Kolesar JM. Chemoprevention of breast cancer. Am J Health Syst Pharm 2008;65(23):2221–2228 [DOI] [PubMed] [Google Scholar]
- 7.Mandelson MT, Oestreicher N, Porter PL, et al. Breast density as a predictor of mammographic detection: comparison of interval- and screen-detected cancers. J Natl Cancer Inst 2000;92(13):1081–1087 [DOI] [PubMed] [Google Scholar]
- 8.Boyd NF, Martin LJ, Bronskill M, Yaffe MJ, Duric N, Minkin S. Breast tissue composition and susceptibility to breast cancer. J Natl Cancer Inst 2010;102(16):1224–1237 [DOI] [PMC free article] [PubMed] [Google Scholar]
- 9.Martin LJ, Boyd NF. Mammographic density: potential mechanisms of breast cancer risk associated with mammographic density—hypotheses based on epidemiological evidence. Breast Cancer Res 2008;10(1):201. [DOI] [PMC free article] [PubMed] [Google Scholar]
- 10.Boyd NF, Guo H, Martin LJ, et al. Mammographic density and the risk and detection of breast cancer. N Engl J Med 2007;356(3):227–236 [DOI] [PubMed] [Google Scholar]
- 11.Vachon CM, van Gils CH, Sellers TA, et al. Mammographic density, breast cancer risk and risk prediction. Breast Cancer Res 2007;9(6):217. [DOI] [PMC free article] [PubMed] [Google Scholar]
- 12.Harvey JA, Bovbjerg VE. Quantitative assessment of mammographic breast density: relationship with breast cancer risk. Radiology 2004;230(1):29–41 [DOI] [PubMed] [Google Scholar]
- 13.Tice JA, Kerlikowske K. Screening and prevention of breast cancer in primary care. Prim Care 2009;36(3):533–558 [DOI] [PubMed] [Google Scholar]
- 14.Tice JA, Cummings SR, Ziv E, Kerlikowske K. Mammographic breast density and the Gail model for breast cancer risk prediction in a screening population. Breast Cancer Res Treat 2005;94(2):115–122 [DOI] [PubMed] [Google Scholar]
- 15.Tice JA, Cummings SR, Smith-Bindman R, Ichikawa L, Barlow WE, Kerlikowske K. Using clinical factors and mammographic breast density to estimate breast cancer risk: development and validation of a new predictive model. Ann Intern Med 2008;148(5):337–347 [DOI] [PMC free article] [PubMed] [Google Scholar]
- 16.Barlow WE, White E, Ballard-Barbash R, et al. Prospective breast cancer risk prediction model for women undergoing screening mammography. J Natl Cancer Inst 2006;98(17):1204–1214 [DOI] [PubMed] [Google Scholar]
- 17.Chen J, Pee D, Ayyagari R, et al. Projecting absolute invasive breast cancer risk in white women with a model that includes mammographic density. J Natl Cancer Inst 2006;98(17):1215–1226 [DOI] [PubMed] [Google Scholar]
- 18.Boyd NF, Byng JW, Jong RA, et al. Quantitative classification of mammographic densities and breast cancer risk: results from the Canadian National Breast Screening Study. J Natl Cancer Inst 1995;87(9):670–675 [DOI] [PubMed] [Google Scholar]
- 19.Nicholson BT, LoRusso AP, Smolkin M, Bovbjerg VE, Petroni GR, Harvey JA. Accuracy of assigned BI-RADS breast density category definitions. Acad Radiol 2006;13(9):1143–1149 [DOI] [PubMed] [Google Scholar]
- 20.Ooms EA, Zonderland HM, Eijkemans MJ, et al. Mammography: interobserver variability in breast density assessment. Breast 2007;16(6):568–576 [DOI] [PubMed] [Google Scholar]
- 21.Byng JW, Boyd NF, Fishell E, Jong RA, Yaffe MJ. Automated analysis of mammographic densities. Phys Med Biol 1996;41(5):909–923 [DOI] [PubMed] [Google Scholar]
- 22.Byng JW, Yaffe MJ, Lockwood GA, Little LE, Tritchler DL, Boyd NF. Automated analysis of mammographic densities and breast carcinoma risk. Cancer 1997;80(1):66–74 [DOI] [PubMed] [Google Scholar]
- 23.Manduca A, Carston MJ, Heine JJ, et al. Texture features from mammographic images and risk of breast cancer. Cancer Epidemiol Biomarkers Prev 2009;1(3):837–845 [DOI] [PMC free article] [PubMed] [Google Scholar]
- 24.Huo Z, Giger ML, Wolverton DE, Zhong W, Cumming S, Olopade OI. Computerized analysis of mammographic parenchymal patterns for breast cancer risk assessment: feature selection. Med Phys 2000;27(1):4–12 [DOI] [PubMed] [Google Scholar]
- 25.Huo Z, Giger ML, Olopade OI, et al. Computerized analysis of digitized mammograms of BRCA1 and BRCA2 gene mutation carriers. Radiology 2002;225(2):519–526 [DOI] [PubMed] [Google Scholar]
- 26.Li H, Giger ML, Olopade OI, Margolis A, Lan L, Chinander MR. Computerized texture analysis of mammographic parenchymal patterns of digitized mammograms. Acad Radiol 2005;12(7):863–873 [DOI] [PubMed] [Google Scholar]
- 27.Li H, Giger ML, Huo Z, et al. Computerized analysis of mammographic parenchymal patterns for assessing breast cancer risk: effect of ROI size and location. Med Phys 2004;31(3):549–555 [DOI] [PubMed] [Google Scholar]
- 28.Li H, Giger ML, Olopade OI, Lan L. Fractal analysis of mammographic parenchymal patterns in breast cancer risk assessment. Acad Radiol 2007;14(5):513–521 [DOI] [PubMed] [Google Scholar]
- 29.Kopans DB. Basic physics and doubts about relationship between mammographically determined tissue density and breast cancer risk. Radiology 2008;246(2):348–353 [DOI] [PubMed] [Google Scholar]
- 30.Park JM, Franken EA, Jr, Garg M, Fajardo LL, Niklason LT. Breast tomosynthesis: present considerations and future applications. RadioGraphics 2007;27(Suppl 1):S231–S240 [DOI] [PubMed] [Google Scholar]
- 31.Brusin JH. Digital mammography: an update. Radiol Technol 2006;77(3):226M–234M [PubMed] [Google Scholar]
- 32.Smith A. Full-field breast tomosynthesis. Radiol Manage 2005;27(5):25–31 [PubMed] [Google Scholar]
- 33.Wu T, Moore RH, Rafferty EA, Kopans DB. A comparison of reconstruction algorithms for breast tomosynthesis. Med Phys 2004;31(9):2636–2647 [DOI] [PubMed] [Google Scholar]
- 34.Niklason LT, Christian BT, Niklason LE, et al. Digital tomosynthesis in breast imaging. Radiology 1997;205(2):399–406 [DOI] [PubMed] [Google Scholar]
- 35.Kontos D, Bakic PR, Carton AK, Troxel AB, Conant EF, Maidment ADA. Parenchymal texture analysis in digital breast tomosynthesis for breast cancer risk estimation: a preliminary study. Acad Radiol 2009;16(3):283–298 [DOI] [PMC free article] [PubMed] [Google Scholar]
- 36.Bakic PR, Carton AK, Kontos D, Zhang C, Troxel AB, Maidment ADA. Breast percent density: estimation on digital mammograms and central tomosynthesis projections. Radiology 2009;252(1):40–49 [DOI] [PMC free article] [PubMed] [Google Scholar]
- 37.Byng JW, Yaffe MJ, Jong RA, et al. Analysis of mammographic density and breast cancer risk from digitized mammograms. RadioGraphics 1998;18(6):1587–1598 [DOI] [PubMed] [Google Scholar]
- 38.Byng JW, Boyd NF, Fishell E, Jong RA, Yaffe MJ. The quantitative analysis of mammographic densities. Phys Med Biol 1994;39(10):1629–1638 [DOI] [PubMed] [Google Scholar]
- 39.Yaffe MJ. Mammographic density: measurement of mammographic density. Breast Cancer Res 2008;10(3):209. [DOI] [PMC free article] [PubMed] [Google Scholar]
- 40.Harvey JA. Quantitative assessment of percent breast density: analog versus digital acquisition. Technol Cancer Res Treat 2004;3(6):611–616 [DOI] [PubMed] [Google Scholar]
- 41.Boyd NF, Martin LJ, Yaffe M, Minkin S. Mammographic density. Breast Cancer Res 2009;11(Suppl 3):S4. [DOI] [PMC free article] [PubMed] [Google Scholar]
- 42.Conant EF, Li D, Gavenonis S, et al. A comparative study of the inter-reader variability of breast percent density estimation in digital mammography: potential effect of reader’s training and clinical experience. In: Martí J, ed. Digital mammography (IWDM), lecture notes in computer science (LNCS). Berlin, Germany: Springer-Verlag, 2010; 114–120 [Google Scholar]
- 43.Li D, Gavenonis S, Conant EF, Kontos D. Comparison of breast percent density estimation from raw versus processed digital mammograms. In: Summers RM, van Ginneken B, eds. Proceedings of SPIE: medical imaging 2011—computer-aided diagnosis. Vol 7963 Bellingham, Wash: SPIE–The International Society for Optical Engineering, 2011; 79631X [Google Scholar]
- 44.Amadasun M, King R. Textural features corresponding to textural properties. IEEE Trans Syst Man Cybern 1989;19(5):1264–1274 [Google Scholar]
- 45.Haralick RM, Shanmugam K, Dinstein I. Textural features for image classification. IEEE Trans Syst Man Cybern 1973;3(6):610–621 [Google Scholar]
- 46.Li H, Giger ML, Olopade OI, Chinander MR. Power spectral analysis of mammographic parenchymal patterns for breast cancer risk assessment. J Digit Imaging 2008;21(2):145–152 [DOI] [PMC free article] [PubMed] [Google Scholar]
- 47.Kontos D, Bakic PR, Maidment ADA. Texture in digital breast tomosynthesis: a comparison between mammographic and tomographic characterization of parenchymal properties. In: Giger ML, Karssemeijer N, eds. Proceedings of SPIE: medical imaging 2008—computer-aided diagnosis. Vol 6915 Bellingham, Wash: SPIE–The International Society for Optical Engineering, 2008; 69150A [Google Scholar]
- 48.Duda R, Hart P, Stork D. Pattern classification. New York, NY: Wiley, 2000 [Google Scholar]
- 49.Glantz S. Primer of biostatistics. 6th ed New York, NY: McGraw-Hill, 2005 [Google Scholar]
- 50.Liang KY, Zeger SL. Longitudinal data analysis using generalized linear models. Biometrika 1986;73(1):13–22 [Google Scholar]
- 51.Ratcliffe SJ, Shults J. GEEQBOX: a Matlab toolbox for generalized estimating equations and quasi-least squares. J Stat Softw 2008;25(14):1–14 [Google Scholar]
- 52.Kontos D, Bakic PR, Troxel AB, Conant EF, Maidment ADA. Digital breast tomosynthesis parenchymal texture analysis for breast cancer risk estimation: a preliminary study. In: Krupinski EA, ed. Digital mammography (IWDM). Berlin, Germany: Springer-Verlag, 2008; 681–688 [Google Scholar]
- 53.Akaike H. Likelihood and the Bayes procedure. In: Bernardo JM, DeGroot MH, Lindley DV, Smith AFM, eds. Bayesian statistics. Valencia, Spain: University Press, 1980; 143–166 [Google Scholar]
- 54.Wolfe JN. Breast patterns as an index of risk for developing breast cancer. AJR Am J Roentgenol 1976;126(6):1130–1137 [DOI] [PubMed] [Google Scholar]
- 55.McCormack VA, dos Santos Silva I. Breast density and parenchymal patterns as markers of breast cancer risk: a meta-analysis. Cancer Epidemiol Biomarkers Prev 2006;15(6):1159–1169 [DOI] [PubMed] [Google Scholar]
- 56.Torres-Mejía G, De Stavola B, Allen DS, et al. Mammographic features and subsequent risk of breast cancer: a comparison of qualitative and quantitative evaluations in the Guernsey prospective studies. Cancer Epidemiol Biomarkers Prev 2005;14(5):1052–1059 [DOI] [PubMed] [Google Scholar]
- 57.American College of Radiology ACR Breast Imaging Reporting and Data System (BI-RADS) Atlas. Reston, Va: American College of Radiology, 2003 [Google Scholar]
- 58.Heine JJ, Malhotra P. Mammographic tissue, breast cancer risk, serial image analysis, and digital mammography. I. Tissue and related risk factors. Acad Radiol 2002;9(3):298–316 [DOI] [PubMed] [Google Scholar]
- 59.Heine JJ, Malhotra P. Mammographic tissue, breast cancer risk, serial image analysis, and digital mammography. II. Serial breast tissue change and related temporal influences. Acad Radiol 2002;9(3):317–335 [DOI] [PubMed] [Google Scholar]
- 60.Mitchell G, Antoniou AC, Warren R, et al. Mammographic density and breast cancer risk in BRCA1 and BRCA2 mutation carriers. Cancer Res 2006;66(3):1866–1872 [DOI] [PubMed] [Google Scholar]
- 61.Zhang Y, Chan HP, Sahiner B, et al. A comparative study of limited-angle cone-beam reconstruction methods for breast tomosynthesis. Med Phys 2006;33(10):3781–3795 [DOI] [PMC free article] [PubMed] [Google Scholar]
- 62.Kontos D, Zhang C, Ruiter NV, Bakic PR, Maidment ADA. Evaluating the effect of tomosynthesis acquisition parameters on image texture: a study based on an anthropomorphic breast tissue software model. In: Krupinski EA, ed. Digital mammography (IWDM). Berlin, Germany: Springer-Verlag, 2008; 491–498 [Google Scholar]
- 63.Zhao B, Zhou J, Hu YH, Mertelmeier T, Ludwig J, Zhao W. Experimental validation of a three-dimensional linear system model for breast tomosynthesis. Med Phys 2009;36(1):240–251 [DOI] [PMC free article] [PubMed] [Google Scholar]
- 64.Zhou J, Zhao B, Zhao W. A computer simulation platform for the optimization of a breast tomosynthesis system. Med Phys 2007;34(3):1098–1109 [DOI] [PubMed] [Google Scholar]
- 65.Sechopoulos I, Suryanarayanan S, Vedantham S, D’Orsi CJ, Karellas A. Scatter radiation in digital tomosynthesis of the breast. Med Phys 2007;34(2):564–576 [DOI] [PMC free article] [PubMed] [Google Scholar]
- 66.Sechopoulos I, Suryanarayanan S, Vedantham S, D’Orsi C, Karellas A. Computation of the glandular radiation dose in digital tomosynthesis of the breast. Med Phys 2007;34(1):221–232 [DOI] [PMC free article] [PubMed] [Google Scholar]
- 67.Chen Y, Lo JY, Dobbins JT., 3rd Importance of point-by-point back projection correction for isocentric motion in digital breast tomosynthesis: relevance to morphology of structures such as microcalcifications. Med Phys 2007;34(10):3885–3892 [DOI] [PubMed] [Google Scholar]
- 68.Badano A, Kyprianou IS, Jennings RJ, Sempau J. Anisotropic imaging performance in breast tomosynthesis. Med Phys 2007;34(11):4076–4091 [DOI] [PubMed] [Google Scholar]
- 69.Wu T, Moore RH, Kopans DB. Voting strategy for artifact reduction in digital breast tomosynthesis. Med Phys 2006;33(7):2461–2471 [DOI] [PubMed] [Google Scholar]
- 70.Rakowski JT, Dennis MJ. A comparison of reconstruction algorithms for C-arm mammography tomosynthesis. Med Phys 2006;33(8):3018–3032 [DOI] [PubMed] [Google Scholar]
- 71.Mainprize JG, Bloomquist AK, Kempston MP, Yaffe MJ. Resolution at oblique incidence angles of a flat panel imager for breast tomosynthesis. Med Phys 2006;33(9):3159–3164 [DOI] [PubMed] [Google Scholar]
- 72.Gong X, Glick SJ, Liu B, Vedula AA, Thacker S. A computer simulation study comparing lesion detection accuracy with digital mammography, breast tomosynthesis, and cone-beam CT breast imaging. Med Phys 2006;33(4):1041–1052 [DOI] [PubMed] [Google Scholar]
- 73.Rafferty EA. Digital mammography: novel applications. Radiol Clin North Am 2007;45(5):831–843, vii [DOI] [PubMed] [Google Scholar]
- 74.Poplack SP, Tosteson TD, Kogel CA, Nagy HM. Digital breast tomosynthesis: initial experience in 98 women with abnormal digital screening mammography. AJR Am J Roentgenol 2007;189(3):616–623 [DOI] [PubMed] [Google Scholar]
- 75.Gur D. Tomosynthesis: potential clinical role in breast imaging. AJR Am J Roentgenol 2007;189(3):614–615 [DOI] [PubMed] [Google Scholar]
- 76.Diekmann F, Bick U. Tomosynthesis and contrast-enhanced digital mammography: recent advances in digital mammography. Eur Radiol 2007;17(12):3086–3092 [DOI] [PubMed] [Google Scholar]
- 77.Varjonen M, Pamilo M, Raulisto L. Clinical benefits of combined diagnostic three-dimensional digital breast tomosynthesis and ultrasound imaging. In: Flynn MJ, ed. Proceedings of SPIE: medical imaging 2005—physics of medical imaging. Vol 5745 Bellingham, Wash: SPIE–The International Society for Optical Engineering, 2005; 562–571 [Google Scholar]
- 78.Reddy DH, Mendelson EB. Incorporating new imaging models in breast cancer management. Curr Treat Options Oncol 2005;6(2):135–145 [DOI] [PubMed] [Google Scholar]
- 79.Rafferty EA. Tomosynthesis: new weapon in breast cancer fight. Decis Imaging Econ 2004; 17 [Google Scholar]
- 80.Smith AP, Rafferty EA, Niklason L. Clinical performance of breast tomosynthesis as a function of radiologist experience level digital mammography (IWDM). Berlin, Germany: Springer-Verlag, 2008; 61–66 [Google Scholar]
- 81.Kopans DB, Moore RH. Digital breast tomosynthesis (DBT) NCI 3000-women trial [abstr]. In: Radiological Society of North America Scientific Assembly and Annual Meeting Program. Oak Brook, Ill: Radiological Society of North America, 2009; 388–389 [Google Scholar]
- 82.Gur D, Abrams GS, Chough DM, et al. Digital breast tomosynthesis: observer performance study. AJR Am J Roentgenol 2009;193(2):586–591 [DOI] [PubMed] [Google Scholar]
- 83.Russ JC. Fractal surfaces. New York, NY: Plenum, 1994 [Google Scholar]
Associated Data
This section collects any data citations, data availability statements, or supplementary materials included in this article.


