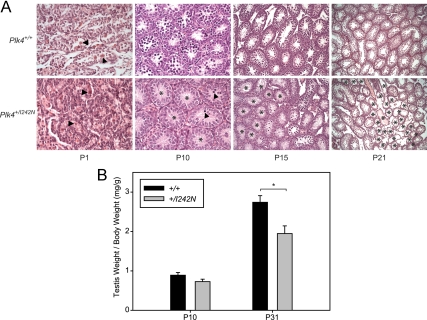
Fig. 6.
Time course for the onset of hypogonadism and germ cell loss. A, H&E testis sections from Plk4+/+ and Plk4+/I242N mice. Arrowheads denote germ cells, and asterisks denote tubules devoid of germ cells. P1 and P10 sections were visualized with a ×40 objective, P15 sections were visualized with a ×20 objective, and P21 sections were visualized with a ×10 objective. B, Quantification of testis weights.

