

Abstract
Associations between race, socioeconomic status (SES) and health outcomes have been well established. One of the ways in which race and SES affect health is by influencing one’s access to resources, which confers ability to avoid or mitigate adverse outcomes. The fundamental cause of disease approach argues that when a new screening tool is introduced, individuals with greater resources tend to have better access to the innovation, thus benefiting from early detection and leading to better survival. Conversely, when there is no established screening tool, racial and SES differences in early detection may be less pronounced. Most ovarian cancer is diagnosed at advanced stages, because of the lack of an effective screening tool and few early symptoms. However, once detected, racial differences may still be observed in mortality and survival outcomes. We examined the racial differences in diagnosis and survival among ovarian cancer cases diagnosed during 1994–1998, in Cook County, Illinois (N=351).
There were no racial differences in the stage at diagnosis: 51.7% of white and 52.9% of black women were diagnosed at later stages (III and IV). Only age was associated with the stage at diagnosis. Tumor characteristics also did not differ between white and black women. Compared to white women, black women were less likely to be married, less educated, more frequently used genital powder, had tubal ligation, and resided in higher poverty census tracts. As of December 31, 2005, 44.3% of white and 54.5% of black women had died of ovarian cancer. Controlling for known confounding variables, the hazard ratio for ovarian cancer death between black and white women was 2.2. The findings show that fundamental cause perspective provides a potential framework to explore subtleties in racial disparities, with which broader social causes may be accounted for in explaining post diagnosis racial differences.
Keywords: USA, ovarian cancer, stage at diagnosis, fundamental cause of disease, survival, mortality, race, ethnicity
Introduction
Although the overall health status of the US population has improved over the past decades, racial and socioeconomic differences in health outcomes have continued to exist (Margellos, Silva, & Whitman, 2004; Williams & Collins, 2001). In fact, Berkman (2009) questions whether we are losing ground in reducing socioeconomic disparities in health. Researchers have argued that one’s social position, often characterized by race and SES, affects one’s health status and outcomes (House & Williams, 2000; Shaw, Tunstall, & Smith, 2003; Sudano & Baker, 2006). Link and Phelan argue that these social factors affect one’s access to resources, such as knowledge, money, prestige, and social networks, which determines the ability to avoid diseases and to prevent adverse outcomes (Link, Northridge, Phelan, & Ganz, 1998; Link & Phelan, 1995, 2002). Consequently, when a new screening or treatment tool is introduced, those who are socially advantaged tend to have better access to the innovation, thus, are more likely to benefit from early detection and treatment.
Expanding this fundamental cause of disease approach, we ask an additional question examining racial differences in ovarian cancer in the US. We argue that when there is no effective screening tool, racial differences in diagnosis and detection are minimized. And yet, once the disease is detected, blacks would have a higher rate of mortality and their survival time would be significantly shorter compared to white counterparts. In this paper, we examine two aspects of racial disparities in ovarian cancer outcomes in the US: detection and survival. In the context of the fundamental cause of disease approach, we tested the following hypotheses: 1) the stage at diagnosis of ovarian cancer will not be significantly different between black and white women; however, 2) the length of survival from time of diagnosis to death will be significantly shorter for black women compared to white women.
Background
Health disparities
Racial differences in health in the US have been well documented (Geronimus, Bound, & Waidmann, 1999; House & Williams, 2000; Hummer, 1996). For the most part, blacks have higher rates of morbidity and mortality compared to whites. Life expectancy at birth was shorter for blacks (73.6 years) than for whites (78.5 years) in 2007 (Centers for Disease Control and Prevention [CDC], 2008a). Although the overall age-adjusted mortality rates have decreased for all Americans, the death rate of blacks was 1.3 times higher compared with whites in 2006 (CDC, 2008a). Disease-specific mortality rates for a variety of illnesses also have been higher among blacks than whites (Elo & Drevenstedt, 2004). For example, higher cancer mortality rates for blacks than whites have been observed over time (American cancer society [ACS], 2004; US Cancer Statistics Working Group, 2007). The mortality rates for colorectal, prostate, breast, and cervical cancers among blacks have been higher compared with the rates among whites, and the racial differences held true after controlling for SES; and even in the highest SES strata, mortality rates were still higher for blacks compared to whites (Chu, Miller, & Springfield, 2007). Furthermore, the racial disparities in cancer mortality rates not only sustained in the periods of 1990–2000 in the US, but for some cancer sites, the racial differences actually have widened.
Fundamental cause approach
Fundamental cause of disease approach argues that differential social conditions between racial and SES groups are underlying reasons for the persistent racial disparities in a broad range of health indicators over time (Link et al., 1998; McKeown, 1976, 2005). The fundamental cause perspective asserts that the ability to minimize adverse health outcomes often depends on one’s resource accessibility (Link & Phelan, 1995). Generally, resources influence health by facilitating lifestyle behaviors that favorably affect levels of exposure to risk and protective factors to prevent diseases, improve health status, and mitigate adverse outcomes (Link et al., 1998; Link & Phelan, 1995). Even if new treatment technologies emerge over time, the gap in health outcomes between black and white racial groups may remain unchanged, unless inequalities in access to resources are addressed (Link & Phelan, 2005).
In some instances, we observe a shift in the pattern of racial differences, as new information or technology is introduced. For example, the mortality rate of lung cancer was higher for whites than for blacks before the 1960s. The second report on the mortality of British Doctors Study was published in 1956, and by then it was clearly concluded that smoking increases the risk of lung cancer (Doll & Hill, 1956). After the knowledge regarding the association between smoking and lung cancer was made available to the public in the mid 60s with the first Surgeon General’s report on smoking and health, the lung cancer mortality rate has declined faster among whites than blacks (Schneiderman & Levin, 1972). In the mid 60s, the lung cancer mortality rate for blacks surpassed the rate for whites and this pattern persists to this day (Horner et al., 2009).
SES and race are key components of social stratification particularly in the US (Massey, 2007). A frequent topic of recent health disparity research is: whether race is solely a marker for one’s socioeconomic location or whether race represents additional social conditions, such as discrimination or social exclusion, which may independently affect health outcomes even after controlling for SES (Cummings & Jackson, 2008; Williams & Jackson, 2005; Winkleby, Cubbin, Ahn, & Kraemer, 2006). But race and SES are often closely associated and together influence one’s access to resources and exposure to risks (Chen, Martin, & Matthews, 2006; Galea et al., 2007; Kawachi & Lochner, 2002).
Ovarian cancer epidemiology
Ovarian cancer is the fifth leading cause of female cancer deaths in the US; more than 22,000 women are diagnosed with ovarian cancer and 16,000 women die from the disease each year (Jemal et al., 2009). Concerning ovarian cancer, incidence and mortality rates are in fact higher for white women compared to the rates among black women. Between 2001 and 2005, the incidence rate was 14.3 per 100,000 white women and 10.1 per 100,000 black women (Jemal et al., 2009). The annual ovarian cancer mortality rate was also higher for white women (8.9 per 100,000) compared to the rate for black women (6.9 per 100,000) (Horner et al., 2009). Globally, the ovarian cancer incidence rates are higher in highly industrialized countries, such as Northern Europe (13.3 per 100,000) compared to the rates in Africa, such as Eastern (5.8 per 100,000) or Northern (2.6 per 100,000) Africa (Parkin, Bray, Ferlay, & Pisani, 2005).
The National Cancer Institute (NCI) defines cancer health disparities as “differences in the incidence, prevalence, mortality, and burden of cancer and related adverse health conditions that exist among specific population groups in the United States” (Center to Reduce Cancer Health Disparities, 2009). Although incidence and mortality rates are useful indicators for cancer disparities, these measures may miss subtle differences in cancer outcomes between racial groups. For example, while the ovarian cancer incidence and mortality rates have been consistently higher for whites compared to blacks, the five-year relative survival rate was lower in black women (37.5%) compared to white women (44.7%), between 1996 and 2003 (Horner et al., 2009).
A myriad of risk factors affect the incidence and survival of ovarian cancer. Family history of ovarian cancer is negatively associated with survival (Kupelian et al., 2006; Whittemore, Harris, & Itnyre, 1992; Yancik, 1993), and the risk of ovarian cancer, in general, increases with age (Brescia & Dubin, 1989; Storey et al., 2008). Early age of menarche and hormone replacement therapy (HRT) use have been reported to increase the risk of ovarian cancer (Beral & Million Women Study Collaborators, 2007; Lacey et al., 2002; Modugno et al., 2004). Although the findings are rather mixed, genital talcum powder use may increase the risk of ovarian cancer (Gertrg et al., 2000; Huncharek, Geschwind, & Kupelnick, 2003). The ovarian cancer risk decreases with the use of oral contraceptives, parity, and greater number of lifetime ovulatory cycles (Adami et al., 1994; Robbins et al., 2009; Whittemore et al., 1992). Other factors associated with ovarian cancer risk reduction are tubal ligation and hysterectomy (Green et al., 1997; Hankinson et al., 1993; Wong & Singh, 2003).
Tumor characteristics are closely associated with prognosis of ovarian cancer. Stage of disease at diagnosis, histologic grade, and extent of residual disease are known factors affecting prognosis of ovarian cancer (Agarwal & Kaye, 2005; Winter et al., 2007). Ovarian cancer cases are classified utilizing the International Federation of Gynecology and Obstetrics (FIGO) staging system (Pecorelli, Benedet, Creasman, & Shepherd, 1999). Stage I represents cancer limited to ovaries; Stage II indicates disease contained within the pelvic cavity; Stage III cancer has spread outside of the pelvis and into the peritoneal cavity; and Stage IV specifies distant metastasis. Ovarian cancer is also classified according to the histology of the tumor. Grade describes the degree of abnormality (differentiation), which relates to the clinical behavior of tumor. Grade ranges from borderline, well-defined (Grade 1), moderately differentiated (grade 2), to poorly differentiated (Grade 3 and 4). Some cases are not graded for various reasons (grade X) (Chen et al., 2003). Women diagnosed with ovarian cancer at an earlier stage, where the tumor is localized and well-differentiated, tend to have better prognosis.
Dietary patterns have been suggested to influence survival after a cancer diagnosis (Nagle et al., 2003; Prentice et al., 2007). Indices of diet quality such as the recommended food score (RFS), have been reported to be associated with survival outcomes for various types of cancers, including ovarian cancer (Mai et al., 2005). The RFS is based on reported food intake based on dietary guidelines, which emphasize consumption of fruits, vegetables, whole grains, and lean meats (Mai et al., 2005; Dolecek et al., 2009). Dolecek and others (2008 (2009) also reported that cured and red meat consumption was negatively and fruits and vegetables were favorably associated with ovarian cancer survival.
The risk of ovarian cancer death increased among long-term (five or more years) estrogen users (Danforth, et al., 2007). Early age of menarche and HRT use are also known to negatively affect ovarian cancer prognosis (Beral & Million Women Study Collaborators, 2007; Lacey et al., 2002; Modugno et al., 2004).
Cancer survival may be also associated with quality of health care (Albain, Unger, Crowley, Coltman, & Hershman, 2009; Hershman et al., 2009). Researchers argue that compared to white women, black women are less likely to receive specialist consultation or surgery, more likely to underuse therapy, and more likely to experience treatment delay (Du et al., 2008; Hershman et al., 2009; Steyerberg, Earle, Neville, & Weeks, 2005). In addition, Hand and colleagues (1991) found that urban hospitals with more poorly insured patients were associated with late diagnoses of breast cancer. Higher volume hospitals, particularly the volume of specific procedures, seem to show better patient outcomes, indicating the presence of more practiced care providers (Allareddy, Allareddy, & Konety, 2007; Shahian & Normand, 2003). And, ethnic minorities were more likely to receive care in lower volume hospitals and were less likely to be referred to specialists in high-volume hospitals compared with white patients (Trivedi, Sequist, & Ayanian, 2006).
Often, early detection improves cancer outcomes and survival (Bast et al., 2007; CDC, 2008b; Jacobs & Menon, 2004). Unlike breast or cervical cancer, however, no effective and reliable screening measures exist for ovarian cancer, resulting in delayed detection (Buys et al., 2005; Calonge & US Preventive Services Task Force, 2004; Horner et al., 2009). Additionally, ovarian cancer often exhibits very few early symptoms (Jacobs & Menon, 2004). The majority of ovarian cancer cases are detected after the cancer has already metastasized (Buys et al., 2005), often resulting poor prognosis. Given these characteristics, ovarian cancer presents a unique opportunity for exploring subtle racial disparities.
Methods
Data
The study utilized data on women diagnosed with ovarian cancer who participated in a case-control study. The original study included 351 women diagnosed with epithelial ovarian cancer in Cook County, Illinois from June 1, 1994 through January 31, 1998. The ovarian cancer patients were diagnosed in 47 hospitals located throughout Cook and surrounding counties which included 291 census tract areas, ranging from 1 to 4 cases in each census tract. All cases participating in the study underwent surgery as initial treatment. However, additional information on follow-up treatment was not available for the cohort. The protocol was approved by the University of Illinois at Chicago IRB.
To determine vital status of these cancer cases, a National Death Index (NDI) search was conducted through 2005. From the NDI search, 70.1% (n=246) were matched to the death files and 29.9% (n=105) were not matched. Of those matched cases, 161 cases were documented as death from ovarian cancer.
Variables
We examined stage at diagnosis and length of survival from date of diagnosis to date of death (or censored) for the ovarian cancer cases. The demographic variables, race (black vs. white women), years of education, and marital status (currently married vs. other), were included in the analysis. Case residential addresses at the time of diagnosis were geocoded allowing census tract level percent of residents living below poverty line to be used as an area-based measure of SES. We controlled for known characteristics associated with ovarian cancer incidence and survival including: age at diagnosis, grade of tumor, and the presence of residual lesions (greater than 2 cm vs. less than 2 cm). Other factors associated with incidence and prognosis were also controlled for: smoking history, genital powder use, oral contraceptive use, hormone use, familial cancer history, parity, age at menarche, length of ovulatory period (LOP), tubal ligation, hysterectomy, and recommended food score.
Smoking history, genital power use, oral contraceptive use, and familial cancer history were dichotomous variable (yes vs. no). Hormone use was a dichotomous variable indicating five or more years of hormone use. Familial cancer history was a dichotomous variable on whether or not the woman has any family members who had cancer. Parity was a four ordinal category variable (none, 1, 2, and three or more). Age at menarche and recommended food score were continuous variables. The recommended food score, a measure that reflects optimal diet for cancer prevention, was calculated using information from a validated food frequency questionnaire which ascertained usual dietary intake (Block et al., 1986; Mai et al., 2005).
To estimate the length of ovulatory period, we calculated the length of potential ovulatory period in months: from age at menarche to age at the point of interview (or up to 50 years old). We then subtracted months being pregnant, the length of time not having period after pregnancy, and months of being on oral contraceptives from the potential ovulatory period. Finally, the tertile (low, medium, and high) of the length of ovulatory period was examined within age group (20–40, 41–50, and older than 51), to separate out the effects of age itself from the length of ovulatory period.
Two health services related factors known to be associated with outcomes were included: Annual number of patients served and the proportion of Medicaid patients, utilizing the Research Oriented DataSet (RODS) (Hand et al., 1991). Three dummy variables (low, medium, and high) were created for the percent of Medicaid patients.
Analysis
We examined differences between black and white women in tumor characteristics (Table 1) and risk factors (Table 2). Chi-square and t-tests were used to identify statistically significant differences for these descriptive comparisons.
Table 1.
Distribution of selected characteristics of ovarian cancer cases by race
| Total | White | Black | p | |
|---|---|---|---|---|
| Number of cases | 351 | 296 | 55 | |
|
| ||||
| Mean age at diagnosis | 52.4 | 52.3 | 52.9 | n.s. |
|
| ||||
| % Stage at diagnosis | n.s. | |||
| Stage I | 39.0 | 40.3 | 39.2 | |
| Stage II | 7.7 | 7.9 | 7.8 | |
| Stage III | 42.7 | 44.1 | 43.1 | |
| Stage IV | 7.7 | 7.6 | 9.8 | |
|
| ||||
| Mean age by stage at diagnosis | n.s. | |||
| Stage I | 49.6 | 49.3 | 51.6 | |
| Stage II | 51.6 | 51.5 | 51.7 | |
| Stage III | 54.9 | 55.0 | 54.5 | |
| Stage IV | 56.2 | 56.7 | 54.0 | |
|
| ||||
| % Grade | n.s. | |||
| Borderline | 20.2 | 20.9 | 16.4 | |
| Grade 1 | 10.8 | 10.5 | 12.7 | |
| Grade 2 | 20.5 | 19.9 | 23.6 | |
| Grade 3 & 4 | 36.8 | 37.8 | 30.9 | |
| Grade X | 11.7 | 10.8 | 16.4 | |
|
| ||||
| % Residual lesions | n.s. | |||
| < 2 cm | 63.6 | 63.8 | 62.7 | |
| >= 2 cm | 36.4 | 36.2 | 37.3 | |
|
| ||||
| % Vital status | n.s. | |||
| Ovarian cancer death | 45.9 | 44.3 | 54.5 | |
| Other death | 5.1 | 4.7 | 7.3 | |
| Alive | 49.0 | 51.0 | 38.2 | |
|
| ||||
| Mean length of survival | 6.7 years | 6.9 years | 5.8 years | <.05 |
Table 2.
Distribution of ovarian cancer risk factors by race
| Total | White | Black | p | |
|---|---|---|---|---|
| Number of cases | 351 | 296 | 55 | |
|
| ||||
| % Marital status | <.01 | |||
| Currently married | 56.7 | 61.8 | 29.1 | |
| Other | 43.3 | 38.2 | 70.9 | |
|
| ||||
| Mean years of education | 13.5 | 13.6 | 12.7 | <.05 |
|
| ||||
| Mean age at menarche | 12.6 | 12.6 | 12.4 | n.s. |
|
| ||||
| % Parity | n.s. | |||
| Nulliparous | 24.2 | 23.6 | 27.3 | |
| 1 child | 16.2 | 16.9 | 12.7 | |
| 2 children | 21.4 | 21.6 | 20.0 | |
| 3 or more children | 38.2 | 37.8 | 40.0 | |
|
| ||||
| % Length of ovulatory period | n.s. | |||
| Low | 33.0 | 32.1 | 38.2 | |
| Medium | 33.9 | 35.1 | 27.3 | |
| High | 33.0 | 32.8 | 34.5 | |
|
| ||||
| % Familial cancer history | 56.7 | 58.8 | 45.5 | n.s. |
|
| ||||
| % Oral contraceptive use | 53.0 | 54.7 | 43.6 | n.s. |
|
| ||||
| % Hormone use, >=5yrs | 8.0 | 8.5 | 5.5 | n.s. |
|
| ||||
| % Tubal ligation | 12.9 | 11.2 | 21.8 | < .05 |
|
| ||||
| % Hysterectomy | 90.5 | 91.2 | 87.0 | n.s. |
|
| ||||
| % Smoking history | n.s. | |||
| Never | 42.2 | 41.9 | 43.6 | |
| Former | 37.3 | 37.2 | 38.2 | |
| Current | 20.5 | 20.9 | 18.2 | |
|
| ||||
| % Genital powder use | 14.2 | 11.3 | 29.6 | < .01 |
|
| ||||
| Mean recommended food score | 7.95 | 7.98 | 7.76 | n.s. |
|
| ||||
| % poverty for case residential census tract | 7.9 | 5.6 | 20.3 | <.01 |
|
| ||||
| Mean patient volume of diagnosing hospital | 21,220 | 21,141 | 21,640 | n.s. |
|
| ||||
| % Medicaid patients of diagnosing hospital | 16.5 | 14.9 | 25.0 | n.s. |
The two hypotheses were tested using a series of regression models. Ordinal regression models were used to examine difference in stage at diagnosis (Stages I to IV) by race. Model I included demographic variables only. Individual level risk factors were added into Model II. The full model, Model III, included hospital characteristics and the census level poverty variable. Odds ratios with 95% confidence intervals for explanatory variables are presented in Table 3. Cox proportional hazards regression analyses on survival time to event were performed (years from diagnosis to death or censored) to predict survival differences between the race groups (Table 4). Survival functions for black and white women were compared, controlling for age at diagnosis, stage, residual lesion, and grade, marital status, and education (Model I). We then entered other associated factors (Model II). Finally, hospital characteristics and the census level poverty variable were included (Model III).
Table 3.
Estimated odds ratio (95% CI) under ordinal regression models predicting ovariancancer stage at diagnosis
| OR (95% CI) | |||
|---|---|---|---|
| Model I | Model II | Model III | |
| Stage at diagnosis | |||
| Stage I (ref) | - | - | - |
| Stage II | 2.8 (0.6, 12.4) | 0.5 (0.02, 10.9) | 2.4 (0.1, 80.1) |
| Stage III | 3.9 (0.9, 17.5) | 0.7 (0.03, 15.7) | 3.5 (0.1, 116.4) |
| Stage IV | 53.3 (11.1, 255.5)** | 10.0 (0.4, 230.4) | 48.7 (1.4, 1689.7)* |
|
| |||
| Age at diagnosis | 1.03 (1.01, 1.05)** | 1.03 (1.01, 1.06)* | 1.03 (1.01, 1.06)* |
|
| |||
| Black women | 1.1 (0.6, 2.0) | 1.0 (0.6, 1.9) | 1.2 (0.6, 2.7) |
|
| |||
| Years of education | 1.0 (0.9, 1.0) | 1.0 (0.9, 1.0) | 1.0 (0.9, 1.0) |
|
| |||
| Currently married | 1.5 (1.0, 2.3) | 1.4 (0.9, 2.2) | 1.3 (0.8, 2.1) |
|
| |||
| Familial cancer | 0.7 (0.5, 1.2) | 0.7 (0.5, 1.2) | |
|
| |||
| Age at menarche | 0.9 (0.8, 1.0) | 0.9 (0.8, 1.1) | |
| LOP | |||
| Low (ref) | - | - | |
| Medium | 1.3 (0.7, 2.3) | 1.2 (0.7, 2.1) | |
| High | 0.9 (0.4, 1.7) | 0.8 (0.4, 1.6) | |
|
| |||
| Parity | |||
| Nulliparous (ref) | - | - | |
| 1 child | 1.2 (0.6, 2.5) | 1.4 (0.7, 2.8) | |
| 2 children | 1.1 (0.6, 2.3) | 1.3 (0.6, 2.5) | |
| 3 or more children | 1.0 (0.5, 2.0) | 1.0 (0.5, 2.1) | |
|
| |||
| Smoking history | 1.0 (0.6, 1.6) | 1.0 (0.7, 1.6) | |
|
| |||
| Oral contraceptive use | 1.2 (0.7, 2.0) | 1.2 (0.7, 2.2) | |
|
| |||
| Hormone use, >=5yrs | 0.6 (0.3, 1.2) | 0.6 (0.3, 1.3) | |
|
| |||
| Genital powder use | 1.5 (0.8, 2.7) | 1.5 (0.8, 2.9) | |
|
| |||
| Tubal ligation | 0.9 (0.5, 1.8) | 0.9 (0.4, 1.7) | |
|
| |||
| Hysterectomy | 1.8 (0.8, 4.0) | 1.9 (0.9, 4.3) | |
|
| |||
| Recommended food score | 1.0 (0.9, 1.0) | 1.0 (0.9, 1.0) | |
|
| |||
| % Census level poverty | 1.0 (1.0, 1.0) | ||
|
| |||
| % Medicaid patients | 1.0 (1.0, 1.0) | ||
|
| |||
| Annual number of patients | 1.0 (1.0, 1.0) | ||
p<.05
p<.01
Note: Model I and II are reduced models and Model III is the full model.
Table 4.
Cox regression models predicting ovarian cancer-specific mortality
| HR (95% CI) | |||
|---|---|---|---|
| Model I | Model II | Model III | |
| Stage at diagnosis | |||
| Stage I (ref) | - | - | - |
| Stage II | 3.0 (1.3, 6.9)* | 2.8 (1.2, 6.6)* | 2.8 (1.2, 6.7)* |
| Stage III | 6.1 (3.2, 11.6)** | 6.2 (3.2, 12.1)** | 5.9 (3.0, 11.6)** |
| Stage IV | 5.5 (2.5, 12.3)** | 5.0 (2.2, 11.6)** | 4.7 (2.0, 10.9)** |
|
| |||
| Grade | |||
| Borderline (ref) | - | - | - |
| Grade 1 | 1.3 (0.4, 4.2) | 2.1 (0.6, 7.8) | 2.2 (0.6, 8.0) |
| Grade 2 | 4.0 (1.5, 10.6)** | 6.0 (2.0, 17.9)** | 6.5 (2.2, 19.7)** |
| Grade 3/4 | 4.2 (1.6, 11.2)** | 6.5 (2.2, 19.2)** | 6.8 (2.3, 20.0)** |
| Grade X | 5.7 (2.0, 15.6)** | 7.2 (2.3, 22.3)** | 7.9 (2.5, 24.5)** |
|
| |||
| Residual lesions >= 2 cm | 1.6 (1.0, 2.5)* | 1.7 (1.0, 2.6)* | 1.7 (1.1, 2.8.)* |
|
| |||
| Age at diagnosis | 1.0 (1.0, 1.0) | 1.0 (1.0, 1.0) | 1.0 (1.0, 1.0) |
|
| |||
| Black women | 1.7 (1.1, 2.7)* | 2.1 (1.3, 3.4)** | 2.2 (1.1, 4.1)* |
|
| |||
| Years of education | 1.0 (1.0, 1.1) | 1.0 (1.0, 1.1) | 1.0 (1.0, 1.1) |
|
| |||
| Currently married | 1.1 (0.8, 1.5) | 1.2 (0.8, 1.8) | 1.3 (0.9, 1.9) |
|
| |||
| Familial cancer | 0.9 (0.6, 1.2) | 0.9 (0.6, 1.2) | |
|
| |||
| Age at menarche | 0.9 (0.8, 1.0)* | 0.9 (0.8, 1.0) | |
|
| |||
| LOP | |||
| Low (ref) | - | - | |
| Medium | 0.9 (0.6, 1.4) | 1.0 (0.6, 1.5) | |
| High | 0.7 (0.4, 1.2) | 0.8 (0.5, 1.4) | |
|
| |||
| Parity | |||
| Nulliparous (ref) | - | - | |
| 1 child | 2.0 (1.1, 3.6)* | 1.7 (0.9, 3.1) | |
| 2 children | 0.8 (0.5, 1.5) | 0.7 (0.4, 1.3) | |
| 3 or more children | 0.7 (0.4, 1.3) | 0.6 (0.3, 1.2) | |
|
| |||
| Smoking history | 1.0 (0.7, 1.4) | 1.1 (0.7, 1.5) | |
|
| |||
| Oral contraceptive use | 1.1 (0.7, 1.8) | 1.0 (0.7, 1.7) | |
|
| |||
| Hormone use, >=5yrs | 0.6 (0.3, 1.0) | 0.4 (0.2, 0.9)* | |
|
| |||
| Genital powder use | 0.8 (0.5, 1.4) | 0.8 (0.5, 1.5) | |
|
| |||
| Tubal ligation | 1.0 (0.6, 1.7) | 1.0 (0.6, 1.7) | |
|
| |||
| Hysterectomy | 1.1 (0.5, 2.3) | 1.1 (0.5, 2.4) | |
|
| |||
| Recommended food score | 1.0 (0.9, 1.0) | 1.0 (0.9, 1.0) | |
|
| |||
| % Census level poverty | 1.0 (1.0, 1.0) | ||
|
| |||
| % Medicaid patients | 1.0 (1.0, 1.0) | ||
|
| |||
| Number of patients served | 1.0 (1.0, 1.0) | ||
p<.05
p<.01
Note: Model I and II are reduced models and Model III is the full model.
Secondary analyses were performed to explore the pattern of racial differences by stage at diagnosis. The Cox regressions among early stage cases (Stages I and II) and late stage cases (Stages III and IV) were compared.
Results
Sample characteristics
Tables 1 and 2 summarize the comparisons of the cancer characteristics and outcomes between black and white women. Overall, 84% were white women, and the mean age at diagnosis was 52 years old. Women in later stages were significantly older. More than half of women were diagnosed at later Stages (III or IV), and nearly 37% of the cases were poorly differentiated or undifferentiated (Grades 3 and 4). More than 36% had 2 cm or greater residual legions. None of these tumor characteristics differed by race.
Overall, 51% died (n=179) by the end of 2005. Of those, 90% were ovarian cancer deaths. There were no significant racial differences in the stage distribution in the number cases and deaths. Years of follow up ranged from 0.5 to 11.6 years. The proportion of deaths was significantly higher for later stages for both race groups.
White women were more likely than black women to be currently married and have completed more years of education. Black women were more likely than white women to reside in high poverty neighborhoods. Overall, 24% of women were nulliparous and 38% had three or more children. Women with a family history of cancer accounted for 56.7% of the sample. Mean age at menarche was 12.6 years old. The age-adjusted length of ovulatory period did not differ by race group.
Nearly 55% of white women and 44% of black women had used oral contraceptives. Also, 8.5% of white women and 5.5% of black women had been on hormone therapy more than five years. Black women were more likely (22%) than white women (11%) to have tubal ligation. Over 91% of white women and 87% of black women had a history of hysterectomy. Smoking history did not differ by race. On the other hand, black women were significantly more likely (30%) than white women (11%) to have used genital powder. The average recommended food score did not differ by race.
While the size of the hospital where women were diagnosed did not differ by race, the proportion of Medicaid patients served was significantly different: On average, in hospitals where black women were diagnosed, 25% of patients were on Medicaid, while 15% of patients were on Medicaid in hospitals from which white women were diagnosed.
Stage at diagnosis
The ordinal logistic regression models (Table 3) showed the probabilities of being diagnosed at each stage (Stages I to IV). Race did not predict the stage at diagnosis. Age was positively associated with the stage, older women being more likely to be diagnosed at a later stage. All other variables showed no statistically significant associations with the stage at diagnosis.
Length of survival
Table 4 describes three models examining the length of survival. Across the three models, stage at diagnosis, tumor grade, and the size of the residual lesions were consistently associated with mortality. In addition, the cumulative survival probability was significantly lower for black women than for white women, after controlling for all other variables. Figure 1 depicts the cumulative survival probability by race, controlling for confounding factors.
Figure 1.
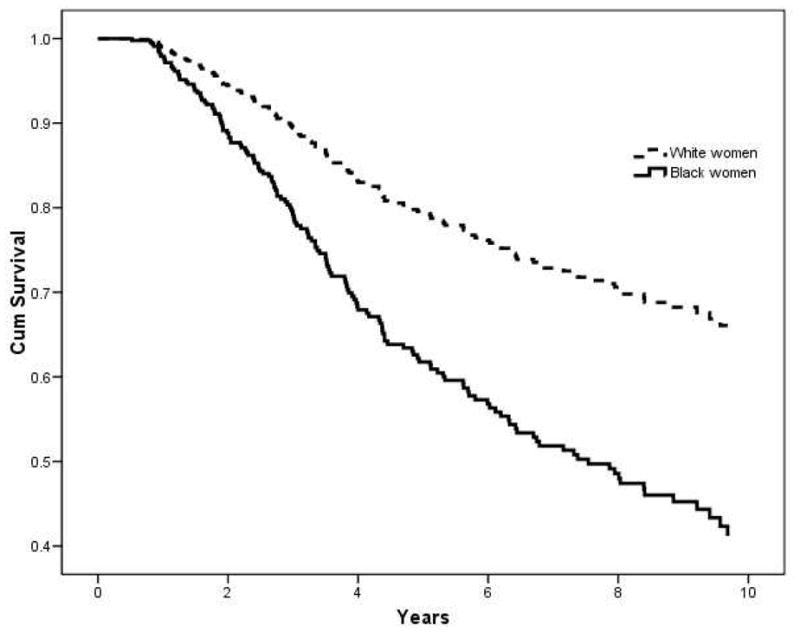
Cox regression cumulative survival curve for ovarian cancer by race
* Controlled for stage, grade, residual lesion, age at diagnosis, years of education, marital status, familial cancer, age at menarche, length of ovulation period, parity, smoking, oral contraceptive use, hormone use, vaginal powder use, tubal ligation, hysterectomy, recommended food score, % census level poverty, % of Medicaid patients, and number of patients served.
Stage specific survival curves by race group are presented in Figures 2 and 3. The Cox regression model for the early stage cases (Stages I and II) showed that the cumulative survival probability was significantly lower for black women compared to white women (p=.020), controlling for all other variables. Although the survival curves for the late stage cases (Stages III and IV) in figure 3 also showed the trend suggesting poorer survival for black women than white women, but the pattern was not statistically significant (p=.058).
Figures 2 & 3.

Within stage Cox regression cumulative survival curve for ovarian cancer by race
* Controlled for grade, residual lesion, age at diagnosis, years of education, marital status, familial cancer, age at menarche, length of ovulation period, parity, smoking, oral contraceptive use, hormone use, vaginal powder use, tubal ligation, hysterectomy, recommended food score, % census level poverty, % of Medicaid patients, and number of patients served.
Discussion
The study findings demonstrated that the stage at diagnosis of ovarian cancer did not differ by race, but the length of survival was significantly longer for white women than black women. This difference in the survival outcome was observed particularly among the early stage cases. Standard surveillance reports may overlook existing health disparities. The ovarian cancer incidence and mortality rates are higher for white women compared to black women. However, in spite of compatible profiles in the most powerful predictors, such as stage and age at diagnosis, tumor grade, that are known to influence survival after an ovarian cancer diagnosis, the black women in our sample demonstrated less favorable survival outcomes than their white counterparts. Even with a variety of etiologic factors added in statistical models, the race effect on survival persisted. Further research is required to identify mechanisms as to how these racial differences may occur.
Although the racial difference in the length of survival were observed in both early and late stage cases, the difference was more profound among the cases diagnosed at early stages, compared to the late stage cases (Figures 2 and 3). Although the confidence limits are wide, the racial differences by stage are unlikely due to small sample size. These estimates are controlled for a variety of confounding and prognostic factors, but there may be other unmeasured factors at play. This is an observational study, and those unmeasured factors may not be random. If replicable, this finding may imply a real disparity in the disease process itself and the management of disease between black and white women when diagnosed at the earlier stages. One of the reasons that the probability of ovarian cancer death among the late stage cases did not differ by race may be due to the fact that existing treatments are minimally effective for advanced ovarian cancer, regardless of factors associated race or SES.
Racial differences in multiple factors, such as access to and quality of care, neighborhood environments, and adherence to treatment, may affect cancer outcomes. These broader contextual factors need to be taken into consideration in designing interventions to minimize the disparity observed here (Howe et al., 2003; Webster et al., 2008). Previous studies speculate that differential treatment recommendations may be a potential reason for higher mortality rates among ethnic minorities (Chan et al., 2008; Howe et al., 2003). As Bilimoria and colleagues (2009) concluded, the post-operative mortality of cancer patients was improved with specialty surgeons compared to general surgeons across the cancer types. Thus racial/ethnic differences in access to specialty surgeons may be a cause of disparities in cancer survival. The lack of insurance may also interfere with obtaining optimal treatment.
Similarly, other differences between white and black women, such as diet, physical activities, other behavioral factors, and health care utilization, may further influence ovarian cancer outcomes, as observed in other diseases (Hu, Manson, & Stampfer, 2001; Ruder, Dorgan, Kranz, Kris-Etherton, & Hartman, 2008 ; Stampfer, Hu, Manson, Rimm, & Willett, 2000). Health behaviors and lifestyle factors, however, are in large part shaped by one’s level of social and economic resources (Link et al., 1998; Link & Phelan, 1995, 2002; Phelan, Link, Diez-Roux, Kawachi, & Levin, 2004). Thus, pathways through which social factors affect more proximal risks such as behaviors and environmental conditions need to be further examined.
Finally, patterns of disease outcomes need to be thoughtfully monitored as the social and medical environments change. Currently, more advanced methods of ovarian cancer screening are under evaluation, such as trans-vaginal ultrasound and serum CA125 test (Bast et al., 2007; Chu et al., 2007; Jacobs & Menon, 2004). With these new technologies, a key issue that we may face in the near future is how to ensure all race groups benefit from new tools.
Limitations and strengths
Although the results suggest racial differences in ovarian cancer survival, caution should be made when interpreting our study findings for several reasons. First, the study sample is healthier than the general population of epithelial ovarian cancer cases because these women were well enough to participate in a case-control study, thus limiting the generalizability of the study findings. This difference in the sample characteristics would undoubtedly influence the survival outcomes. In addition, the issue of small sample size of black women in the study cannot be ignored.
Second, the lack of lifestyle and clinical data after diagnosis is another limitation. For example, we know that all cases in the study sample received a surgery as an initial treatment; however, information on care providers and quality that may affect survival outcomes was unavailable.
Third, the survival follow-up by NDI search may have introduced potential misclassification bias. The NDI database includes all death records in the US. And there is a small possibility that some women may have moved out of the country and died, which may not have been detected by the NDI search.
To counterbalance these limitations, there are also several strengths of the study. First, unlike national level cancer registry data, the study dataset contained precise histo-pathology classification for cases because the initial study recruitment required a second review by a study gynecologic pathologist. Second, the study followed the sample over a ten-year period, which enhanced statistical power. Third, the nature of the original case-control study goals and objectives allowed inclusion of a vast number of potential variables that might be relevant to both ovarian cancer etiology and survival.
Conclusion
This study found no racial differences in stage at diagnosis, and yet, significant racial differences in survival, controlling for a wide range of confounding factors. Significant efforts to reduce racial disparities in cancers with effective screening approaches have been made over the past years (CDC, 2008b). Racial disparities in cancer outcomes are often examined for cancer types for which screening methods are available (Pinkowish, 2009). However, little attention has been given to racial differences in cancers without screening options or when the stage at diagnosis may not differ by race. We provide an example where the fundamental cause approach offers a framework to better pinpoint underlying disparities. Often, ovarian cancer is not part of the health inequities discussion. However, when descriptive data were carefully examined we observed that racial differences occurred even when stage at diagnosis did not differ by race. It would be useful to better understand the social factors behind these differences so that interventions can begin to ameliorate them.
Acknowledgments
The study was based on data provided by women diagnosed with ovarian cancer who participated in a case-control study funded by the National Cancer Institute entitled “Epidemiology of epithelial ovarian cancer” (R01 CA61093-01). Seijeoung Kim is funded by the National K99/R00 #R00-DA024012-03
Footnotes
Publisher's Disclaimer: This is a PDF file of an unedited manuscript that has been accepted for publication. As a service to our customers we are providing this early version of the manuscript. The manuscript will undergo copyediting, typesetting, and review of the resulting proof before it is published in its final citable form. Please note that during the production process errors may be discovered which could affect the content, and all legal disclaimers that apply to the journal pertain.
Contributor Information
Seijeoung Kim, Email: skim49@uic.edu, University of Illinois at Chicago Chicago, IL UNITED STATES.
Therese A Dolecek, University of Illinois at Chicago, School of Public Health, Division of Epidemiology and Biostatistics.
Faith G Davis, University of Illinois at Chicago, School of Public Health, Division of Epidemiology and Biostatistics.
References
- Adami H, Hsieh C, Lambe M, Trichopoulos D, Leon D, Persson I, et al. Parity, age at first childbirth, and risk of ovarian cancer. Lancet. 1994;344(8932):1250–1254. doi: 10.1016/s0140-6736(94)90749-8. [DOI] [PubMed] [Google Scholar]
- Agarwal R, Kaye S. Prognostic factors in ovarian cancer: how close are we to a complete picture? Annals of Oncology. 2005;16(1):4–6. doi: 10.1093/annonc/mdi104. [DOI] [PubMed] [Google Scholar]
- Albain K, Unger J, Crowley J, Coltman C, Hershman D. Racial disparities in cancer survival among randomized clinical trials patients of the Southwest Oncology Group. Journal of the National Cancer Institute. 2009;101(14):984–992. doi: 10.1093/jnci/djp175. [DOI] [PMC free article] [PubMed] [Google Scholar]
- Allareddy V, Allareddy V, Konety B. Specificity of procedure volume and inhospital mortality association. Ann Surg. 2007;246(1):135–139. doi: 10.1097/01.sla.0000259823.54786.83. [DOI] [PMC free article] [PubMed] [Google Scholar]
- American Cancer Society. Cancer facts & figures. Atranta, GA: American cancer society; 2004. [Google Scholar]
- Bast R, Brewer M, Zou C, Hernandez M, Daley M, Ozols R, et al. Prevention and early detection of ovarian cancer: mission impossible? Recent Results Cancer Res. 2007;174:91–100. doi: 10.1007/978-3-540-37696-5_9. [DOI] [PubMed] [Google Scholar]
- Beral V Million Women Study Collaborators. Ovarian cancer and hormone replacement therapy in the Million Women Study. Lancet. 2007;369:1703–1710. doi: 10.1016/S0140-6736(07)60534-0. [DOI] [PubMed] [Google Scholar]
- Berkman L. Social epidemiology: Social determinants of health in the United States: Are we losing ground? Annual Review of Public Health. 2009;30:27–41. doi: 10.1146/annurev.publhealth.031308.100310. [DOI] [PubMed] [Google Scholar]
- Bilimoria K, Phillips J, Rock C, Hayman A, Prystowsky J, Bentrem D. Effect of surgeon training, specialization, and experience on outcomes for cancer surgery: A systematic review of the literature. Annals of Surgical Oncology. 2009;16(7):1799–1808. doi: 10.1245/s10434-009-0467-8. [DOI] [PubMed] [Google Scholar]
- Block G, Hartman A, Dresser C, Carroll M, Gannon J. A data based approach to diet questionnaire design and teaching. Am J Epid. 1986;124:453–469. doi: 10.1093/oxfordjournals.aje.a114416. [DOI] [PubMed] [Google Scholar]
- Brescia R, Dubin N. Demopoulos RI, Endometrioid and clear cell carcinoma of the ovary: Factors affecting survival. International Journal of Gynecological Pathology. 1989;8:132–138. doi: 10.1097/00004347-198906000-00006. [DOI] [PubMed] [Google Scholar]
- Buys S, Partridge E, Greene E, Prorok P, Reding D, Riley T, et al. Ovarian cancer screening in the Prostate, Lung, Colorectal and Ovarian (PLCO) cancer screening trial: Findings from the initial screen of a randomized trial. American Journal of Obstetrics and Gynecology. 2005;193(5):1630–1639. doi: 10.1016/j.ajog.2005.05.005. [DOI] [PubMed] [Google Scholar]
- Calonge N US Preventive Services Task Force. Screening for ovarian cancer: Recommendation statement. Annals of Family Medicine. 2004;2:260–262. doi: 10.1370/afm.200. [DOI] [PMC free article] [PubMed] [Google Scholar]
- Center to Reduce Cancer Health Disparities. Health disparities defined. 2009 from http://crchd.cancer.gov/disparities/defined.html.
- Centers for Disease Control and Prevention (CDC) National vital statistics report. Journal. 2008a;56(16):1–52. Retrieved from http://www.cdc.gov/nchs/data/nvsr/nvsr56/nvsr56_16.pdf.
- Centers for Disease Control and Prevention (CDC) The National Breast and Cervical Cancer Early Detection Program: 1991–2002 National Report. 2008b. [Google Scholar]
- Chan K, Zhang M, Hu M, Shin Y, Osann K, Kapp S. Racial disparities in surgical treatment and survival of epithelial ovarian cancer in the United States. J Surg Oncol. 2008;97(2):103–107. doi: 10.1002/jso.20932. [DOI] [PubMed] [Google Scholar]
- Chen E, Martin A, Matthews K. Understanding health disparities: The role of race and socioeconomic status in children’s health. American Journal of Public Health. 2006;96(4):702–708. doi: 10.2105/AJPH.2004.048124. [DOI] [PMC free article] [PubMed] [Google Scholar]
- Chen V, Ruiz B, Killeen J, Cote T, Wu X, Correa C. Pathology and classification of ovarian tumors. Cancer. 2003;97(suppl 10):2631–2642. doi: 10.1002/cncr.11345. [DOI] [PubMed] [Google Scholar]
- Chu K, Miller B, Springfield S. Measures of racial/ethnic health disparities in cancer mortality rates and the influence of socioeconomic status. J Natl Med Assoc. 2007;99(10):1092–1104. [PMC free article] [PubMed] [Google Scholar]
- Cummings J, Jackson P. Race, gender, and SES disparities in self-assessed health, 1974–2004. Research on Aging. 2008;30(2):137–167. [Google Scholar]
- Danforth K, Tworoger S, Hecht J, Rosner B, Colditz G, Hankinson S. A prospective study of postmenopausal hormone use and ovarian cancer risk. Br J Cancer. 2007;96(1):151–156. doi: 10.1038/sj.bjc.6603527. [DOI] [PMC free article] [PubMed] [Google Scholar]
- Dolecek T, Davis F, Campbell R, Joslin C. Diet and survival from ovarian cancer among women in Cook County, Illinois. Am J Epidemiol. 2008;167(Suppl):S10. [Google Scholar]
- Dolecek T, McCarthy B, Joslin C, Peterson C, Kim S, Freels S, et al. Pre-diagnosis food patterns are associated with length of survival from epithelial ovarian cancer. Journal of the American Dietetic Association. 2009 doi: 10.1016/j.jada.2009.11.014. (In Print) [DOI] [PubMed] [Google Scholar]
- Doll R, Hill B. Lung cancer and other causes of dealth in relation to smoking. British Medical Journal. 1956;2(5001):1071–1081. doi: 10.1136/bmj.2.5001.1071. [DOI] [PMC free article] [PubMed] [Google Scholar]
- Du X, Sun C, Milam M, Bodurka D, Fang S. Ethnic differences in socioeconomic status, diagnosis, treatment, and survival among older women with epithelial ovarian cancer. Int J Gynecol Cancer. 2008;18:660–669. doi: 10.1111/j.1525-1438.2007.01081.x. [DOI] [PubMed] [Google Scholar]
- Elo I, Drevenstedt G. Cause-specific contributions to black-white differences in male mortality from 1960 to 1995. Journal. 2004 Retrieved from http://www.demographic-research.org/special/2/10/S2-10.pdf.
- Galea S, Ahern J, Nandi A, Tracy M, Beard J, Vlahov D. Urban neighborhood poverty and the incidence of depression in a population-based cohort study. Annals of Epidemiology. 2007;17(3):171–179. doi: 10.1016/j.annepidem.2006.07.008. [DOI] [PMC free article] [PubMed] [Google Scholar]
- Geronimus A, Bound J, Waidmann T. Poverty, time and place: Variation in excess mortality across selected US populations, 1980–1990. Journal of Epidemiological Community Health. 1999;53:325–334. doi: 10.1136/jech.53.6.325. [DOI] [PMC free article] [PubMed] [Google Scholar]
- Gertrg D, Hunter D, Cramer D, Colditz G, Speizer F, Willett W, et al. Prospective study of talc use and ovarian cancer. J Natl Cancer Inst. 2000;92:249–252. doi: 10.1093/jnci/92.3.249. [DOI] [PubMed] [Google Scholar]
- Green A, Purdie D, Bain C, Siskind V, Russell P, Quinn M, et al. Tubal sterilisation, hysterectomy, and decreased risk of ovarian cancer. Int J Cancer. 1997;71(6):948–951. doi: 10.1002/(sici)1097-0215(19970611)71:6<948::aid-ijc6>3.0.co;2-y. [DOI] [PubMed] [Google Scholar]
- Hand R, Sener S, Imperato J, Chmiel J, Sylvester J, Fremgen A. Hospital variables associated with quality of care for breast cancer patients. JAMA. 1991;266(24):3429–3432. [PubMed] [Google Scholar]
- Hankinson S, Hunter D, Colditz G, Willett W, Stampfer M, Rosner B, et al. Tubal ligation, hysterectomy, and risk of ovarian cancer. A prospective study. JAMA. 1993;270(23):2813–2818. [PubMed] [Google Scholar]
- Hershman D, Unger J, Barlow W, Hutchins L, Martino S, Osborne C, et al. Treatment quality and outcomes of African American versus white breast cancer patients: Retrospective analysis of Southwest Oncology Studies. Journal of Clinical Oncology. 2009;27(13):2157–2162. doi: 10.1200/JCO.2008.19.1163. [DOI] [PMC free article] [PubMed] [Google Scholar]
- Horner M, Ries L, Krapcho M, Neyman N, Aminou R, Howlader N, et al. SEER Cancer Statistics Review, 1975–2006. Bethesda, MD: National Cancer Institute; 2009. [Google Scholar]
- House J, Williams D. Understanding and reducing socioeconomic and racial/ethnic disparities in health. In: Smedley B, Syme S, editors. Promoting health: Intervention strategies from social and behavioral research. Washington DC: National Academy Press; 2000. pp. 81–124. [Google Scholar]
- Howe L, Tung H, Coughlin S, Jean-Baptiste R, Hotes J. Race/ethnic variations in ovarian cancer mortality in the United States, 1992–1997. Cancer. 2003;97:2686–2693. doi: 10.1002/cncr.11350. [DOI] [PubMed] [Google Scholar]
- Hu F, Manson J, Stampfer M. Diet, lifestyle and the risk of type-2 diabetes mellitus in women. N Engl J Med. 2001;345:790–797. doi: 10.1056/NEJMoa010492. [DOI] [PubMed] [Google Scholar]
- Hummer R. Black-White differences in health and mortality. Sociological Quarterly. 1996;37(1):105–125. [Google Scholar]
- Huncharek M, Geschwind J, Kupelnick B. Perineal application of cosmetic talc and risk of invasive epithelial ovarian cancer: a meta-analysis of 11,933 subjects from sixteen observational studies. Anticancer Res. 2003;23:1955–1960. [PubMed] [Google Scholar]
- Jacobs I, Menon U. Progress and challenges in screening for early detection of ovarian cancer. Molecular & Cellular Proteomics. 2004;3(4):355–366. doi: 10.1074/mcp.R400006-MCP200. [DOI] [PubMed] [Google Scholar]
- Jemal A, Siegel R, Ward E, Murray T, Xu J, Thun M. Cancer Statistics, 2007. CA Cancer J Clin. 2007;57:43–66. doi: 10.3322/canjclin.57.1.43. [DOI] [PubMed] [Google Scholar]
- Kawachi I, Lochner K. Socioeconomic status. In: Colditz G, Hunter D, editors. Cancer prevention: The causes and prevention of cancer. Vol. 1. New York: Kluwer Academic Publishers; 2002. pp. 87–99. [Google Scholar]
- Kupelian V, Davis F, Freels S, McCarthy B, Hedeker D, Rosenblatt K. Survival among ovarian cancer patients: Effect of family history. Am J Epidemiol. 2006;163(Suppl):S94. [Google Scholar]
- Lacey J, Mink P, Lubin J, Sherman M, Troisi R, Hartge P, et al. Menopausal hormone replacement therapy and risk of ovarian cancer. JAMA. 2002;288(3):334–341. doi: 10.1001/jama.288.3.334. [DOI] [PubMed] [Google Scholar]
- Link B, Northridge M, Phelan J, Ganz M. Social epidemiology and the fundamental cause concept: On the structuring of effective cancer screens by socioeconomic status. The Milbank Quarterly. 1998;76(3):375. doi: 10.1111/1468-0009.00096. [DOI] [PMC free article] [PubMed] [Google Scholar]
- Link B, Phelan J. Social conditions as fundamental causes of disease. Journal of Health and Social Behavior. 1995;1995:80. [PubMed] [Google Scholar]
- Link B, Phelan J. McKeown and the idea that social conditions are fundamental causes of disease. Am J Public Health. 2002;92(5):730–732. doi: 10.2105/ajph.92.5.730. [DOI] [PMC free article] [PubMed] [Google Scholar]
- Link B, Phelan J. Fundamental Sources of Health Inequalities. In: Mechanic D, Rogut L, Colby D, Knickman J, editors. Policy challenges in modern health care. New Brunswick, NJ: Rutgers University Press; 2005. [Google Scholar]
- Mai V, Kant A, Flood A, Lacey J, Schairer C, Schatzkin A. Diet quality and subsequent cancer incidence and mortality in a prospective cohort of women. Int J Epidemiol. 2005;34:54–60. doi: 10.1093/ije/dyh388. [DOI] [PubMed] [Google Scholar]
- Margellos H, Silva A, Whitman S. Comparison of health status indicators in Chicago: Are black–white disparities worsening? American Journal of Public Health. 2004;94(1):116–121. doi: 10.2105/ajph.94.1.116. [DOI] [PMC free article] [PubMed] [Google Scholar]
- Massey D. Categorically unequal: The American social stratification system. New York, NY: The Russell Sage Foundation; 2007. [Google Scholar]
- McKeown T. The role of medicine: Dream, mirage or nemesis? London, England: Nuffield Provincial Hospitals Trust; 1976. [Google Scholar]
- McKeown T. Medical issues in historical demography. International Journal of Epidemiology. 2005;34:515–520. doi: 10.1093/ije/dyh195. [DOI] [PubMed] [Google Scholar]
- Modugno F, Ness R, Allen G, Schildkraut J, Davis F, Goodman M. Oral contraceptive use, reproductive history, and risk of epithelial ovarian cancer in women with and without endometriosis. Am J Obstet Gynecol. 2004;191:733–740. doi: 10.1016/j.ajog.2004.03.035. [DOI] [PubMed] [Google Scholar]
- Nagle C, Purdue D, Webb P, Green A, Harvey P, Bain C. Dietary influences on survival after ovarian cancer. Int J Cancer. 2003;106:264–269. doi: 10.1002/ijc.11204. [DOI] [PubMed] [Google Scholar]
- Parkin D, Bray F, Ferlay J, Pisani P. Global cancer statistics, 2002. CA Cancer J Clin. 2005;55(2):74–108. doi: 10.3322/canjclin.55.2.74. [DOI] [PubMed] [Google Scholar]
- Pecorelli S, Benedet J, Creasman W, Shepherd J. FIGO staging of gynecologic cancer. 1994–1997 FIGO Committee on Gynecologic Oncology. International Federation of Gynecology and Obstetrics. Int J Gynaecol Obstet. 1999;65(3):243–249. doi: 10.1016/s0020-7292(99)00070-3. [DOI] [PubMed] [Google Scholar]
- Phelan JC, Link BG, Diez-Roux A, Kawachi I, Levin B. “Fundamental Causes” of Social Inequalities in Mortality: A Test of the Theory. Journal of health and social behavior. 2004;45(3):265–285. doi: 10.1177/002214650404500303. [DOI] [PubMed] [Google Scholar]
- Pinkowish M. Black-White mortality disparities increasing for some cancers. CA: A Cancer Journal for Clinicians. 2009;59(2):69–70. doi: 10.3322/caac.20015. [DOI] [PubMed] [Google Scholar]
- Prentice R, Thomson C, Caan B, Hubbell F, Anderson G, Beresford S, et al. Low-fat dietary pattern and cancer incidence in the Women’s Health Initiative dietary modification randomized controlled trial. Journal of the National Cancer Institute. 2007;99(20):1534–1543. doi: 10.1093/jnci/djm159. [DOI] [PMC free article] [PubMed] [Google Scholar]
- Robbins C, Whiteman M, Hillis S, Curtis K, McDonald J, Wingo P, et al. Influence of reproductive factors on mortality after epithelial ovarian cancer diagnosis. Cancer Epidemiology Biomarkers & Prevention. 2009;18(7):2035–2041. doi: 10.1158/1055-9965.EPI-09-0156. [DOI] [PubMed] [Google Scholar]
- Ruder E, Dorgan J, Kranz S, Kris-Etherton P, Hartman T. Examining breast cancer growth and lifestyle risk factors: early life, childhood, and adolescence. Clin Breast Cancer. 2008;8(4):334–342. doi: 10.3816/CBC.2008.n.038. [DOI] [PMC free article] [PubMed] [Google Scholar]
- Schneiderman M, Levin D. Trends in lung cancer, mortality, incidence, diagnosis, treatment, smoking, and urbanization. Cancer. 1972;30(5):1320–1325. doi: 10.1002/1097-0142(197211)30:5<1320::aid-cncr2820300526>3.0.co;2-3. [DOI] [PubMed] [Google Scholar]
- Shahian D, Normand S. The volume-outcome relationship: from Luft to Leapfrog. Ann Thorac Surg. 2003;75(3):1048–1058. doi: 10.1016/s0003-4975(02)04308-4. [DOI] [PubMed] [Google Scholar]
- Shaw M, Tunstall H, Smith G. Seeing social position: Visualizing class in life and death. International Journal of Epidemiology. 2003;32:332–335. doi: 10.1093/ije/dyg176. [DOI] [PubMed] [Google Scholar]
- Stampfer M, Hu F, Manson J, Rimm E, Willett W. Primary prevention of coronary heart disease in women through diet and lifestyle. N Engl J Med. 2000;343:16–22. doi: 10.1056/NEJM200007063430103. [DOI] [PubMed] [Google Scholar]
- Steyerberg E, Earle C, Neville B, Weeks J. Racial differences in surgical evaluation, treatment, and outcome of locoregional esophageal cancer: a population-based analysis of elderly patients. J Clin Oncol. 2005;23:510–517. doi: 10.1200/JCO.2005.05.169. [DOI] [PubMed] [Google Scholar]
- Storey D, Rush R, Stewart M, Rye T, Al-Nafussi A, Williams A, et al. Endometrioid epithelial ovarian cancer: 20 years of prospectively collected data from a single center. Cancer. 2008;112(10):2211–2220. doi: 10.1002/cncr.23438. [DOI] [PubMed] [Google Scholar]
- Sudano J, Baker D. Explaining US racial/ethnic disparities in health declines and mortality in late middle age: the roles of socioeconomic status, health behaviors, and health insurance. Soc Sci Med. 2006;62(4):909–922. doi: 10.1016/j.socscimed.2005.06.041. [DOI] [PubMed] [Google Scholar]
- Trivedi A, Sequist T, Ayanian J. Impact of hospital volume on racial disparities in cardiovascular procedure mortality. J Am Coll Cardiol. 2006;47(2):417–424. doi: 10.1016/j.jacc.2005.08.068. [DOI] [PubMed] [Google Scholar]
- US Cancer Statistics Working Group. United States Cancer Statistics: 2004 Incidence and Mortality. Atlanta: US Department of Health and Human Services, Centers for Disease Control and Prevention, and National Cancer Institute; 2007. [Google Scholar]
- Webster T, Hoffman K, Weinberg J, Vieira VAA. Community and individual level socioeconomic status and breast cancer risk: Multilevel modeling on Cape Cod, Massachusetts. Environ Health Perspect. 2008;116:1125–1129. doi: 10.1289/ehp.10818. [DOI] [PMC free article] [PubMed] [Google Scholar]
- Whittemore A, Harris R, Itnyre J. Characteristics relating to ovarian cancer risk: collaborative analysis of 12 US case-control studies II: Invasive epithelial ovarian cancers in white women. American Journal of Epidemiology. 1992;136:1184–1203. doi: 10.1093/oxfordjournals.aje.a116427. [DOI] [PubMed] [Google Scholar]
- Williams D, Collins C. Racial residential segregation: a fundamental cause of racial disparities in health. Public Health Report. 2001;116(5):404–416. doi: 10.1093/phr/116.5.404. [DOI] [PMC free article] [PubMed] [Google Scholar]
- Williams D, Jackson P. Social sources Of racial disparities in health. Health Affairs. 2005;24(2):325–334. doi: 10.1377/hlthaff.24.2.325. [DOI] [PubMed] [Google Scholar]
- Winkleby M, Cubbin C, Ahn D, Kraemer H. Pathways by which SES and ethnicity influence cardiovascular disease risk factors. Annals New York Academy of Sciences. 2006;896:191–209. doi: 10.1111/j.1749-6632.1999.tb08116.x. [DOI] [PubMed] [Google Scholar]
- Winter W, Maxwell G, Tian C, Carlson J, Ozols R, Rose P, et al. Prognostic factors for stage III epithelial ovarian cancer: A gynecologic oncology group study. Journal of Clinical Oncology. 2007;25(24):3621–3627. doi: 10.1200/JCO.2006.10.2517. [DOI] [PubMed] [Google Scholar]
- Wong M, Singh K. The combined oral contraceptive pill in women over age forty. Annals of the Academy of Medicine, Singapore. 2003;32:624–631. [PubMed] [Google Scholar]
- Yancik R. Ovarian cancer: Age contrasts in incidence, histology, disease stage at diagnosis, and mortality. Cancer. 1993;71:517–523. doi: 10.1002/cncr.2820710205. [DOI] [PubMed] [Google Scholar]