

Abstract
The importance of sleep to health and cardiovascular disease has become increasingly apparent. Sleep disordered breathing (SDB), sleep duration, and sleep architecture may all influence metabolism and neurohormonal systems, yet no prior study has evaluated these sleep characteristics concurrently in relation to incident hypertension. Our objective was to determine if incident hypertension is associated with polysomnography (PSG) measures of SDB, sleep duration, and sleep architecture in older men. Participants were784 community dwelling, ambulatory men ≥65 years (mean age 75.1±4.9 years) from the Outcomes of Sleep Disorders in Older Men Study (MrOs Sleep Study) who did not have hypertension at the time of their in-home PSG sleep studies (2003-2005); and who returned for follow-up (2007-2009). Of 784 older men included in this report, 243 met criteria for incident hypertension after a mean follow-up of 3.4 years. In unadjusted analyses, incident hypertension was associated with increased hypoxemia, increased sleep stages N1 and N2 and decreased stage N3 (slow wave sleep, SWS). After adjustment for age, non-white race, study site, and body mass index, the only sleep index to remain significantly associated with incident HTN was SWS percent (odds ratio for lowest to highest quartile of SWS: 1.83, 95% CI 1.18, 2.85). No attenuation of this association was seen after accounting for sleep duration, sleep fragmentation and indices of SDB. Percentage time in SWS was inversely associated with incident HTN, independent of sleep duration and fragmentation, and SDB. Selective deprivation of SWS may contribute to adverse blood pressure in older men.
Keywords: hypertension, slow wave sleep, respiratory disturbance index, elderly, polysomnography
Introduction
The importance of sleep to health, including hypertension (HTN) and cardiovascular disease, continues to be elucidated. HTN is present in over 30% of the US adult population, with a much higher risk in the elderly: over 65% of Americans over the age of 60 have been diagnosed with HTN1. Sleep disturbances and disorders are also exceedingly common in older adults. Sleep disorders such as sleep disordered breathing (SDB), sleep duration, and sleep architecture may affect neurohormonal axes, including the sympathetic nervous system, which contribute to elevated blood pressure and HTN. To our knowledge, a comprehensive evaluation of sleep characteristics and incident HTN in an elderly cohort has not been reported.
SDB, which includes obstructive sleep apnea (OSA), is strongly associated with HTN2. In a study of veterans, 60% of OSA patients had HTN,3 which is often refractory to treatment4. Conversely, OSA may be present in at least 30% of adults with HTN5. Previous studies have suggested that SDB, as determined by the respiratory disturbance index (RDI; number of respiratory events per hour of sleep), precedes incident HTN6, although these associations may be partly attributable to obesity7.
Epidemiologic studies of self-reported sleep have also found that sleep deprivation and/or short sleep duration is associated with both prevalent and incident HTN8, 9, and that such associations may be most pronounced among premenopausal women10. A case-control polysomnographic study showed that severity of HTN was associated with short sleep duration, lower sleep efficiency, and less rapid eye movement (REM) sleep11. Sleep disruption may also lead to increased blood pressure12.
Human sleep is divided into REM (rapid eye movement sleep) and NREM (non-REM). NREM is further divided into the stages of N1 (previously called stage 1), N2 (previously stage 2), N3 (previously stage 3 and 4; also called slow wave sleep or SWS)13. Both NREM and REM sleep are assessed by the brain wave activity (frequency and amplitude) recorded with polysomnography (PSG). SWS is considered to be “restorative” and is the sleep stage associated with the highest arousal threshold. The importance of SWS continues to be elucidated; it has been implicated in memory14 and overnight improvements in perceptual and visuomotor performance15 and learning16. SWS has also been associated with transient metabolic, hormonal, and physiologic changes, which affect glucose metabolism and is associated with decreased sympathetic nervous activity and increased vagal tone.17 These, in turn, are associated with decreased heart rate and blood pressure, which may influence nocturnal blood pressure profiles. The disappearance of a nocturnal “dipping” blood pressure pattern is known to increase the risk of HTN and cardiovascular disease18.
We recently reported from the Outcomes of Sleep Disorders in Older Men Study (MrOS Sleep Study) that decreased percent time in SWS assessed by PSG was related to increased odds of obesity19. Obesity and high blood pressure are very highly associated conditions with important public health consequences as major risk factors for both cardiovascular disease and death20. To our knowledge, assessment of the association between SWS or other markers of sleep architecture with HTN has not yet been reported in prospective epidemiological studies.
The aim of the present study was to determine the relative contributions of sleep characteristics, including SDB determined by RDI or hypoxemia, decreased sleep duration, or indices of sleep architecture (which include overall arousal index, time in each sleep stage, sleep efficiency, or sleep fragmentation) predict incident HTN among elderly community dwelling men.
Methods
Study subjects
Study subjects were participants in the Outcomes of Sleep Disorders in Older Men Study (MrOS Sleep Study) conducted in 2003-2005, an ancillary study of the parent MrOs study, a cohort of 5,994 community-dwelling men, aged ≥ 65 years, described previously21, 22. 3,135 participants in the MrOs Sleep Study had full in-home polysomnography (PSG). See online supplement at http://hyper.ahajournals.org for details of MrOs participants that were enrolled and excluded.
For the present study, 2,911 older men had PSG data, of whom 1,986 (68.2%) had a history of HTN, were taking anti-hypertensive medications, or had an elevated systolic blood pressure (SBP) ≥140 mmHg, or diastolic blood pressure (DBP) ≥90 mmHg at the initial sleep visit and were excluded from the current analyses; 49 participants had missing data for either history of HTN or SWS and were also excluded. Of the 876 remaining, 784 participants attended the follow-up visit (2007-2009) and had complete HTN data (BP measurements, response to questionnaires, and anti-hypertensive medication data) and are included in this report. In general, older men who regularly used mechanical sleep devices were excluded from the MrOS Sleep Study. However, our analysis sample included one man who reported intermittent use of a sleep device (but did not use the device on the night of the PSG measurement). The mean follow-up time was 3.4 (SD 0.45) years. All protocols were approved by the institutional review boards at the respective enrollment sites, and participants signed informed consent to participate in the MrOS Sleep Study.
Classification and measurement of hypertension (HTN)
As noted, HTN was defined as those who self-reported HTN (by affirmative answer to the question “Have you ever had hypertension?”), use of anti-hypertensive medications, or who had measured SBP≥140 mmHg, or DBP≥90 mmHg. Pre-hypertension was classified as a SBP 120-<140 mmHg or DBP 80-<90 mmHg23. Two seated resting blood pressure measurements were performed at the time of the initial sleep study using a conventional mercury sphygmomanometer on the right arm and an appropriate cuff size. Participants rested with their feet flat on the floor for at least 5 minutes prior to measurements, which were averaged. SBP was determined by phase I and diastolic as phase V Korotkoff values. At the follow-up visit, seated blood pressures were measured using the same protocol but a BP Tru automated blood pressure monitor (model BMP-300) was used, due to prohibition of mercury sphygmomanometers for safety reasons.
Other measures
Self-administered questionnaires to assess participant demographics, including race, life style factors such as physical activity, depression, and alcohol and smoking, and classification of medication use are described in the Online Supplement. Height (cm) was measured on regularly calibrated Harpenden stadiometers and weight (kg) on calibrated standard balance beam or digital scales. Body mass index (BMI) was calculated as kg/m2. Waist, hip, and neck circumferences were measured using a tape measure and standard techniques.24
Polysomnography (PSG)
In-home, single night sleep studies using unattended PSG (Safiro, Compumedics, Inc., Melbourne, Australia) were performed. See the Online Supplement for more details. Sleep stages (REM, stages 1-4 NREM, though now N1-N3) were scored using the standard criteria at the time of the studies25. SWS was defined as the total sleep time scored as stage 3 plus stage 4, now N3, and expressed as percentage of total sleep time. RDI, an indication of the severity of SDB, was defined as the number of apneas and hypopneas (based on the Sleep Heart Health Study criteria26) per hour of sleep, each associated with an oxygen desaturation of 4% or greater. Hypoxemia was determined by sleep time spent with oxygen desaturation to less than 80% (Pao2 (partial pressure of oxygen in arterial blood) <80%). Central apnea index (CAI) was defined as the number of apneas per hour of sleep with no displacement of either chest or abdominal inductance channels, regardless of oxygen desaturation. Total sleep duration at night and sleep efficiency, defined as the percentage of the sleep period (time in bed) spent asleep, were also obtained from PSG. Overall arousal index was determined as number of arousals per hour of sleep. Wake after sleep onset (WASO; the minutes awake after having been asleep) was used as a marker of sleep fragmentation.
Statistical analyses
Initial associations of sleep variables with incident hypertension were examined using ANOVA, Kruskal-Wallis, or chi square tests. Sleep variables considered included indices of SDB (by RDI and percent sleep time with oxygen saturation less than 80%), nighttime sleep duration, and sleep architecture (sleep stage distributions, WASO, sleep efficiency and overall arousal index). Descriptive and inferential statistics were performed using SAS version 9.2 (SAS Institute, Inc., Cary, NC). In order to account for multiple endpoints which are highly correlated, we utilized the Dubey and Armitage-Parmar procedure27.
Potential confounders were identified a priori. Summary statistics for variables believed to be related to the polysomnographic variables and/or incident HTN were performed. ANOVA, Kruskal-Wallis, or chi square tests were employed to examine associations with the sleep characteristics and incident HTN for normal, non-parametric, and categorized variables, respectively. Variables that were significant at p<.10 for both outcomes were included in a multi-variable model. A list of potential confounders and sleep variables considered are shown in Tables 1 and 2, respectively.
Table 1.
Demographic characteristics of the study cohort: overall and by follow-up hypertension (HTN) status.
| Characteristic | Overall | Incident HTN | No incident HTN | P value |
|---|---|---|---|---|
| Mean±SD | (N= 784) | (N= 243) | (N= 541) | |
| Age (years) | 75.1 ± 4.9 | 75.7 ± 5.0 | 74.9 ± 4.8 | 0.032 |
| BMI (kg/m2) | 26.4± 3.4 | 26.7 ± 3.7 | 26.3± 3.3 | 0.088 |
| Neck circumference (cm) | 39.0 ± 2.7 | 39.1 ± 2.8 | 38.9 ± 2.6 | 0.209 |
| Waist circumference (cm) | 97.3 ± 10.0 | 98.3 ± 10.3 | 96.9 ± 9.8 | 0.060 |
| Hip circumference (cm) | 101.9 ± 8.3 | 102.1 ± 8.0 | 101.8 ± 8.4 | 0.593 |
| PASE score | 160.8 ± 71.3 | 159.6 ± 72.3 | 161.4 ± 70.9 | 0.75 |
| Baseline SBP | 121.0 ± 10.6 | 125.4 ± 9.6 | 119.0 ± 10.4 | <0.0001 |
| Baseline DBP | 67.5 ± 7.7 | 68.7 ± 7.5 | 66.9 ± 7.8 | 0.003 |
| Follow-up SBP | 118.7 ± 16.3 | 125.0 ± 21.2 | 116.0 ± 12.7 | <0.0001 |
| Follow-up DBP | 68.1 ± 9.7 | 69.2 ± 11.6 | 67.6 ± 8.8 | 0.064 |
| Percentages N (%) | ||||
| Non-Caucasian race | 68 (8.7) | 20 (8.2) | 48 (8.9) | 0.768 |
| Self-rating of overall health “Excellent or Good” | 501 (92.8) | 222 (92.3) | 723 (92.2) | 0.19 |
| Current smoker | 22 (2.8) | 4 (1.6) | 18 (3.3) | 0.188 |
| Has ≥1 alcoholic drink/week* | 432 (55.4) | 127 (52.9) | 305 (56.5) | 0.355 |
| Diabetes mellitus | 45 (5.7) | 19 (7.8) | 26 (4.8) | 0.094 |
| History of cardiovascular disease | 154 (19.7) | 58 (24.1) | 96 (17.7) | 0.040 |
| GDS Score ≥6 | 34 (4.3) | 9(3.7) | 25(4.6) | 0.560 |
| Prehypertensive at baseline | 477 (60.8) | 190(78.2) | 287(53.1) | <0.0001 |
BMI: body mass index, PASE: physical activity score in the elderly, SBP: systolic blood pressure, DBP: diastolic blood pressure, GDS: geriatric depression scale. Prehypertension: SBP 120-139 mmHg or DBP 80-89mmHg. P value compares those with and without incident hypertension.
Further categorization of alcoholic drinks per week 0, <1, 1-2, 3-5, 6-13, or 14+ did not significantly change results
Table 2.
Sleep characteristics of study cohort: overall and by follow-up hypertension (HTN) status.
| Characteristic | Overall | Incident HTN | No incident HTN | P value |
|---|---|---|---|---|
| (N= 784) | (N= 243) | (N= 541) | ||
| Sleep disordered breathing (Mean ± standard deviation) | ||||
| Respiratory disturbance index (RDI) | 10.0 ± 12.0 | 10.8± 13.5 | 9.7± 11.3 | 0.256* |
| Hypoxemia (% sleep time Pao2 <80%) | 0.05 ± 0.3 | 0.09 ± 0.4 | 0.03 ± 0.2 | 0.025* |
| Central apnea index | 1.5 ± 4.5 | 1.7 ± 5.6 | 1.4 ± 4.0 | 0.835* |
| RDI≥15, N (%) | 164 (20.9) | 51 (21.0) | 113 (20.9) | 0.975 |
| RDI≥5, N (%) | 423 (54.0) | 133 (54.7) | 290 (53.6) | 0.770 |
| Sleep duration (Mean ± standard deviation) | ||||
| Total sleep duration (minutes) | 364.1 ± 66.4 | 365.5± 72.3 | 363.5 ± 63.7 | 0.715 |
| Sleep architecture (Mean ± standard deviation) | ||||
| Overall arousal index | 22.9 ± 11.3 | 23.1 ± 12.3 | 22.8 ± 10.8 | 0.724* |
| Sleep efficiency | 75.9 ± 11.7 | 74.9 ± 12.8 | 76.4 ± 11.2 | 0.116 |
| Wake after sleep onset (minutes) | 106.3 ± 63.0 | 112.2 ± 63.7 | 103.6 ± 62.6 | 0.079 |
| % time in stage 1 (N1) sleep | 6.5 ± 4.2 | 7.2 ± 5.3 | 6.2 ± 3.6 | 0.013* |
| % time in stage 2 (N2) sleep | 62.0 ± 9.2 | 63.1 ± 9.2 | 61.6 ± 9.2 | 0.033 |
| % time in slow wave (N3) sleep | 11.2 ± 8.5 | 9.8 ± 8.1 | 11.8 ± 8.5 | 0.002* |
| % time in REM | 20.2 ± 6.2 | 20.0 ± 6.4 | 20.3 ± 6.1 | 0.479 |
REM: rapid eye movement sleep.
denotes use of Kruskal-Wallis statistic due to non-normal distributions. Bold P values denote P<0.05.
To account for non-linear associations, sleep variables were categorized as quartiles. Parameters with a high number of zero values (central apnea index and hypoxemia (percent time with Pao2<80%)) were expressed as present or absent. Logistic regression was used to determine the odds of incident HTN for each quartile of sleep exposure compared to the highest quartile. Unadjusted models were run first, followed by models which accounted for age and non-Caucasian race, and then study site and BMI were added.
In adjusted analyses, incident HTN was only associated with SWS. Additional models were developed to better assess the influence of SWS after considering other sleep exposures. This included adjustment for RDI, percent time with oxygen saturation Pao2<80%, total sleep duration, sleep efficiency and the overall arousal index.
In a subgroup analysis (shown in the Online Supplement), we determined whether the association between SWS and incident HTN persisted after excluding men who were pre-hypertensive at baseline.
Results
Baseline characteristics and univariate analyses
The 784 men included in this report had a mean age of 75.1 (SD 4.9) years and mean BMI of 26.4 kg/m2 (SD 3.4); nearly 90% were Caucasian. Demographic characteristics are shown in Table 1. The mean baseline SBP was 121.0 mmHg (SD 10.6) and DBP was 67.5 (SD 7.7) mmHg. A majority of the participants (61%) were pre-hypertensive, classified as a SBP 120-<140 mmHg or DBP 80-<90 mmHg23; 19.7% reported a history of cardiovascular disease, and 5.7% reported a history of diabetes. Almost all (92.3%) rated their health as “excellent” or “good.”
At baseline participants had a mean RDI of 10.0 (SD 12.0; median of 5.7) but 54.0% of men had an RDI>5, indicating at least mild SDB, shown with other sleep characteristics in Table 2. On average, the total sleep duration was 364 minutes (SD 66.4) or 6.1 hours. Average percent time in REM was 20.2% (SD 6.2), stage 1 (N1) 6.5% (SD 4.2), stage 2 (N2) 62.0% (SD 9.2), and SWS (stages 3 and 4, N3) 11.2% (SD 8.5).
Incident hypertension was associated with sleep architecture
Over the 3.4 year follow-up interval, 243 men developed incident HTN; 59 (24.3%) were diagnosed by blood pressure criteria alone, 9 (3.7%) by self-report of HTN alone, 5 (2.1%) had both self-reported HTN and met blood pressure criteria, and 170 (70%) were taking at least one anti-hypertensive medication. Those with incident HTN were older (75.7 versus 74.9 years, P=0.03) and were more likely to report cardiovascular disease (24.1% versus 17.7%, P=0.04), shown in Table 1.
There was a nonsignificant trend toward higher mean RDI with incident HTN, shown in Table 2. Percent time in sleep stages 1 (N1), 2 (N2) and SWS (N3) were associated with incident HTN, shown in Table 2. Those with incident HTN had poorer sleep architecture as evidenced by significantly less SWS (mean 9.8% versus 11.2%, P=0.002) and correspondingly more stage 1 (N1) and stage 2 (N2) sleep (P=0.013, and P=0.033 respectively). After adjusting for age, race, BMI, and study site, only the association between SWS and incident HTN remained statistically significant (Online Supplemental Table S1).
SWS and incident hypertension
To further explore the associations between SWS and incident HTN, we first assessed the associations of covariates and other sleep variables with quartiles of time in SWS (Table 3). The lowest quartile of percentage sleep time in SWS (<4.1%) was associated with increasing age (P<0.001), BMI (P=0.015) and neck circumference (P=0.012), but not baseline SBP and DBP. In those in the lowest quartile of SWS, we observed a higher mean RDI (P<0.001), a higher mean overall arousal index (P<0.001), lower mean total sleep duration (P=0.009) and lower mean sleep efficiency (P<0.001). Those in the lowest quartile of percent sleep time in SWS were also more likely to have any SDB (RDI≥5) or moderate-severe SDB (RDI≥15; P=0.048 and P=0.0005 respectively). Central apnea index was not associated with quartile of SWS. Men taking either an angiotensin converting enzyme inhibitor (ACEI) or angiotensin II receptor blocker (ARB) at follow-up (9.6% total) were more likely to be in the lowest quartile of SWS (P=0.034).
Table 3.
Baseline demographic characteristics of cohort, overall and by percent time in slow wave sleep (SWS) quartiles (Q1-Q4).
| Characteristic | OVERALL | Q1: <4.1 | Q2: 4.1 TO 10.2 | Q3: 10.2 TO 16.9 | Q4: >16.9 | P VALUE |
|---|---|---|---|---|---|---|
| Mean± SD | (N= 784) | (N= 195) | (N= 197) | (N= 192) | (N= 200) | |
| Age (years) | 75.1 ± 4.9 | 76.5 ± 5.5 | 74.6± 4.9 | 74.6 ± 4.3 | 74.8 ± 4.5 | 0.0001 |
| BMI (kg/m2) | 26.4 ± 3.4 | 27.0± 3.7 | 26.3± 3.0 | 26.5 ± 3.6 | 25.9± 3.3 | 0.015 |
| Neck circumference (cm) | 39.0 ± 2.7 | 39.4 ± 2.6 | 38.9 ± 2.6 | 38.9 ± 2.7 | 38.5 ± 2.7 | 0.012 |
| Waist circumference (cm) | 97.3 ± 10.0 | 98.8 ± 10.3 | 97.1± 8.7 | 97.0 ± 10.4 | 96.4 ± 10.2 | 0.096 |
| Hip circumference (cm) | 101.9 ± 8.3 | 102.9 ± 7.9 | 101.6 ± 7.2 | 101.9 ± 10.2 | 101.1 ± 7.5 | 0.162 |
| Baseline SBP | 121.0 ± 10.6 | 121.8 ± 10.5 | 120.9 ± 10.1 | 120.9 ± 10.9 | 120.3 ± 10.9 | 0.569 |
| Baseline DBP | 67.5 ± 7.7 | 67.3 ± 7.8 | 67.7 ± 7.5 | 67.5 ± 7.8 | 67.5 ± 7.9 | 0.962 |
| Follow-up SBP | 118.7 ± 16.3 | 121.0 ± 16.5 | 118.2 ± 14.8 | 116.6 ± 16.6 | 118.9 ± 16.8 | 0.061 |
| Follow-up DBP | 68.1 ± 9.7 | 68.1 ± 9.8 | 68.6 ± 9.5 | 67.0 ± 9.5 | 68.4 ± 10.0 | 0.371 |
| PASE score | 160.8 ± 71.3 | 162.6 ± 71.9 | 152.5 ± 69.6 | 164.3± 71.6 | 163.9 ± 72.2 | 0.305 |
| Respiratory disturbance index (RDI) | 10.0 ± 12.0 | 13.3 ± 15.3 | 9.8 ± 10.9 | 9.4 ± 11.6 | 7.7 ± 8.8 | 0.006† |
| Overall arousal index | 22.9 ± 11.3 | 26.5 ± 13.5 | 22.7 ± 11.1 | 21.8 ± 9.5 | 20.6 ± 9.8 | <.0001† |
| Central apnea index | 1.5 ± 4.5 | 1.7 ± 6.1 | 1.5 ± 4.0 | 1.2 ± 2.9 | 1.4 ± 4.5 | 0.813† |
| Sleep efficiency | 75.9 ± 11.7 | 72.4 ± 12.5 | 76.1 ± 11.6 | 76.3 ± 11.9 | 78.7 ± 10.1 | <.0001 |
| Total sleep duration (minutes) | 364.2 ± 66.4 | 350.2 ± 77.0 | 370.0 ± 58.7 | 368.6 ± 66.8 | 367.7 ± 60.4 | 0.009 |
| Wake after sleep onset (minutes) | 106.3 ± 63.1 | 122.2 ± 64.0 | 109.5 ± 70.6 | 102.1 ± 57.5 | 91.6 ± 55.4 | <.0001 |
| Time in SWS (minutes) | 41.4 ± 31.8 | 6.0 + 5.0 | 25.7 +7.8 | 49.4 +11.2 | 83.7 +20.7 | <.0001 |
| Percentages (%) | ||||||
| Non-Caucasian race | 68 (8.7) | 22 (11.3) | 16 (8.1) | 22 (11.5) | 8 (4) | 0.027 |
| Current smoker | 22 (2.8) | 9 (4.6) | 4 (2.0) | 1 (0.5) | 8 (4) | 0.058 |
| Has ≥1 alcoholic drink/week* | 432 (55.4) | 104 (53.9) | 108 (55.4) | 105 (54.7) | 115 (57.5) | 0.902 |
| Use of sleep medication | 72 (9.2) | 19 (9.7) | 21 (10.7) | 18 (9.4) | 14 (7) | 0.628 |
| Diabetes mellitus | 45 (5.7) | 13 (6.7) | 9 (4.6) | 13 (6.8) | 10 (5.0) | 0.708 |
| History of cardiovascular disease | 154 (19.7) | 39 (20.1) | 40 (20.3) | 33 (17.3) | 42 (21.0) | 0.80 |
| Prehypertensive at baseline | 477 (60.8) | 127 (65.1) | 118 (59.9) | 112 (58.3) | 120 (60.0) | 0.543 |
| Self-rating of health: excellent or good | 723 (932.3) | 188(96.4) | 183 (92.9) | 168 (88.0) | 184 (92.0) | 0.0197 |
| GDS Score ≥6 | 34 (4.3) | 9 (4.6) | 6 (3.0) | 8 (4.17) | 11 (5.5) | 0.684 |
| RDI≥5 | 423 (54.0) | 119 (61.0) | 111 (56.3) | 94 (49.0) | 99 (49.5) | 0.048 |
| Sleep Time Pao2 <80% | 0.05 ± 0.3 | 0.1 ± 0.5 | 0.02 ± 0.15 | 0.04 ± 0.21 | 0.04 ± 0.24 | 0.013† |
| ACEI/ARB use at follow-up | 75 (9.6) | 29 (14.9) | 14 (7.1) | 15 (7.8) | 17 (8.5) | 0.034 |
| Diuretic use at follow-up | 48 (6.1) | 16 (8.2) | 9 (4.6) | 16 (8.3) | 7 (3.5) | 0.097 |
| Beta blocker use at follow-up | 79 (10.1) | 21 (10.8) | 17 (8.6) | 23 (12.0) | 18 (9) | 0.66 |
| Calcium channel blocker use at follow-up | 17 (2.2) | 5 (2.6) | 6 (3.1) | 2 (1.0) | 4 (2.0) | 0.57 |
BMI: body mass index, PASE: physical activity score in the elderly, REM: rapid eye movement sleep, SBP: systolic blood pressure, DBP: diastolic blood pressure. RDI: respiratory disturbance index; GDS: Geriatric Depression Scale; Pao2: partial pressure of oxygen in arterial blood. ACEI: Angiotensin converting enzyme inhibitor; ARB: Angiotensin II receptor blocker.
Further categorization of alcoholic drinks per week 0, <1, 1-2, 3-5, 6-13, or 14+ did not significantly change results. Bold P values denote P<0.05.
denotes use of Kuskal-Wallis statistic due to non-normal distributions.
In unadjusted analyses, 41% of those in Quartile 1 of SWS (Q1; least SWS) developed incident HTN, compared with less than 30% in each of the other quartiles (Figure 1). We further examined the association of SWS and incident HTN in multivariate models (Table 4). After adjusting for age and BMI, those in Q1 of SWS experienced an approximate 80% increase in risk of incident HTN as compared to those in Q4 (OR 1.81 with 95% confidence interval 1.18-2.80). These results were unchanged after further adjustment for study site, race, history of CVD, the polysomnographic sleep variables of overall arousal index, sleep time with Pao2<80% saturation, RDI, sleep efficiency, total sleep duration, and smoking history and alcohol use. After adjusting for multiple correlated comparisons using the Dubey and Armitage-Parmar procedure27, results were not significantly changed. Additionally, substituting height and weight, waist circumference, hip circumference, or hip: waist ratio for BMI did not significantly change the results.
Figure 1.
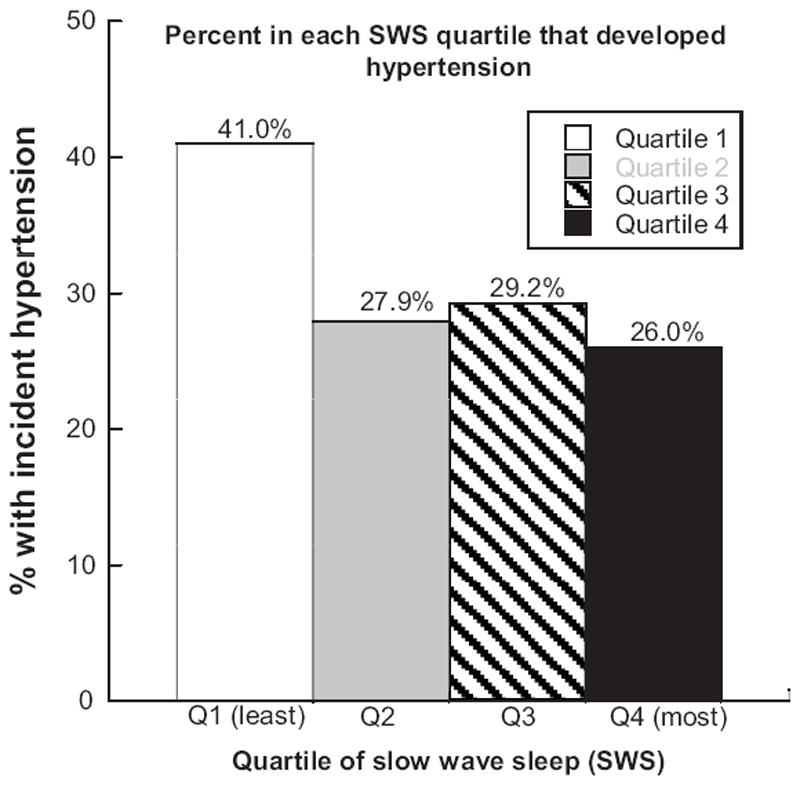
Percent participants in each quartile of slow wave sleep (SWS) that developed incident hypertension.
Table 4.
Adjusted odds ratios for incident hypertension by slow wave sleep (SWS) quartile.
| Adjusted characteristics | SWS Quartile 1 | SWS Quartile 2 | SWS Quartile 3 | SWS Quartile 4 | P value for trend |
|---|---|---|---|---|---|
| Age and BMI | 1.81 (1.18, 2.80) | 1.09 (0.70, 1.70) | 1.15 (0.74, 1.80) | 1.0 (reference) | 0.012 |
| +race, study site | 1.83 (1.18, 2.85) | 1.14 (0.73, 1.78) | 1.18 (0.75, 1.85) | 1.0 | 0.012 |
| +History of CVD | 1.84 (1.18, 2.87) | 1.14 (0.73, 1.79) | 1.17 (0.75, 1.84) | 1.0 | 0.012 |
| +RDI | 1.86 (1.19, 2.91) | 1.14 (0.73, 1.80) | 1.18 (0.75, 1.85) | 1.0 | 0.011 |
| + total sleep duration, %sleep time, Pao2 <80%, overall arousals and sleep efficiency | 1.87 (1.18, 2.95) | 1.12 (0.71, 1.77) | 1.15 (0.73, 1.82) | 1.0 | 0.013 |
| +alcohol use and current smoking | 1.82 (1.15, 2.88) | 1.11 (0.70, 1.75) | 1.15 (0.73, 1.82) | 1.0 | 0.019 |
BMI: body mass index CVD: cardiovascular disease RDI: respiratory disturbance index, number of apneas and hypopneas per hour of sleep, each associated with an oxygen desaturation of 4% or greater; Pao2: partial pressure of oxygen in arterial blood.
Alcohol use denotes ≥1 drink/week. Further categorization of alcoholic drinks per week 0, <1, 1-2, 3-5, 6-13, or 14+ did not significantly change results.
Subgroup analysis of sleep architecture in normotensive men who progressed to prehypertension or hypertension, described in the Online Supplement and Figure S1, revealed an association with decreased percent time in SWS (P=0.004) and percent increased time in stage 2 (N2; P=0.042) sleep as subjects either stayed normotensive, or progressed to pre-hypertension or HTN.
Discussion
Sleep disturbances are exceedingly common in older adults and may contribute to a number of adverse health outcomes, including HTN and cardiovascular disease through perturbations in a number of physiological systems. Most prior research on the relationship between incident HTN and sleep disturbances has focused on SDB, with some studies also addressing sleep duration. To our knowledge, this is the first large-scale analysis of comprehensive PSG data that assesses the association of indices of three key sleep domains: SDB, sleep duration, and sleep architecture, to incident HTN in an elderly cohort. In these community-dwelling older men, we found that men with SWS in the lowest quartile had an approximately 1.8-fold increased incidence of HTN, compared to men with the highest levels of SWS. This association persisted after adjusting for several covariates, and after considering other sleep exposures, such as RDI, the arousal index, and total sleep duration. This study adds to the growing important body of literature regarding sleep and cardiovascular risks. Rather than noting associations alone, it describes more detailed associations of incident disease with sleep in particular stages.
Decreased SWS is increasingly recognized as a marker, possibly etiologically associated with several adverse health outcomes. Sleep architecture, particularly SWS, has been implicated in neurocognition14-16 and more recently, in influencing endocrine function17. Human metabolism is affected by changes in circadian rhythm, which includes the sleep-wake cycle28. Low sleep quality and reduced SWS have been associated with insulin resistance17 and associated with the presence of diabetes29, findings that may relate to the close interactions between the hypothalamic-pituitary-adrenal axis and sleep homeostasis. SWS may potentially be associated with the metabolic syndrome, a notion consistent with our prior observations of an inverse association of SWS with obesity19 in this cohort. The findings in this study provide new evidence that decreased SWS is associated with the development of HTN. Whether decreased SWS is also associated with altered glucose metabolism or to other components of metabolic syndrome could not be assessed due to the unavailability of biochemical measures. A limitation of this study is the lack of fasting glucose or insulin or hemoglobin A1C measurements to investigate these relationships further. However, this sample included only a few diabetics (5.7%) and adjusting for diabetes history did not attenuate the association.
Our results are consistent with a positive effect of SWS on blood pressure regulation. Studies of cardiac hemodynamics during sleep have noted decreased blood pressure and heart rate during NREM, particularly SWS30, suggesting that the decline in blood pressure is attributable to a decline in cardiac output, as peripheral vascular resistance and stroke volume are unaffected. These adaptations are primarily mediated by the autonomic nervous system with decreased sympathetic nervous system (SNS) activity and increased parasympathetic activity30. SNS activity continuously decreases with the deepening of NREM toward SWS, coinciding with the increase of the sympathovagal baroreflex. This baroreflex may account for the benefits of “dipping” of blood pressure on cardiovascular disease, which is impaired in hypertensive subjects who have increased SNS activity31. This “non-dipping” nocturnal blood pressure is a better predictor of all-cause and cardiovascular mortality, coronary heart disease, and stroke, than daytime pressure18. Experimental SWS deprivation in healthy subjects resulted in an attenuation of the dipping of blood pressure during SWS32. Several studies have demonstrated that SWS is lower in older men than women, and declines with age33. Our data suggest that reduced SWS with aging may contribute to the high rates of HTN in older men. Our study found no independent associations between incident HTN and RDI, as a marker of SDB, arousal index (a marker for both SDB and disturbed sleep), and total sleep duration.
Two previous studies have evaluated whether SDB predicts incident HTN. First, the Wisconsin Sleep Cohort Study, with a younger mean age of 47 years, reported a dose–response association between SDB at baseline and incident HTN four years later which was independent of known confounding factors6. The Sleep Heart Health Study, with a mean age of 60 years, found that much of the longitudinal association was accounted for by obesity7. The disparate results may be due to the difference in mean ages or exclusions, given that the incidence of HTN increases with age1 and at our baseline sleep visit, 68% of the subjects were excluded at baseline due to prevalent HTN.
Consistent with some previous studies, total sleep duration measured by PSG was not associated with incident HTN in this older cohort34, 35. The literature on incident HTN and sleep duration examined this association in younger populations8, 36 or with use of self-reported sleep duration.9 Our study suggests differences across the age span in the associations between sleep characteristics and health outcomes.
Poor sleep quality may be measured by several different metrics, including an increased arousal index and increased WASO, decreased sleep efficiency, and increased stages 1 and 2 (N1 and N2) sleep. Prior studies have focused on the arousal index as a metric for increased sympathetic activation and as a potential predictor of HTN. Our study suggests that a specific reduction of SWS, rather than non-specific sleep disruption, may be a more critical factor that influences blood pressure.
The strengths of this study include the use of PSG for objectively measuring sleep characteristics and assessment in a large community-dwelling cohort of older men. However, given that the parent study (MrOs) was originally designed to evaluate the risks of fractures in older men, this study must be considered exploratory in nature. We acknowledge that this observational study is challenged by many factors that influence both blood pressure and sleep, and which also change over time. Additional study to confirm this association is necessary and to determine the direction of the association after longer follow up. Other limitations include the lack of 24 hour ambulatory blood pressure monitoring for HTN and the precise time of the blood pressure readings. Almost a quarter of those with incident hypertension (24.3%) were classified based on a single blood pressure measurement, however, sensitivity analysis that excluded these participants showed similar results (data not shown).
In an exploratory study, we evaluated eleven sleep variables (Online Supplemental Table 1) that raise questions about multiple comparisons. Since many of these indices are highly correlated (Pearson’s coefficients range from -0.86 to 0.64) between sleep efficiency and WASO, we used the Dubey and Armitage-Parmar procedure27 to address the influence of testing for multiple correlated outcomes, and the results were not appreciably changed. These results in older men may not be generalizable to women or younger adults. It is uncertain whether there is a true association between the use of ACEI or ARB and SWS (Table 3) but less than 10% of participants were taking these medications at follow-up (and none at baseline). Residual confounding due to other medications, activity, or comorbid conditions were not captured in this study. Also, use of PSG to determine sleep duration may not be optimal, as PSG monitoring with possible disruptions of leads and electrodes may not represent typical sleep patterns. However, prior work has shown that SWS has high night to night reproducibility26.
Perspectives
This prospective study suggests that older community dwelling men with lower percentage of sleep time in SWS have an increased risk of incident HTN. In contrast, indices of breathing disturbances, level of hypoxemia, sleep duration and arousal index were not independently associated with an increased risk of HTN after considering confounders. This paper adds to the growing body of literature that associates sleep architecture with metabolic and physiologic changes which may reflect altered neurohormones and inflammatory markers. Further studies are necessary to confirm these observations, elucidate the causal pathways, and determine whether modifications in SWS improve HTN.
Supplementary Material
Acknowledgments
Sources of Funding. NHLBI provides funding for the MrOS Sleep ancillary study “Outcomes of Sleep Disorders in Older Men” under the following grant numbers: R01 HL071194, R01 HL070848, R01HL070847, R01 HL070842, R01 HL070841, R01 HL070837, R01 HL070838,and R01 HL070839.
The Osteoporotic Fractures in Men (MrOS) Study is supported by NIAMS, NIA, NCRR, and NIH Roadmap for Medical Research under the following grant numbers: U01 AR45580, U01 AR45614, U01 AR45632, U01 AR45647, U01 AR45654, U01 AR45583, U01 AG18197, U01-AG027810, and UL1 RR024140. This work was also supported by the Veterans Affairs Healthcare System (MMF) and AG08415 (SAI).The authors had full access to all the data in the study and take responsibility for the integrity of the data and the accuracy of the data analysis.
Footnotes
Conflicts of interest. MMF discloses previous grant support from Forest Laboratories and currently owns stock and is employed by Amgen.
References
- 1.Ong KL, Cheung BM, Man YB, Lau CP, Lam KS. Prevalence, awareness, treatment, and control of hypertension among United States adults 1999-2004. Hypertension. 2007;49:69–75. doi: 10.1161/01.HYP.0000252676.46043.18. [DOI] [PubMed] [Google Scholar]
- 2.Nieto FJ, Young TB, Lind BK, Shahar E, Samet JM, Redline S, D’Agostino RB, Newman AB, Lebowitz MD, Pickering TG. Association of sleep-disordered breathing, sleep apnea, and hypertension in a large community-based study. Sleep Heart Health Study. JAMA. 2000;283:1829–1836. doi: 10.1001/jama.283.14.1829. [DOI] [PubMed] [Google Scholar]
- 3.Sharafkhaneh A, Richardson P, Hirshkowitz M. Sleep apnea in a high risk population: a study of Veterans Health Administration beneficiaries. Sleep Med. 2004;5:345–350. doi: 10.1016/j.sleep.2004.01.019. [DOI] [PubMed] [Google Scholar]
- 4.Logan AG, Perlikowski SM, Mente A, Tisler A, Tkacova R, Niroumand M, Leung RS, Bradley TD. High prevalence of unrecognized sleep apnoea in drug-resistant hypertension. J Hypertens. 2001;19:2271–2277. doi: 10.1097/00004872-200112000-00022. [DOI] [PubMed] [Google Scholar]
- 5.Friedman O, Logan AG. The price of obstructive sleep apnea-hypopnea: hypertension and other ill effects. Am J Hypertens. 2009;22:474–483. doi: 10.1038/ajh.2009.43. [DOI] [PubMed] [Google Scholar]
- 6.Peppard PE, Young T, Palta M, Skatrud J. Prospective study of the association between sleep-disordered breathing and hypertension. N Engl J Med. 2000;342:1378–1384. doi: 10.1056/NEJM200005113421901. [DOI] [PubMed] [Google Scholar]
- 7.O’Connor GT, Caffo B, Newman AB, Quan SF, Rapoport DM, Redline S, Resnick HE, Samet J, Shahar E. Prospective study of sleep-disordered breathing and hypertension: the Sleep Heart Health Study. Am J Respir Crit Care Med. 2009;179:1159–1164. doi: 10.1164/rccm.200712-1809OC. [DOI] [PMC free article] [PubMed] [Google Scholar]
- 8.Knutson KL, Van Cauter E, Rathouz PJ, Yan LL, Hulley SB, Liu K, Lauderdale DS. Association between sleep and blood pressure in midlife: the CARDIA sleep study. Arch Intern Med. 2009;169:1055–1061. doi: 10.1001/archinternmed.2009.119. [DOI] [PMC free article] [PubMed] [Google Scholar]
- 9.Gottlieb DJ, Redline S, Nieto FJ, Baldwin CM, Newman AB, Resnick HE, Punjabi NM. Association of usual sleep duration with hypertension: the Sleep Heart Health Study. Sleep. 2006;29:1009–1014. doi: 10.1093/sleep/29.8.1009. [DOI] [PubMed] [Google Scholar]
- 10.Stranges S, Dorn JM, Cappuccio FP, Donahue RP, Rafalson LB, Hovey KM, Freudenheim JL, Kandala NB, Miller MA, Trevisan M. A population-based study of reduced sleep duration and hypertension: the strongest association may be in premenopausal women. J Hypertens. 2010;28:896–902. doi: 10.1097/HJH.0b013e328335d076. [DOI] [PubMed] [Google Scholar]
- 11.Friedman O, Bradley TD, Ruttanaumpawan P, Logan AG. Independent association of drug-resistant hypertension to reduced sleep duration and efficiency. Am J Hypertens. 2010;23:174–179. doi: 10.1038/ajh.2009.220. [DOI] [PubMed] [Google Scholar]
- 12.McCubbin JA, Pilcher JJ, Moore DD. Blood Pressure Increases During a Simulated Night Shift in Persons at Risk for Hypertension. Int J Behav Med. 2010;17:314–320. doi: 10.1007/s12529-010-9117-6. [DOI] [PubMed] [Google Scholar]
- 13.Silber MH, Ancoli-Israel S, Bonnet MH, Chokroverty S, Grigg-Damberger MM, Hirshkowitz M, Kapen S, Keenan SA, Kryger MH, Penzel T, Pressman MR, Iber C. The visual scoring of sleep in adults. J Clin Sleep Med. 2007;3:121–131. [PubMed] [Google Scholar]
- 14.Marshall L, Helgadottir H, Molle M, Born J. Boosting slow oscillations during sleep potentiates memory. Nature. 2006;444:610–613. doi: 10.1038/nature05278. [DOI] [PubMed] [Google Scholar]
- 15.Huber R, Ghilardi MF, Massimini M, Tononi G. Local sleep and learning. Nature. 2004;430:78–81. doi: 10.1038/nature02663. [DOI] [PubMed] [Google Scholar]
- 16.Landsness EC, Crupi D, Hulse BK, Peterson MJ, Huber R, Ansari H, Coen M, Cirelli C, Benca RM, Ghilardi MF, Tononi G. Sleep-dependent improvement in visuomotor learning: a causal role for slow waves. Sleep. 2009;32:1273–1284. doi: 10.1093/sleep/32.10.1273. [DOI] [PMC free article] [PubMed] [Google Scholar]
- 17.Tasali E, Leproult R, Ehrmann DA, Van Cauter E. Slow-wave sleep and the risk of type 2 diabetes in humans. Proc Natl Acad Sci U S A. 2008;105:1044–1049. doi: 10.1073/pnas.0706446105. [DOI] [PMC free article] [PubMed] [Google Scholar]
- 18.Fagard RH, Celis H, Thijs L, Staessen JA, Clement DL, De Buyzere ML, De Bacquer DA. Daytime and nighttime blood pressure as predictors of death and cause-specific cardiovascular events in hypertension. Hypertension. 2008;51:55–61. doi: 10.1161/HYPERTENSIONAHA.107.100727. [DOI] [PubMed] [Google Scholar]
- 19.Rao MN, Blackwell T, Redline S, Stefanick ML, Ancoli-Israel S, Stone KL. Association between sleep architecture and measures of body composition. Sleep. 2009;32:483–490. doi: 10.1093/sleep/32.4.483. [DOI] [PMC free article] [PubMed] [Google Scholar]
- 20.Narkiewicz K. Obesity and hypertension--the issue is more complex than we thought. Nephrol Dial Transplant. 2006;21:264–267. doi: 10.1093/ndt/gfi290. [DOI] [PubMed] [Google Scholar]
- 21.Orwoll E, Blank JB, Barrett-Connor E, Cauley J, Cummings S, Ensrud K, Lewis C, Cawthon PM, Marcus R, Marshall LM, McGowan J, Phipps K, Sherman S, Stefanick ML, Stone K. Design and baseline characteristics of the osteoporotic fractures in men (MrOS) study--a large observational study of the determinants of fracture in older men. Contemp Clin Trials. 2005;26:569–585. doi: 10.1016/j.cct.2005.05.006. [DOI] [PubMed] [Google Scholar]
- 22.Blank JB, Cawthon PM, Carrion-Petersen ML, Harper L, Johnson JP, Mitson E, Delay RR. Overview of recruitment for the osteoporotic fractures in men study (MrOS) Contemp Clin Trials. 2005;26:557–568. doi: 10.1016/j.cct.2005.05.005. [DOI] [PubMed] [Google Scholar]
- 23.Chobanian AV, Bakris GL, Black HR, Cushman WC, Green LA, Izzo JL, Jr, Jones DW, Materson BJ, Oparil S, Wright JT, Jr, Roccella EJ. Seventh report of the Joint National Committee on Prevention, Detection, Evaluation, and Treatment of High Blood Pressure. Hypertension. 2003;42:1206–1252. doi: 10.1161/01.HYP.0000107251.49515.c2. [DOI] [PubMed] [Google Scholar]
- 24.Callaway C, Chumlea W, Bouchard C. In: Anthropometric standardization reference manual. Lohman T, Roche A, Martorell R, editors. Champaign: Human Kinetics; 1988. pp. 39–54. [Google Scholar]
- 25.Rechtschaffen A, Kales A. A Manual of Standardized Terminology, Techniques and Scoring System for Sleep Stages of Human Subjects. Los Angeles: Brain Information Service, Brain Research Institute, UCLA; 1973. [Google Scholar]
- 26.Quan SF, Howard BV, Iber C, Kiley JP, Nieto FJ, O’Connor GT, Rapoport DM, Redline S, Robbins J, Samet JM, Wahl PW. The Sleep Heart Health Study: design, rationale, and methods. Sleep. 1997;20:1077–1085. [PubMed] [Google Scholar]
- 27.Sankoh AJ, Huque MF, Dubey SD. Some comments on frequently used multiple endpoint adjustment methods in clinical trials. Stat Med. 1997;16:2529–2542. doi: 10.1002/(sici)1097-0258(19971130)16:22<2529::aid-sim692>3.0.co;2-j. [DOI] [PubMed] [Google Scholar]
- 28.Froy O. The circadian clock and metabolism. Clin Sci (Lond) 2011;120:65–72. doi: 10.1042/CS20100327. [DOI] [PubMed] [Google Scholar]
- 29.Pallayova M, Donic V, Gresova S, Peregrim I, Tomori Z. Do differences in sleep architecture exist between persons with type 2 diabetes and nondiabetic controls? J Diabetes Sci Technol. 2010;4:344–352. doi: 10.1177/193229681000400215. [DOI] [PMC free article] [PubMed] [Google Scholar]
- 30.Trinder J, Kleiman J, Carrington M, Smith S, Breen S, Tan N, Kim Y. Autonomic activity during human sleep as a function of time and sleep stage. J Sleep Res. 2001;10:253–264. doi: 10.1046/j.1365-2869.2001.00263.x. [DOI] [PubMed] [Google Scholar]
- 31.Drager LF, Ueno LM, Lessa PS, Negrao CE, Lorenzi-Filho G, Krieger EM. Sleep-related changes in hemodynamic and autonomic regulation in human hypertension. J Hypertens. 2009;27:1655–1663. doi: 10.1097/HJH.0b013e32832c6982. [DOI] [PubMed] [Google Scholar]
- 32.Sayk F, Teckentrup C, Becker C, Heutling D, Wellhoner P, Lehnert H, Dodt C. Effects of selective slow-wave sleep deprivation on nocturnal blood pressure dipping and daytime blood pressure regulation. Am J Physiol Regul Integr Comp Physiol. 2010;298:R191–197. doi: 10.1152/ajpregu.00368.2009. [DOI] [PubMed] [Google Scholar]
- 33.Redline S, Kirchner HL, Quan SF, Gottlieb DJ, Kapur V, Newman A. The effects of age, sex, ethnicity, and sleep-disordered breathing on sleep architecture. Arch Intern Med. 2004;164:406–418. doi: 10.1001/archinte.164.4.406. [DOI] [PubMed] [Google Scholar]
- 34.van den Berg JF, Tulen JH, Neven AK, Hofman A, Miedema HM, Witteman JC, Tiemeier H. Sleep duration and hypertension are not associated in the elderly. Hypertension. 2007;50:585–589. doi: 10.1161/HYPERTENSIONAHA.107.092585. [DOI] [PubMed] [Google Scholar]
- 35.Lopez-Garcia E, Faubel R, Guallar-Castillon P, Leon-Munoz L, Banegas JR, Rodriguez-Artalejo F. Self-reported sleep duration and hypertension in older Spanish adults. J Am Geriatr Soc. 2009;57:663–668. doi: 10.1111/j.1532-5415.2009.02177.x. [DOI] [PubMed] [Google Scholar]
- 36.Gangwisch JE, Heymsfield SB, Boden-Albala B, Buijs RM, Kreier F, Pickering TG, Rundle AG, Zammit GK, Malaspina D. Short sleep duration as a risk factor for hypertension: analyses of the first National Health and Nutrition Examination Survey. Hypertension. 2006;47:833–839. doi: 10.1161/01.HYP.0000217362.34748.e0. [DOI] [PubMed] [Google Scholar]
Associated Data
This section collects any data citations, data availability statements, or supplementary materials included in this article.