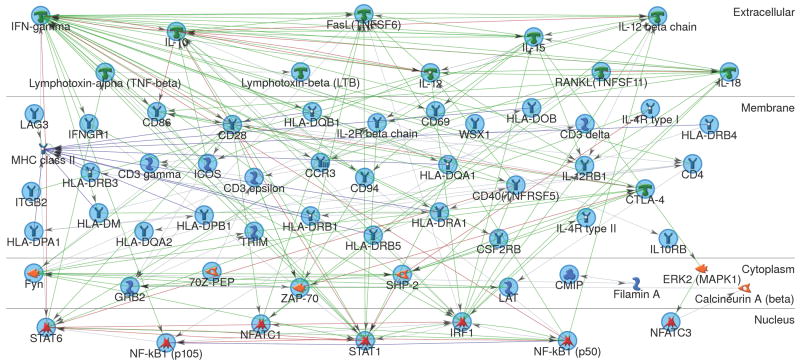
FIGURE 1.
Relationships among molecules coded by 57 focal genes, organized by cellular compartment. Network analysis was conducted using the direct-interactions building algorithm implemented in MetaCore software.
 = receptor ligand,
 = receptor,
 = G-protein coupled receptor,
 = binding protein,
 = complex/group of proteins,
 = protein kinase,
 = protein phosphatase,
 = protein,
 = transcription factor. Green line = upregulation, red line = down-regulation, blue line = complex or group member.

