

Abstract
Dystrobrevin binding protein 1 (DTNBP1) has been identified as putative schizophrenia susceptibility gene, but it remains unknown whether polymorphisms relate to altered cerebral structure. We examined relationships between a previously implicated DTNBP1 risk variant [P1578] and global and segmented brain tissue volumes and regional cortical thickness in schizophrenia (n = 62; 24 risk carriers) and healthy subjects (n = 42; 11 risk carriers), across ethnic groups and within Caucasians. Schizophrenia patients showed similar brain volumes, but significantly reduced brain‐size adjusted gray matter and CSF volumes and cortical thinning in a widespread neocortical distribution compared to controls. DTNBP1 risk was found associated with reduced brain volume, but not with tissue sub‐compartments. Cortical thickness, which was weakly associated with brain size, showed regional variations in association with genetic risk, although effects were dominated by highly significant genotype by diagnosis interactions over broad areas of cortex. Risk status was found associated with regional cortical thinning in patients, particularly in temporal networks, but with thickness increases in controls. DTNBP1 effects for brain volume and cortical thickness appear driven by different neurobiological processes. Smaller brain volumes observed in risk carriers may relate to previously reported DTNBP1/cognitive function relationships irrespective of diagnosis. Regional cortical thinning in patient, but not in control risk carriers, may suggest that DTNBP1 interacts with other schizophrenia‐related risk factors to affect laminar thickness. Alternatively, DTNBP1 may influence neural processes for which individuals with thicker cortex are less vulnerable. Although DTNBP1 relates to cortical thinning in schizophrenia, morphological changes in the disorder are influenced by additional genetic and/or environmental factors. Hum Brain Mapp, 2009. © 2009 Wiley‐Liss, Inc.
Keywords: magnetic resonance imaging (MRI), dysbindin, genetic marker, polymorphism, cortical thickness, brain structure, morphology, gray matter
INTRODUCTION
Schizophrenia has a substantial heritable component (∼ 80%) where genetic factors in addition to harmful environmental factors appear to account for disease processes [Harrison and Weinberger, 2005; Sullivan et al., 2003]. Epidemiological research suggests that multiple genes of small‐to‐moderate influence underlie the genetic transmission of schizophrenia [Sullivan et al., 2003]. Accordingly, a growing number of loci and positional susceptibility genes have been implicated in the search for factors that affect disease inheritance. However, findings across laboratories lack strong correspondence, and the role of any specific gene has not been established with certainty [Harrison and Weinberger, 2005; Norton et al., 2006; Sanders et al., 2008; Sullivan et al., 2003]. Imaging data also suggests that some brain abnormalities observed in schizophrenia may serve as markers for disease‐related genetic predisposition in at‐risk, but as of yet unaffected, individuals [Bearden et al., 2007; Glahn et al., 2007]. Understanding how genes shown to convey a risk for schizophrenia affect changes in brain structure or function may elucidate the role of putative risk genes in the etiology of the disorder and/or provide information concerning the underlying biological mechanisms of specific genetic factors in general. At present, the relationships between schizophrenia susceptibility genes and structural imaging phenotypes are largely uncharacterized.
Of the susceptibility genes identified, moderate evidence exists to suggest dystrobrevin binding protein 1 or dysbindin (DTNBP1) [Straub et al., 2002], located on chromosome 6p22.3, is a risk factor for schizophrenia. DTNBP1 has been implicated in many independent genetic linkage and association studies, e.g., Duan et al., 2007; Riley and Kendler, 2006; Tochigi et al., 2006; Tosato et al., 2007; Vilella et al., 2008, although associations at the genome‐wide level have not yet been confirmed and there are failures to replicate across different samples [Li and He, 2007; Peters et al., 2008; Sanders et al., 2008; Turunen et al., 2007]. The molecular mechanisms of DTNBP1, a protein that binds alpha and beta dystrobrevin, are not completely understood. Studies implicate its involvement in postsynaptic density functions and presynaptic glutamatergic transmission [Numakawa et al., 2004]. DTNBP1 also appears to influence neuron viability, and via glutamate signaling, to modulate the activity of dopamine and other neurotransmitters [Weickert et al., 2004]. Through biochemical disturbances involving dopaminergic and glutamatergic systems [Pearlson, 2000], DTNBP1 may also relate to neuropil abnormalities reported in schizophrenia [Rajkowska et al., 1998; Selemon and Goldman‐Rakic, 1999; Selemon et al., 2003]. DTNBP1 is widely distributed in the central nervous system [Harrison and Weinberger, 2005] with expression reported in frontal and temporal cortices and within the hippocampus, thalamus and basal ganglia [Talbot et al., 2004; Weickert et al., 2004], regions highly implicated in the structural and functional neuropathology of schizophrenia [Clinton and Meador‐Woodruff, 2004; Honea et al., 2005; Mamah et al., 2007; Shenton et al., 2001]. Notably, existing data support that variation in the DTNBP1 gene acts to increase risk for schizophrenia through reduced expression [Bray et al., 2005], which has been demonstrated in prefrontal [Weickert et al., 2004] and hippocampal [Talbot et al., 2004; Weickert et al., 2008] regions.
Schizophrenia imaging studies report structural alterations in brain regions contributing to many aspects of sensorimotor and higher cognitive function. In the presence of sub‐threshold brain size reductions, relative deficits of gray matter are most reliably documented in lateral and medial temporal cortices and in frontal and parietal association regions [Narr et al., 2005a, b; Shenton et al., 2001]. Some of these brain abnormalities appear to serve as intermediate phenotypes (or endophenotypes) for schizophrenia‐related genetic predisposition, e.g., Baare et al., 2001b; Bearden et al., 2007; Narr et al., 2002; Seidman et al., 2003. Therefore, genes conferring risk for schizophrenia may also modulate disease‐associated changes in brain structure. While some prior studies have examined relationships between imaging endophenotypes and putative genetic risk factors, to our knowledge associations between DTNBP1 and variations in brain structure in schizophrenia and healthy subjects have not been addressed. However, at least two electrophysiological studies have shown relationships between DTNBP1 risk variants and brain function that suggest a role for this gene in prefrontal [Fallgatter et al., 2006] and early sensory processing [Donohoe et al., 2008]. Evidence from behavioral studies further suggest that DTNBP1 influences prefrontal spatial working memory [Donohoe et al., 2007], results that are consistent with recent evidence from animal data supporting that this gene is involved in working memory mediated by prefrontal cortices and long term memory mediated by the medial temporal lobe [Takao et al., 2008]. It thus appears plausible that DTNBP1 may also affect changes in the structural integrity of cortical networks shown as disturbed in schizophrenia. We therefore set out to investigate to examine relationships between DTNBP1 risk status and altered cerebral structure in the disorder.
A number of different DTNBP1 DNA polymorphisms have been linked with schizophrenia where discrepancies exist concerning the risk alleles and/or haplotypes genotyped and/or shown to associate with the disorder across studies [Mutsuddi et al., 2006, also see: http://www.ncbi.nlm.nih.gov/entrez/dispomim.cgi?id=607145]. However, several implicated single nucleotide polymorphisms (SNPs) appear in high allelic association and share a strong linkage disequilibrium (LD) structure [Li et al., 2007]. In this current investigation we focused on examining genotype/imaging phenotype relationships using the DTNBP1 [P1578] variant previously shown to associate with schizophrenia [Funke et al., 2004] and to associate with cognitive function in an overlapping sample [Burdick et al., 2006, 2007], where general cognitive ability itself is shown to relate to brain size and regional variations of cortical thickness [Narr et al., 2007]. We assessed associations between the DTNBP1 risk genotype with overall brain volume and the volume of each brain tissue compartment. Relationships between DTNBP1 risk status and gray matter thickness measured at high spatial resolution were examined to isolate more regional effects of genotype. Although DTNBP1 variants have been shown to associate with schizophrenia across racial categories, population stratification may account for prior discrepancies in results [Li and He, 2007]. We thus assessed DTNBP1/imaging phenotype relationships in schizophrenia patients (n = 62) and healthy controls (n = 42) while controlling for ethnic group, as well as in within patient (n = 26) and control (n = 25) Caucasian subjects only.
MATERIALS AND METHODS
Subjects
Study participants included 62 patients with schizophrenia (mean age: 27.6 ± 6.2 SD; 46m/16f) and 42 healthy control subjects (mean age: 28.5 ± 7.5; 16m/26f). Of these subjects, 26 patients (mean age: 27.5 ± 7.9, 19m/7f) and 25 healthy controls (mean age: 26.9 ± 6.5, 10m/15f) were categorized as Caucasian. Other ethnic categories included African Americans (25 patients; 11 controls), Hispanics (4 patients; 5 controls), Asian Americans (5 patients; 1 control) and 2 patients of mixed ethnicity. The gender and age composition of subjects by diagnosis and genotype are shown in Table I across ethnic categories and within Caucasians only. The participants of this study overlap with, but are not identical to those included in prior investigations of the structural imaging correlates of first‐episode schizophrenia [Narr et al., 2005a, b] and with prior studies of DTNBP1 and schizophrenia and cognition [Burdick et al., 2006, 2007].
Table I.
Means and standard deviations of brain tissue volumes by genotype and diagnosis
| Patients, all races (n = 62) | Patients, Caucasians (n = 26) | Controls, all races (n = 42) | Controls Caucasians (n = 25) | |||||
|---|---|---|---|---|---|---|---|---|
| Risk carriers (n = 24) | Non‐carriers (n = 38) | Risk carriers (n = 5) | Non‐carriers (n = 21) | Risk carriers (n = 11) | Non‐carriers (n = 31) | Risk carriers (n = 8) | Non‐carriers (n = 17) | |
| Sex | 16m/8f | 30m/8f | 3m/2f | 15m/6f | 4m/7f | 12m/19f | 5f/3m | 7m/10f |
| Brain volume | 1158.77 ± 103.04 | 1210.82 ± 119.34 | 1124.56 ± 113.90 | 1243.01 ± 113.58 | 1178.03 ± 105.70 | 1210.77 ± 975.19 | 1201.76 ± 930.86 | 1234.24 ± 108.13 |
| Gray matter | 612.43 ± 28.95 | 614.36 ± 27.99 | 617.22 ± 27.42 | 616.38 ± 53.79 | 638.99 ± 21.62 | 624.86 ± 249.33 | 626.76 ± 14.52 | 641.85 ± 24.90 |
| White matter | 433.57 ± 31.12 | 426.05 ± 26.93 | 421.95 ± 22.75 | 437.31 ± 60.72 | 423.43 ± 16.85 | 430.29 ± 31.97 | 425.80 ± 24.74 | 419.11 ± 15.80 |
| CSF | 148.95 ± 23.36 | 154.55 ± 22.43 | 155.89 ± 21.16 | 141.26 ± 25.00 | 132.53 ± 11.95 | 139.80 ± 24.00 | 142.40 ± 22.24 | 133.99 ± 12.93 |
Overall brain volume means are shown after residualizing for sex and age and adding the unstandardized residuals to the mean of the entire sample. Brain tissue volumes (gray matter, white matter, and CSF) are shown after residualizing for sex, age and brain volume and adding the unstandardized residuals to the overall group mean respectively.
All patients were recruited through admissions to the Zucker Hillside Hospital in Glen Oaks, New York, and were participating in clinical trials comparing the efficacy of antipsychotic medications. Of the 62 patients, 33 were receiving treatment at the time of the MRI exam where antipsychotics included (number in parentheses) clozapine (4), fluphenazine (1), haldol (3), olanzapine (17) or risperidone (7). One patient was receiving olanzapine and haldol. Medication data were unavailable for 7 patients. The diagnostic status of patients was confirmed with the Structured Clinical Interview for Axis I DSM‐IV Disorders (SCID) [First et al., 1997] and the Schedule for Affective Disorders and Schizophrenia ‐ Change Version (SADS‐C) [Endicott and Spitzer, 1978]. To characterize the sample clinically, two symptom cluster scores were computed based on items from a modified version of the Scale for the Assessment of Negative Symptoms (SANS) [Andreasen, 1984] and the SADS‐C with psychosis and disorganization items (SADS‐C + PD). The positive symptom cluster score was computed as the average of the severity of delusions and hallucinations items from the SADS‐C +PD. The negative symptom cluster score was computed as the average of the global ratings of affective flattening, alogia, avolition‐apathy, and asociality from the SANS. In this sample the mean level of positive symptoms was 3.9 ± 1.7 SD and mean level of negative symptoms was 2.6 ± 1.0. Data were unavailable for one subject.
Healthy comparison subjects were recruited through local newspaper advertisements and by community word of mouth. Control subjects had no history of psychiatric illness as determined by clinical interview using the non‐patient SCID (SCID‐NP). Study exclusion criteria for all participants included serious neurological or endocrine disorders, any other medical condition known to affect the brain, or meeting DSM‐IV criteria for mental retardation. Education level differed significantly between patients (mean years of education: 12.89 ± 1.94 SD) and controls (mean: 15.04 ± 2.47) (F(1,100) = 23.47, P < 0.001). Information was missing for 3 patients. However, parental socio‐economic status (SES) was similar between patient (mean: 3.09 ± 1.94) and control groups (mean: 2.63 ± 0.955 SD) (P > 0.16). The North Shore–Long Island Jewish Health System IRB approved all procedures and informed written consent was obtained from all subjects.
Genotyping
Venous blood samples were used for the extraction of genomic DNA. Genotyping protocols have been detailed previously [Burdick et al., 2006; Funke et al., 2004]. DTNBP1 SNPs were genotyped using the MALDI‐TOF mass spectrometry by the Sequenom system where markers were checked to ensure criteria for Hardy‐Weinberg equilibrium. Only subjects with alleles that could be assigned with a confidence of ≥95% were included for study. Our analyses focused on P1578 (rs1018381) shown to be a tagging SNP for a haplotype (CTCTAC) previously associated with increased risk for schizophrenia [Funke et al., 2004] and to demonstrate relationships with cognitive phenotypes in patients and controls [Burdick et al., 2006, 2007]. Subjects were categorized according to whether they possessed at least one copy of the risk allele. That is, homozygote risk carriers were grouped with heterozygote carriers [Burdick et al., 2006, 2007] and compared with non‐carriers for analyses of genotype‐imaging phenotype relationships.
Image Acquisition and Preprocessing
High‐resolution 3D SPGR MR images were obtained on a 1.5 Tesla scanner (General Electric, Milwaukee, WI) as a series of 124 contiguous 1.5 mm coronal brain slices (256 × 256 matrix, 0.86 mm × 0.86 mm in‐plane resolution). Image processing procedures were performed as previously detailed [Narr et al., 2005a, b]. Image volumes were corrected for head tilt and alignment using a six parameter rigid‐body transformation, edited to remove non‐brain tissue and the cerebellum (scalp editing inter‐rater reliability, r I = 0.99), corrected for signal intensity non‐uniformities [Sled and Pike, 1998], and segmented into voxels most representative of gray matter, white matter and CSF using a partial volume correction method [Shattuck et al., 2001]. Estimates of total brain size and of brain tissue compartments were obtained from the scalp‐edited tissue classified volumes.
Cortical Thickness Modeling
The cortical surfaces of each hemisphere were extracted from scalp edited image volumes [MacDonald et al., 1994] and used to manually identify 29 sulcal/gyral landmarks by employing validated anatomic protocols for which inter and intra‐rater reliability procedures have been reported [Narr et al., 2005a, b]. Cortical pattern matching methods [Narr et al., 2005a, b; Thompson et al., 2000, 2004] were then used to spatially relate homologous regions of cortex across subjects to allow relationships between DTNBP1 and gray matter thickness to be examined at high spatial resolution. Briefly, surface‐warping algorithms use the manually derived sulcal/gyral landmarks as anchors to drive the same cortical anatomy into correspondence. This warping procedure thus assigns the same coordinate values to matching anatomic regions across subjects at high spatial density (65,536 coordinate locations) without imposing any scaling to individual brain volumes. Cortical thickness measures, defined as the shortest 3D distance without crossing CSF voxels from the cortical white‐gray matter interface to the hemispheric surface, were then obtained at each spatially homologous cortical coordinate point.
Statistical Analyses
Genotype/imaging phenotype relationships were assessed using the General Linear Model (GLM). Diagnosis (schizophrenia patients; healthy controls) and Genotype (carriers of the risk allele; non‐carriers) were included as independent variables and interactions between Diagnosis and Genotype were examined. Whole brain and segmented brain tissue volumes (gray matter, white matter and CSF) were used as dependent variables. Sex and Age were included in the model and total brain volume was included as an additional covariate for analyses of segmented brain tissue volumes. Regional variations of cortical thickness were assessed using the same statistical model implemented using R (http://www.r-project.org/). However, the cube root of brain volume was included as a covariate given that cortical thickness represents a distance rather than a volume measure. Analyses of cortical thickness measures were performed at 65,536 coordinate locations to provide spatially detailed maps of results. These results were mapped to the average surface representation of the cortex where color indicates the probability values for significant regional effects. Analyses were performed in all subjects including ethnic category as a covariate and in Caucasian subjects separately.
A two‐tailed alpha level of P < 0.05 was used as the threshold for statistical significance. However, since cortical thickness measures were made at thousands of spatially correlated surface locations, permutation testing was used to confirm the overall significance of regional results [Anderson and Legendre, 1999; Anderson and ter Braak, 2003]. For permutation analyses, the number of surface points within the hemisphere that were significant using a more conservative threshold of P < 0.01 (two‐tailed) were compared to the number of significant surface points that occurred by chance when subjects were randomly assigned to groups in 10,000 new randomized analyses.
RESULTS
Kolmogorov‐Smirnov statistics determined that brain tissue volume measures were normally distributed. A main effect of Genotype was observed for whole brain volume, F(1,103) = 3.78, P < 0.05, across all ethnic groups and within Caucasians only, F(1,50) = 4.20, P < 0.05, where carriers of the risk allele exhibited smaller brain volumes compared to non‐carriers (Fig. 1). Effects of Genotype were not significant for any tissue compartment when controlling for whole brain volume (P < 0.10). However, main effects of Diagnosis were observed for brain size adjusted gray matter, F(1,103) = 8.31, P < 0.005 (controls larger) and CSF F(1,103) = 8.42, P < 0.005 (patients larger) across all races, although these effects were at trend level significance within Caucasian subjects only (gray matter, F(1,51) = 3.20, P < 0.08; CSF, F(1,51) = 2.50, P < 0.12). Interactions between Genotype and Diagnostic group were not observed for brain volume or brain tissue volume measures within Caucasians or across races. Means and standard deviations for brain tissue volumes are provided in Table I in groups defined by Diagnosis and Genotype. For each tissue compartment, values have been residualized for sex, age, and brain volume. The residuals were added to the mean volume of each measure for the entire sample to allow relative differences between groups to be compared in units comparable to the actual volumes. Figure 1 plots brain volume measures by risk status and diagnosis.
Figure 1.
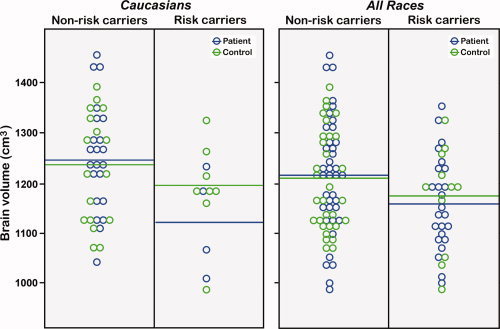
Raw brain volumes are shown for DTNBP1 risk and non‐risk carriers within Caucasians (left) and across races (right) after residualizing for sex and age and adding the residuals to the mean of the entire sample. Patient data points are shown in green and control data points are shown in blue. Horizontal lines indicate the mean brain volume for patient and controls within each DTNBP1 risk category.
Cortical thickness results are mapped in Figures 2, 4. Figure 2 shows the main effect of Diagnosis across all races (right) and within Caucasian subjects (left). Figure 3 shows the main effects of Genotype, where the bottom row shows significant interactions between Genotype and Diagnosis, mapped within all races and Caucasians separately. Figure 4 shows the effects of Genotype mapped within patients and control subjects separately.
Figure 2.
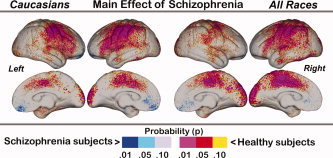
Main effects of Diagnosis mapped within Caucasians (left) and across all races (right). Probability values are indexed by the color bar. Red and pink indicate regions where patients exhibit significant cortical thinning compared to controls. Light and dark blue indicate where patients exhibit significantly increased cortical thickness compared to controls.
Figure 4.
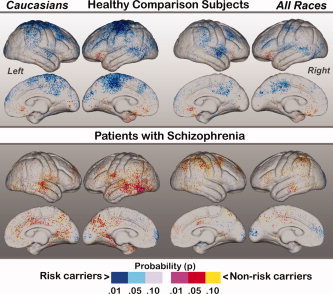
Simple effects of Genotype mapped within healthy subjects (top) and patients with schizophrenia. Effects are again shown within Caucasians subjects only (left) and across all races (right). Probability values are indexed by the color bar. Red and pink indicate regions where carriers of the DTNBP1 risk variant exhibit decreased cortical thickness compared to non‐carriers. Light and dark blue indicate regions where non‐carriers show decreased thickness compared to risk carriers.
Figure 3.
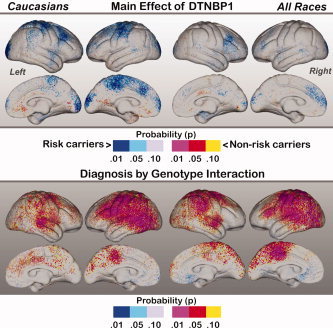
Top: Main effects of Genotype mapped within Caucasians (left) and across all races (right). Probability values are indexed by the color bar. Red and pink indicate regions where carriers of the DTNBP1 risk variant exhibit decreased cortical thickness compared to non‐carriers. Light and dark blue indicate regions where non‐carriers show decreased thickness compared to risk carriers. Bottom: Interactions between Diagnostic Group and DTNBP1 risk status. The direction of interaction effects may be interpreted by examining the simple effects of genotype mapped in Figure 4.
For the main effect of schizophrenia mapped in Figure 2, red and pink indicate regions where healthy control subjects show significantly increased cortical thickness compared to schizophrenia patients; blue shades indicate regions where patients show increases compared to controls. Patterns of schizophrenia‐related cortical thinning are similar to those previously reported in an overlapping sample [Narr et al., 2005a, b] and apparent in supragenual cingulate and paracingulate cortices and the occipital pole medially. Laterally, pronounced cortical thinning is evident in heteromodal association and sensorimotor cortices including dorsolateral, parietal association areas and regions of the superior and middle temporal gyri. Cortical thinning effects appear similar when mapped across all races and within Caucasians separately. A discrete region in the vicinity of the medial gyrus rectus showed increased cortical thickness in patients with respect to controls. Permutation tests thresholded at P < 0.01 confirmed the significance of schizophrenia‐related cortical thinning within the left (corrected P value = 0.002 and 0.001) and right hemisphere (corrected P value = 0.006 and 0.015) for Caucasians and across all races respectively.
Main effects of Genotype mapped across all subjects (left) and within Caucasian subjects only (right) are shown in Figure 3. Red and pink indicate regions where carriers of the DTNBP1 risk allele show decreased cortical thickness with respect to non‐carriers. Blue shades indicate where risk carriers show increased cortical thickness compared to non‐risk carriers. Contrary to our expectations, Caucasian risk carriers showed some significant regional increases of cortical thickness in sensorimotor cortices (the paracentral lobule medially), the posterior superior and middle frontal gyrus, and the occipital poles compared to Caucasian non‐carriers. Only relatively subtle reductions of cortical thickness were apparent in risk carriers compared to non‐carriers. Main effects of Genotype mapped across all races were less pronounced: risk carriers showed increased thickness in the posterior middle frontal gyrus laterally and left anterior prefrontal cortex. Permutation analyses thresholded at P < 0.01 confirmed the significance of regional effects within Caucasian subjects only (corrected P value = 0.017 and 0.02 for the left and right hemisphere respectively).
The interactions between Diagnostic Group and Genotype are mapped in the second row of Figure 3. The color bar represents directional effects that can be interpreted by examining the simple effects of Genotype mapped in Figure 4. Pronounced interaction effects are apparent over much of the lateral left hemisphere both in Caucasians and across all races encompassing dorsolateral, sensorimotor, parietal, temporal and occipital association regions. Interaction effects in the right hemisphere were slightly less prominent and observed within dorsolateral prefrontal cortex, parietal association regions, and the superior temporal gyrus. Medially, effects were concentrated within left paracentral lobule and paracingulate cortices. Permutation analyses confirmed the overall significance of regional effects (left hemisphere corrected P value = 0.002 for both Caucasians and across races, right hemisphere corrected P value = 0.02 for Caucasians and 0.007 across all races).
Figure 4 shows the simple effects of Genotype mapped separately in healthy subjects (top row) and in patients with schizophrenia (bottom row). In healthy Caucasian risk carriers cortical thickness increases were observed within sensorimotor, premotor and dorsolateral prefrontal cortices, and within parietal‐occipital association regions and the right superior temporal gyrus compared to Caucasian non‐carriers. These effects, though less pronounced in sensorimotor cortices, showed a similar pattern when mapped across all races. Decreases of cortical thickness in risk carriers were apparent only in concentrated orbitofrontal clusters. Effects of Genotype mapped within patients with schizophrenia showed a very different pattern of results to those exhibited by healthy subjects. Risk carriers showed patterns of decreased–as opposed to increased–laminar thickness in distributed cortical regions, particularly within temporal cortices bilaterally in Caucasian patients and frontal, parietal and temporal association regions across all races. Increases in cortical thickness were mostly absent within patient risk carriers, with the exception of some clusters localized in the frontal and occipital poles. Permutation analyses for simple effects of genotype within diagnostic groups were significant for control Caucasians only (corrected P value = 0.01 and 0.02 for the left and right hemispheres respectively). Corrected P values for effects of genotype mapped across all healthy subjects irrespective of race and within patients were slightly above the threshold of significance (P > 0.10).
To reconcile the volumetric and cortical thickness findings reported above, post‐hoc correlation analyses were performed to examine the relationships between brain tissue volume measures and cortical thickness measurements averaged across the entire cortical mantle in each subject. Results showed that although whole brain volume is highly correlated with gray matter (r = 0.89, P < 0.0001), white matter (r = 0.83, P < 0.0001) and CSF volume (r = 0.51, P < 0.0001), and average cortical thickness is significantly associated with both gray (r = 0.35, P < 0.001) and white matter volume (r = −0.36, P < 0.001), average cortical thickness is not significantly associated with CSF (r = −0.05, P = 0.61) or whole brain volume (r = 0.03, P = 0.81).
DISCUSSION
DTNBP1 is one of the more studied schizophrenia susceptibility genes, although it remains unknown whether variants of this gene relate to alterations of cerebral structure observed in disorder. This investigation thus sought to address relationships between brain tissue volumes and cortical thickness and a DTNBP1 risk variant. The primary results were as follows: (1) schizophrenia patients showed significantly reduced gray matter and increased CSF volumes (after correction for whole brain volume) and pronounced cortical thinning over large areas of sensorimotor and frontal, temporal, and parietal association cortices compared to healthy subjects; (2) carriers of the DTNBP1 risk allele showed significantly smaller whole brain volumes compared to non‐carriers across diagnostic groups irrespective of race, although effects of genotype were not significant for any particular brain tissue compartment; (3) risk carriers showed some localized brain size‐corrected increases in laminar thickness in frontal, sensorimotor and occipital cortex that survived permutation testing in Caucasian subjects only; however, (4) highly significant interactions between diagnostic group and DTNBP1 risk status were observed in wide areas of cortex within Caucasians and across racial categories, where (5) follow‐up analyses of simple effects revealed that schizophrenia patients who are DTNBP1 risk carriers exhibit regional cortical thinning in distributed brain regions including temporal cortices, but healthy subjects who are risk carriers show some regional increases in cortical thickness.
Since carriers of the DTNBP1 risk allele showed significantly smaller whole brain volumes compared to non‐carriers, but did not vary significantly in gray matter, white matter or CSF volume, results suggest the affects of genotype are not specific to a particular tissue class. In contrast, main effects of schizophrenia were absent for overall brain volumes, but were observed for brain size‐adjusted gray matter and CSF volumes suggesting that different disease‐related genetic or environmental factors account for global gray matter reductions and CSF enlargements widely observed in the disorder [Shenton et al., 2001]. Even so, disease processes accounting for gray matter deficits in schizophrenia may overlap with those associated with DTNBP1 risk factors at a more local level. Since the thickness of the cortex reflects the size, density, and arrangement of neurons, neuroglia and nerve fibers, cortical thickness may more closely relate to disturbances in neural function and may point to systems‐level changes in morphology potentially associated with specific genetic factors. Indeed, cortical thickness averaged across the cortex did not associate with overall brain volume, although was strongly associated with gray matter and white matter volume as expected. These findings are in line with prior imaging [Im et al., 2008] and postmortem findings [Pakkenberg and Gundersen, 1997] showing that brain size and cortical thickness do not scale proportionately, where brain size is more strongly associated with cortical surface area and convolution. It is thus plausible that brain size and cortical thickness are structural imaging phenotypes influenced by different neurobiological processes although gray and white matter volumes share some overlapping variance with both measures and cortical thickness relationships may vary at the regional level. Understanding the nature of the relationships between these measures may explain the differential influences of DTNBP1 risk on overall brain volume and regional changes in cortical thickness observed in this study.
In cortical thickness analyses, schizophrenia patients showed regional thinning in bilateral sensorimotor and heteromodal association cortices encompassing frontal, temporal and parietal cortical regions with respect to healthy subjects (Fig. 2). These results are similar to those documented in an overlapping sample of first‐episode schizophrenia patients [Narr et al., 2005a, b] and to findings observed in chronic schizophrenia [Kuperberg et al., 2003], with the exclusion of sensorimotor cortex. Notwithstanding, a study of early onset schizophrenia reported prominent gray matter changes encompassing sensorimotor cortices that were shown to progress to relatively widespread areas of cortex across development [Thompson et al., 2001b]. Only a spatially discrete area within the vicinity of gyrus rectus showed increased thickness in patients. Since a prior longitudinal voxel‐based study of gray matter density showed progressive gray matter decline in bilateral temporal and right frontal and parietal regions in subjects with high genetic risk of developing schizophrenia while healthy subjects showed gray matter reductions within the gyrus rectus only, it is possible that normal developmental processes affecting the gyrus rectus specifically may be delayed in schizophrenia [Job et al., 2005]. Few studies have addressed whether regional changes of laminar thickness may represent intermediate markers of genetic predisposition in schizophrenia. One study showed prominent gray matter deficits in left prefrontal, bilateral temporal cortices and more subtle effects in right prefrontal and inferior parietal cortices in nonpsychotic siblings of early onset patients that were shown to attenuate with age [Gogtay et al., 2007]. Another study utilizing an automated parcellation method showed reversed hemispheric asymmetry of cingulate thickness and a bilateral reduction of superior temporal sulcal thickness in healthy relatives (siblings and parents) of schizophrenia patients compared to controls [Goghari et al., 2007]. These studies and others examining gray matter volume or density [Cannon et al., 1998, 2002] suggest that gray matter changes are influenced by schizophrenia‐related genetic factors, particularly in frontal and temporal regions. However, interactions of genetic factors with the timing of neurodevelopmental processes [Gogtay et al., 2007] and environmental factors including exposure to antipsychotic medication [Dorph‐Petersen et al., 2005] may additionally act to affect changes of brain morphology in the disorder.
Since patients with schizophrenia show significant cortical thinning over large areas of cortex and the DTNBP1 risk allele has been associated with schizophrenia in previous studies, we predicted that risk carriers would exhibit regional reductions in cortical thickness. Contrary to our expectations, DTNBP1 risk status was associated with increased thickness while decreases were subtle and only present in small, non‐localized clusters (Fig. 4). However, highly significant and broadly spread interactions were observed between the DTNBP1 variant and diagnosis in Caucasians and across all races (Fig. 4). Subsequent analyses of the effects of genotype within each diagnostic group showed that the DTNBP1 risk‐allele associates with some discrete increases of cortical thickness in healthy subjects, but is associated with regional thinning patients with schizophrenia, particularly in temporal cortices in Caucasians. These findings suggest that the DTNBP1 risk allele may be protective in controls, but contribute towards reductions of laminar thickness in particular brain systems in patients with schizophrenia. This argument, although speculative, may help explain why from an evolutionary standpoint schizophrenia risk genes are protected to a degree from natural selection. Available data suggest that multiple genes account for the heritability of schizophrenia [Harrison and Weinberger, 2005; Sullivan et al., 2003]. Observations that the DTNBP1 risk allele associates differently with cortical thickness in patients than in healthy subjects may also suggest the presence of epistatic effects. That is, the effect of DTNBP1 risk on cortical thickness may depend on additional genetic factors conferring genetic risk for schizophrenia contributing to regional gray matter deficits in patients but not in healthy individuals who carry the DTNBP1 risk allele. Altered DTNBP1 expression has been documented in schizophrenia postmortem data [Talbot et al., 2004; Weickert et al., 2004, 2008]. DTNBP1 expression is influenced by cis‐acting variation at the DTNBP1 locus. However, a polymorphic trans‐acting locus on chromosome 8p, which contains the widely implicated schizophrenia risk gene neuregulin‐1 (NRG1), is also suggested to affect DTNBP1 expression [Bray et al., 2008]. These findings could thus support the hypothesis that a genetic interaction may account for the differential effects of the DTNBP1 risk allele on cortical thickness in schizophrenia patients and controls. It is also possible that genetic risk may interact with environmental factors to contribute to regional gray matter deficits in patients but not in healthy subjects. Alternatively, DTNBP1 may control other neurobiological processes that pose some risk for schizophrenia. Thus individuals who by virtue of these other genetic factors have a thicker cortex may be less vulnerable to the DTNBP1 effect, while those with thinner cortices are more vulnerable.
DTNBP1 associates with cognitive function at the phenotypic level. Notably, a large genome‐wide study investigating the genetic contributors of intelligence showed linkage with chromosomal regions encompassing DTNBP1 (6p22.3–6p25.3) in healthy subjects [Posthuma et al., 2005]. DTNBP1 variants and/or haplotypes are further reported to associate with level of educational achievement in schizophrenia [Williams et al., 2004], with cognitive ability in both schizophrenia and healthy individuals [Burdick et al., 2006, 2007], and with intelligence in unaffected siblings of schizophrenia patients [Zinkstok et al., 2007]. Brain size and intelligence are highly heritable [Baare et al., 2001a; Posthuma et al., 2002; Thompson et al., 2001a; Tramo et al., 1998] and are demonstrated to be modestly related [McDaniel, 2005; Narr et al., 2007]. Since overlapping genes appear to influence both phenotypes, it is possible that the main effect of the DTNBP1 risk allele on overall brain size also relates to general intellectual ability.
There are several limitations to the current study. Firstly, statistical power issues may have obscured the detection of more subtle regional effects of DTNBP1 risk status across and within groups. Moreover, small cell sizes precluded us from examining homozygote carriers of the DTNBP1 risk allele separately where effects may be more pronounced. Secondly, different risk and protective haplotypes and SNPs have been implicated across prior studies that could be influenced by ethnic background. Although the DTNBP1 marker examined in this study has shown associations with schizophrenia in studies including Caucasian, Hispanic, and Asian subjects [Funke et al., 2004; Tang et al., 2003; Tosato et al., 2007; Van Den Bogaert et al., 2003], this variant has not been associated with schizophrenia in African American samples specifically [Duan et al., 2007; Funke et al., 2004] although only three studies to our knowledge focused on this minority group [Duan et al., 2007; Funke et al., 2004; Pedrosa et al., 2007]. Unfortunately small cell sizes again precluded the analysis of DTNBP1 risk status within all ethnic groups separately. Thirdly, we did not examine other implicated DTNBP1 single or multi‐marker variants in this investigation, but instead focused on one marker that has been implicated in several prior schizophrenia association studies [Funke et al., 2004; Tang et al., 2003; Tosato et al., 2007; Van Den Bogaert et al., 2003] and that has shown relationships with general intellectual ability [Burdick et al., 2006, 2007]. However, even in spite of the potential complications of population stratification, available information suggests that linkage disequilibrium likely exists between the variant examined in this study and other implicated DTNBP1 risk markers [Bray et al., 2005]. However, it is possible that more than one DTNBP1 liability variant exists or that the actual variant conferring risk for schizophrenia has not yet been isolated [Riley and Kendler, 2006]. These questions can potentially be addressed by future studies as new information concerning DTNBP1 risk factors for schizophrenia become available. Finally, it is necessary to note that some recent larger scale studies suggest that DTNBP1 does not account for a large measurable portion of the genetic risk for schizophrenia [Peters et al., 2008; Sanders et al., 2008].
CONCLUSION
In spite of some controversy concerning the role of DTNBP1 in the heritability of schizophrenia, our results suggest that DTNBP1 risk factors are linked with brain morphology in general and with regional changes in cortical thickness that differ between diagnostic groups. Localized cortical thinning in patient risk carriers, but not in control carriers, may suggest the interactions of other genetic factors or protective affects of the risk allele in controls and/or in individuals with thicker cortex. However, schizophrenia‐associated cortical thinning in widely distributed neocortical areas is clearly also under the control of additional genetic and/or harmful environmental variables. Although the biological mechanisms underlying DTNBP1–brain morphometry relationships are not clear, our findings complement observations of genotype–neurocognitive relationships to further suggest DTNBP1 susceptibility variants affect overall brain size and specific cortical networks in schizophrenia.
REFERENCES
- Andreasen NC ( 1984): The Scale for the Assessment of Negative Symptoms (SANS). Iowa City, IA: University of Iowa College. [Google Scholar]
- Anderson MJ, Legendre P ( 1999): An empirical comparison of permutation methods for tests of partial regression coefficients in a linear model. J Statist Comput Simul 62: 271–303. [Google Scholar]
- Anderson MJ, ter Braak CJF ( 2003): Permutation tests for multi‐factorial analysis of variance. J Statist Comput Simul 73: 85–113. [Google Scholar]
- Baare WF, Hulshoff Pol HE, Boomsma DI, Posthuma D, de Geus EJ, Schnack HG, van Haren NE, van Oel CJ, Kahn RS ( 2001a): Quantitative genetic modeling of variation in human brain morphology. Cereb Cortex 11: 816–824. [DOI] [PubMed] [Google Scholar]
- Baare WF, van Oel CJ, Hulshoff Pol HE, Schnack HG, Durston S, Sitskoorn MM, Kahn RS. ( 2001b): Volumes of brain structures in twins discordant for schizophrenia. Arch Gen Psychiatry 58: 33–40. [DOI] [PubMed] [Google Scholar]
- Bearden CE, van Erp TG, Thompson PM, Toga AW, Cannon TD ( 2007): Cortical mapping of genotype–phenotype relationships in schizophrenia. Hum Brain Mapp 28: 519–532. [DOI] [PMC free article] [PubMed] [Google Scholar]
- Bray NJ, Preece A, Williams NM, Moskvina V, Buckland PR, Owen MJ, O'Donovan MC, O'Donovan MC ( 2005): Haplotypes at the dystrobrevin binding protein 1 (DTNBP1) gene locus mediate risk for schizophrenia through reduced DTNBP1 expression. Hum Mol Genet 14: 1947–1954. [DOI] [PubMed] [Google Scholar]
- Bray NJ, Holmans PA, van den Bree MB, Jones L, Elliston LA, Hughes G, Richards AL, Williams NM, Craddock N, Owen MJ, O'Donovan MC ( 2008): Cis‐ and trans‐ loci influence expression of the schizophrenia susceptibility gene DTNBP1. Hum Mol Genet 17: 1169–1174. [DOI] [PubMed] [Google Scholar]
- Burdick KE, Lencz T, Funke B, Finn CT, Szeszko PR, Kane JM, Kucherlapati R, Malhotra AK ( 2006): Genetic variation in DTNBP1 influences general cognitive ability. Hum Mol Genet 15: 1563–1568. [DOI] [PubMed] [Google Scholar]
- Burdick KE, Goldberg TE, Funke B, Bates JA, Lencz T, Kucherlapati R, Malhotra AK ( 2007): DTNBP1 genotype influences cognitive decline in schizophrenia. Schizophr Res 89: 169–172. [DOI] [PMC free article] [PubMed] [Google Scholar]
- Cannon TD, van Erp TGM, Huttunen M, Loennqvist J, Salonen O, Valanne L, Poutanen VP, Standertskjoeld‐Nordenstam CG, Gur RE, Yan M ( 1998): Regional grey matter, white matter, and cerebrospinal fluid distributions in schizophrenic patients, their siblings, and controls. Arch Gen Psychiatry 55: 1084–1091. [DOI] [PubMed] [Google Scholar]
- Cannon TD, Thompson PM, van Erp TG, Toga AW, Poutanen VP, Huttunen M, Lonnqvist J, Standerskjold‐Nordenstam CG, Narr KL, Khaledy M, Zoumalan CI, Dail R, Kaprio J ( 2002): Cortex mapping reveals regionally specific patterns of genetic and disease‐specific gray‐matter deficits in twins discordant for schizophrenia. Proc Natl Acad Sci USA 99: 3228–3233. [DOI] [PMC free article] [PubMed] [Google Scholar]
- Cannon TD, Hennah W, van Erp TG, Thompson PM, Lonnqvist J, Huttunen M, Gasperoni T, Tuulio‐Henriksson A, Pirkola T, Toga AW, Kaprio J, Mazziotta J, Peltonen L ( 2005): Association of DISC1/TRAX haplotypes with schizophrenia, reduced prefrontal gray matter, and impaired short‐ and long‐term memory. Arch Gen Psychiatry 62: 1205–1213. [DOI] [PubMed] [Google Scholar]
- Clinton SM, Meador‐Woodruff JH ( 2004): Thalamic dysfunction in schizophrenia: Neurochemical, neuropathological, and in vivo imaging abnormalities. Schizophr Res 69: 237–253. [DOI] [PubMed] [Google Scholar]
- Donohoe G, Morris DW, Clarke S, McGhee KA, Schwaiger S, Nangle JM, Garavan H, Robertson IH, Gill M, Corvin A ( 2007): Variance in neurocognitive performance is associated with dysbindin‐1 in schizophrenia: A preliminary study. Neuropsychologia 45: 454–458. [DOI] [PubMed] [Google Scholar]
- Donohoe G, Morris DW, De Sanctis P, Magno E, Montesi JL, Garavan HP, Robertson IH, Javitt DC, Gill M, Corvin AP, Foxe JJ( 2008): Early visual processing deficits in dysbindin‐associated schizophrenia. Biol Psychiatry 63: 484–489. [DOI] [PubMed] [Google Scholar]
- Dorph‐Petersen KA, Pierri JN, Perel JM, Sun Z, Sampson AR, Lewis DA ( 2005): The influence of chronic exposure to antipsychotic medications on brain size before and after tissue fixation: A comparison of haloperidol and olanzapine in macaque monkeys. Neuropsychopharmacology 30: 1649–1661. [DOI] [PubMed] [Google Scholar]
- Duan J, Martinez M, Sanders AR, Hou C, Burrell GJ, Krasner AJ, Schwartz DB, Gejman PV ( 2007): DTNBP1 (Dystrobrevin binding protein 1) and schizophrenia: Association evidence in the 3′ end of the gene. Hum Hered 64: 97–106. [DOI] [PMC free article] [PubMed] [Google Scholar]
- Endicott J, Spitzer RL ( 1978): A diagnostic interview: The schedule for affective disorders and schizophrenia. Arch Gen Psychiatry 35: 837–844. [DOI] [PubMed] [Google Scholar]
- Fallgatter AJ, Herrmann MJ, Hohoff C, Ehlis AC, Jarczok TA, Freitag CM, Deckert J ( 2006): DTNBP1 (dysbindin) gene variants modulate prefrontal brain function in healthy individuals. Neuropsychopharmacology 31: 2002–2010. [DOI] [PubMed] [Google Scholar]
- First MB, Spitzer RL, Gibbon M, Williams JBW ( 1997): Structured Clinical Interview for DSM‐IV Axis I Disorders, patient edition. New York, NY: State Psychiatric Institute. [Google Scholar]
- Funke B, Finn CT, Plocik AM, Lake S, DeRosse P, Kane JM, Kucherlapati R, Malhotra AK ( 2004): Association of the DTNBP1 locus with schizophrenia in a U.S. population. Am J Hum Genet 75: 891–898. [DOI] [PMC free article] [PubMed] [Google Scholar]
- Glahn DC, Thompson PM, Blangero J ( 2007): Neuroimaging endophenotypes: Strategies for finding genes influencing brain structure and function. Hum Brain Mapp 28: 488–501. [DOI] [PMC free article] [PubMed] [Google Scholar]
- Goghari VM, Rehm K, Carter CS, MacDonald AW III ( 2007): Regionally specific cortical thinning and gray matter abnormalities in the healthy relatives of schizophrenia patients. Cereb Cortex 17: 415–424. [DOI] [PubMed] [Google Scholar]
- Gogtay N, Greenstein D, Lenane M, Clasen L, Sharp W, Gochman P, Butler P, Evans A, Rapoport J ( 2007): Cortical brain development in nonpsychotic siblings of patients with childhood‐onset schizophrenia. Arch Gen Psychiatry 64: 772–780. [DOI] [PubMed] [Google Scholar]
- Harrison PJ, Weinberger DR ( 2005): Schizophrenia genes, gene expression, and neuropathology: On the matter of their convergence. Mol Psychiatry 10: 40–68. [DOI] [PubMed] [Google Scholar]
- Honea R, Crow TJ, Passingham D, Mackay CE ( 2005): Regional deficits in brain volume in schizophrenia: A meta‐analysis of voxel‐based morphometry studies. Am J Psychiatry 162: 2233–2245. [DOI] [PubMed] [Google Scholar]
- Im K, Lee JM, Lyttelton O, Kim SH, Evans AC, Kim SI ( 2008): Brain size and cortical structure in the adult human brain. Cereb Cortex 18: 2181–2191. [DOI] [PubMed] [Google Scholar]
- International HapMap Consortium ( 2005): A haplotype map of the human genome. Nature 437: 1299–1320. [DOI] [PMC free article] [PubMed] [Google Scholar]
- Job DE, Whalley HC, Johnstone EC, Lawrie SM ( 2005): Grey matter changes over time in high risk subjects developing schizophrenia. Neuroimage 25: 1023–1030. [DOI] [PubMed] [Google Scholar]
- Kuperberg GR, Broome MR, McGuire PK, David AS, Eddy M, Ozawa F, Goff D, West WC, Williams SC, van der Kouwe AJ, Salat DH, Dale AM, Fischl B ( 2003): Regionally localized thinning of the cerebral cortex in schizophrenia. Arch Gen Psychiatry 60: 878–888. [DOI] [PubMed] [Google Scholar]
- Li D, He L ( 2007): Association study between the dystrobrevin binding protein 1 gene (DTNBP1) and schizophrenia: A meta‐analysis. Schizophr Res 96: 112–118. [DOI] [PubMed] [Google Scholar]
- MacDonald D, Avis D, Evans AC ( 1994): Multiple surface identification and matching in magnetic resonance imaging. Proc SPIE 2359: 160–169. [Google Scholar]
- Mamah D, Wang L, Barch D, de Erausquin GA, Gado M, Csernansky JG ( 2007): Structural analysis of the basal ganglia in schizophrenia. Schizophr Res 89: 59–71. [DOI] [PMC free article] [PubMed] [Google Scholar]
- McDaniel. ( 2005): Big‐brained people are smarter: A meta‐analysis of the relationship between in vivo brain volume and intelligence. Intelligence 33: 337–346. [Google Scholar]
- Mutsuddi M, Morris DW, Waggoner SG, Daly MJ, Scolnick EM, Sklar P ( 2006): Analysis of high‐resolution HapMap of DTNBP1 (Dysbindin) suggests no consistency between reported common variant associations and schizophrenia. Am J Hum Genet 79: 903–909. [DOI] [PMC free article] [PubMed] [Google Scholar]
- Narr KL, van Erp TG, Cannon TD, Woods RP, Thompson PM, Jang S, Blanton R, Poutanen VP, Huttunen M, Lonnqvist J, Standerksjold‐Nordenstam CG, Kaprio J, Mazziotta JC, Toga AW ( 2002): A twin study of genetic contributions to hippocampal morphology in schizophrenia. Neurobiol Dis 11: 83–95. [DOI] [PubMed] [Google Scholar]
- Narr KL, Bilder RM, Toga AW, Woods RP, Rex DE, Szeszko PR, Robinson D, Sevy S, Gunduz‐Bruce H, Wang YP, DeLuca H, Thompson PM ( 2005a): Mapping cortical thickness and gray matter concentration in first episode schizophrenia. Cereb Cortex 15: 708–719. [DOI] [PubMed] [Google Scholar]
- Narr KL, Toga AW, Szeszko P, Thompson PM, Woods RP, Robinson D, Sevy S, Wang Y, Schrock K, Bilder RM. ( 2005b): Cortical thinning in cingulate and occipital cortices in first episode schizophrenia. Biol Psychiatry 58: 32–40. [DOI] [PubMed] [Google Scholar]
- Narr KL, Woods RP, Thompson PM, Szeszko P, Robinson D, Dimtcheva T, Gurbani M, Toga AW, Bilder RM ( 2007): Relationships between IQ and regional cortical gray matter thickness in healthy adults. Cereb Cortex 17: 2163–2171. [DOI] [PubMed] [Google Scholar]
- Norton N, Williams HJ, Owen MJ ( 2006): An update on the genetics of schizophrenia. Curr Opin Psychiatry 19: 158–164. [DOI] [PubMed] [Google Scholar]
- Numakawa T, Yagasaki Y, Ishimoto T, Okada T, Suzuki T, Iwata N, Ozaki N, Taguchi T, Tatsumi M, Kamijima K, Straub RE, Weinberger DR, Kunugi H, Hashimoto R ( 2004): Evidence of novel neuronal functions of dysbindin, a susceptibility gene for schizophrenia. Hum Mol Genet 13: 2699–2708. [DOI] [PubMed] [Google Scholar]
- Ohnishi T, Hashimoto R, Mori T, Nemoto K, Moriguchi Y, Iida H, Noguchi H, Nakabayashi T, Hori H, Ohmori M, Tsukue R, Anami K, Hirabayashi N, Harada S, Arima K, Saitoh O, Kunugi H ( 2006): The association between the Val158Met polymorphism of the catechol‐O‐methyl transferase gene and morphological abnormalities of the brain in chronic schizophrenia. Brain 129 ( Part 2): 399–410. [DOI] [PubMed] [Google Scholar]
- Pakkenberg B, Gundersen HJ ( 1997): Neocortical neuron number in humans: Effect of sex and age. J Comp Neurol 384: 312–320. [PubMed] [Google Scholar]
- Pearlson GD ( 2000): Neurobiology of schizophrenia. Ann Neurol 48: 556–566. [PubMed] [Google Scholar]
- Pedrosa E, Ye K, Nolan KA, Morrell L, Okun JM, Persky AD, Saito T, Lachman HM ( 2007): Positive association of schizophrenia to JARID2 gene. Am J Med Genet B Neuropsychiatry Genet 144B: 45–51. [DOI] [PubMed] [Google Scholar]
- Peters K, Wiltshire S, Henders AK, Dragovic M, Badcock JC, Chandler D, Howell S, Ellis C, Bouwer S, Montgomery GW, Palmer LJ, Kalaydjieva L, Jablensky A ( 2008): Comprehensive analysis of tagging sequence variants in DTNBP1 shows no association with schizophrenia or with its composite neurocognitive endophenotypes. Am J Med Genet B Neuropsychiatry Genet 147B: 1159–1166. [DOI] [PubMed] [Google Scholar]
- Posthuma D, De Geus EJ, Baare WF, Hulshoff Pol HE, Kahn RS, Boomsma DI ( 2002): The association between brain volume and intelligence is of genetic origin. Nat Neurosci 5: 83–84. [DOI] [PubMed] [Google Scholar]
- Posthuma D, Luciano M, Geus EJ, Wright MJ, Slagboom PE, Montgomery GW, Boomsma DI, Martin NG ( 2005): A genomewide scan for intelligence identifies quantitative trait loci on 2q and 6p. Am J Hum Genet 77: 318–326. [DOI] [PMC free article] [PubMed] [Google Scholar]
- Rajkowska G, Selemon LD, Goldman‐Rakic PS ( 1998): Neuronal and glial somal size in the prefrontal cortex: A postmortem morphometric study of schizophrenia and Huntington disease. Arch Gen Psychiatry 55: 215–224. [DOI] [PubMed] [Google Scholar]
- Riley B, Kendler KS ( 2006): Molecular genetic studies of schizophrenia. Eur J Hum Genet 14: 669–680. [DOI] [PubMed] [Google Scholar]
- Sanders AR, Duan J, Levinson DF, Shi J, He D, Hou C, Burrell GJ, Rice JP, Nertney DA, Olincy A, Rozic P, Vinogradov S, Buccola NG, Mowry BJ, Freedman R, Amin F, Black DW, Silverman JM, Byerley WF, Crowe RR, Cloninger CR, Martinez M, Gejman PV ( 2008): No significant association of 14 candidate genes with schizophrenia in a large European ancestry sample: Implications for psychiatric genetics. Am J Psychiatry 165: 497–506. [DOI] [PubMed] [Google Scholar]
- Seidman LJ, Pantelis C, Keshavan MS, Faraone SV, Goldstein JM, Horton NJ, Makris N, Falkai P, Caviness VS, Tsuang MT ( 2003): A review and new report of medial temporal lobe dysfunction as a vulnerability indicator for schizophrenia: A magnetic resonance imaging morphometric family study of the parahippocampal gyrus. Schizophr Bull 29: 803–830. [DOI] [PubMed] [Google Scholar]
- Selemon LD, Goldman‐Rakic PS ( 1999): The reduced neuropil hypothesis: A circuit based model of schizophrenia. Biol Psychiatry 45: 17–25. [DOI] [PubMed] [Google Scholar]
- Selemon LD, Mrzljak J, Kleinman JE, Herman MM, Goldman‐Rakic PS ( 2003): Regional specificity in the neuropathologic substrates of schizophrenia: A morphometric analysis of Broca's area 44 and area 9. Arch Gen Psychiatry 60: 69–77. [DOI] [PubMed] [Google Scholar]
- Shattuck DW, Sandor‐Leahy SR, Schaper KA, Rottenberg DA, Leahy RM ( 2001): Magnetic resonance image tissue classification using a partial volume model. Neuroimage 13: 856–876. [DOI] [PubMed] [Google Scholar]
- Shenton ME, Dickey CC, Frumin M, McCarley RW ( 2001): A review of MRI findings in schizophrenia. Schizophr Res 49: 1–52. [DOI] [PMC free article] [PubMed] [Google Scholar]
- Sled JG, Pike GB ( 1998): Standing‐wave and RF penetration artifacts caused by elliptic geometry: An electrodynamic analysis of MRI. IEEE Transactions on Medical Imaging 17: 653–662. [DOI] [PubMed] [Google Scholar]
- Straub RE, Jiang Y, MacLean CJ, Ma Y, Webb BT, Myakishev MV, Harris‐Kerr C, Wormley B, Sadek H, Kadambi B, Cesare AJ, Gibberman A, Wang X, O'Neill FA, Walsh D, Kendler KS ( 2002): Genetic variation in the 6p22.3 gene DTNBP1, the human ortholog of the mouse dysbindin gene, is associated with schizophrenia. Am J Hum Genet 71: 337–348. [DOI] [PMC free article] [PubMed] [Google Scholar]
- Sullivan PF, Kendler KS, Neale MC ( 2003): Schizophrenia as a complex trait: Evidence from a meta‐analysis of twin studies. Arch Gen Psychiatry 60: 1187–1192. [DOI] [PubMed] [Google Scholar]
- Takao K, Toyama K, Nakanishi K, Hattori S, Takamura H, Takeda M, Miyakawa T, Hashimoto R ( 2008): Impaired long‐term memory retention and working memory in sdy mutant mice with a deletion in Dtnbp1, a susceptibility gene for schizophrenia. Mol Brain 1: 11. [DOI] [PMC free article] [PubMed] [Google Scholar]
- Talbot K, Eidem WL, Tinsley CL, Benson MA, Thompson EW, Smith RJ, Hahn CG, Siegel SJ, Trojanowski JQ, Gur RE, Blake DJ, Arnold SE ( 2004): Dysbindin‐1 is reduced in intrinsic, glutamatergic terminals of the hippocampal formation in schizophrenia. J Clin Invest 113: 1353–1363. [DOI] [PMC free article] [PubMed] [Google Scholar]
- Tang JX, Zhou J, Fan JB, Li XW, Shi YY, Gu NF, Feng GY, Xing YL, Shi JG, He L ( 2003): Family‐based association study of DTNBP1 in 6p22.3 and schizophrenia. Mol Psychiatry 8: 717–718. [DOI] [PubMed] [Google Scholar]
- Thompson PM, Woods RP, Mega MS, Toga AW ( 2000): Mathematical/computational challenges in creating deformable and probabilistic atlases of the human brain. Hum Brain Mapp 9: 81–92. [DOI] [PMC free article] [PubMed] [Google Scholar]
- Thompson PM, Cannon TD, Narr KL, van Erp T, Poutanen VP, Huttunen M, Lonnqvist J, Standertskjold‐Nordenstam CG, Kaprio J, Khaledy M, Dail R, Zoumalan CI, Toga AW ( 2001a): Genetic influences on brain structure. Nat Neurosci 4: 1253–1258. [DOI] [PubMed] [Google Scholar]
- Thompson PM, Vidal C, Giedd JN, Gochman P, Blumenthal J, Nicolson R, Toga AW, Rapoport JL ( 2001b): Mapping adolescent brain change reveals dynamic wave of accelerated gray matter loss in very early‐onset schizophrenia. Proc Natl Acad Sci USA 98: 11650–11655. [DOI] [PMC free article] [PubMed] [Google Scholar]
- Thompson PM, Hayashi KM, Sowell ER, Gogtay N, Giedd JN, Rapoport JL, de Zubicaray GI, Janke AL, Rose SE, Semple J, Doddrell DM, Wang Y, van Erp TG, Cannon TD, Toga AW ( 2004): Mapping cortical change in Alzheimer's disease, brain development, and schizophrenia. Neuroimage 23 ( Suppl 1) S2–S18. [DOI] [PubMed] [Google Scholar]
- Tochigi M, Zhang X, Ohashi J, Hibino H, Otowa T, Rogers M, Kato T, Okazaki Y, Kato N, Tokunaga K, Sasaki T ( 2006): Association study of the dysbindin (DTNBP1) gene in schizophrenia from the Japanese population. Neurosci Res 56: 154–158. [DOI] [PubMed] [Google Scholar]
- Tosato S, Ruggeri M, Bonetto C, Bertani M, Marrella G, Lasalvia A, Cristofalo D, Aprili G, Tansella M, Dazzan P, Diforti M, Murray RM, Collier DA ( 2007): Association study of dysbindin gene with clinical and outcome measures in a representative cohort of Italian schizophrenic patients. Am J Med Genet B Neuropsychiatry Genet 144: 647–659. [DOI] [PubMed] [Google Scholar]
- Tramo MJ, Loftus WC, Stukel TA, Green RL, Weaver JB, Gazzaniga MS ( 1998): Brain size, head size, and intelligence quotient in monozygotic twins. Neurology 50: 1246–1252. [DOI] [PubMed] [Google Scholar]
- Turunen JA, Peltonen JO, Pietilainen OP, Hennah W, Loukola A, Paunio T, Silander K, Ekelund J, Varilo T, Partonen T, Lonnqvist J, Peltonen L ( 2007): The role of DTNBP1, NRG1, and AKT1 in the genetics of schizophrenia in Finland Schizophr Res 91: 27–36. [DOI] [PubMed] [Google Scholar]
- Van Den Bogaert A, Schumacher J, Schulze TG, Otte AC, Ohlraun S, Kovalenko S, Becker T, Freudenberg J, Jonsson EG, Mattila‐Evenden M, Sedvall GC, Czerski PM, Kapelski P, Hauser J, Maier W, Rietschel M, Propping P, Nothen MM, Cichon S ( 2003): The DTNBP1 (dysbindin) gene contributes to schizophrenia, depending on family history of the disease. Am J Hum Genet 73: 1438–1443. [DOI] [PMC free article] [PubMed] [Google Scholar]
- Vilella E, Costas J, Sanjuan J, Guitart M, De Diego Y, Carracedo A, Martorell L, Valero J, Labad A, De Frutos R, Najera C, Molto MD, Toirac I, Guillamat R, Brunet A, Valles V, Perez L, Leon M, de Fonseca FR, Phillips C, Torres M ( 2008): Association of schizophrenia with DTNBP1 but not with DAO, DAOA, NRG1 and RGS4 nor their genetic interaction J Psychiatry Res 42: 278–288. [DOI] [PubMed] [Google Scholar]
- Weickert CS, Straub RE, McClintock BW, Matsumoto M, Hashimoto R, Hyde TM, Herman MM, Weinberger DR, Kleinman JE ( 2004): Human dysbindin (DTNBP1) gene expression in normal brain and in schizophrenic prefrontal cortex and midbrain. Arch Gen Psychiatry 61: 544–555. [DOI] [PubMed] [Google Scholar]
- Weickert CS, Rothmond DA, Hyde TM, Kleinman JE, Straub RE ( 2008): Reduced DTNBP1 (dysbindin‐1) mRNA in the hippocampal formation of schizophrenia patients. Schizophr Res 98: 105–110. [DOI] [PMC free article] [PubMed] [Google Scholar]
- Williams NM, Preece A, Morris DW, Spurlock G, Bray NJ, Stephens M, Norton N, Williams H, Clement M, Dwyer S, Curran C, Wilkinson J, Moskvina V, Waddington JL, Gill M, Corvin AP, Zammit S, Kirov G, Owen MJ, O'Donovan MC ( 2004): Identification in 2 independent samples of a novel schizophrenia risk haplotype of the dystrobrevin binding protein gene (DTNBP1). Arch Gen Psychiatry 61: 336–344. [DOI] [PubMed] [Google Scholar]
- Zinkstok JR, de Wilde O, van Amelsvoort TA, Tanck MW, Baas F, Linszen DH ( 2007): Association between the DTNBP1 gene and intelligence: A case‐control study in young patients with schizophrenia and related disorders and unaffected siblings. Behav Brain Funct 3, 19. [DOI] [PMC free article] [PubMed] [Google Scholar]