

Abstract
The ability to stimulate mammalian cells with light has significantly changed our understanding of electrically excitable tissues in health and disease, paving the way toward various novel therapeutic applications. Here, we demonstrate the potential of optogenetic control in cardiac cells using a hybrid experimental/computational technique. Experimentally, we introduced channelrhodopsin-2 into undifferentiated human embryonic stem cells via a lentiviral vector, and sorted and expanded the genetically engineered cells. Via directed differentiation, we created channelrhodopsin-expressing cardiomyocytes, which we subjected to optical stimulation. To quantify the impact of photostimulation, we assessed electrical, biochemical, and mechanical signals using patch-clamping, multielectrode array recordings, and video microscopy. Computationally, we introduced channelrhodopsin-2 into a classic autorhythmic cardiac cell model via an additional photocurrent governed by a light-sensitive gating variable. Upon optical stimulation, the channel opens and allows sodium ions to enter the cell, inducing a fast upstroke of the transmembrane potential. We calibrated the channelrhodopsin-expressing cell model using single action potential readings for different photostimulation amplitudes, pulse widths, and frequencies. To illustrate the potential of the proposed approach, we virtually injected channelrhodopsin-expressing cells into different locations of a human heart, and explored its activation sequences upon optical stimulation. Our experimentally calibrated computational toolbox allows us to virtually probe landscapes of process parameters, and identify optimal photostimulation sequences toward pacing hearts with light.
Introduction
For more than 40 years, biologists have studied microorganisms that produce proteins to directly regulate the flow of charged ions across their plasma membrane in response to light. The first identified protein of this kind was the light-gated ion pump bacteriorhodopsin, transporting positively charged hydrogen ions across the cell membrane (1). While bacteriorhodopsin naturally acts as an on-switch for electrically active cells, the second reported light-gated ion pump, halorhodopsin, transports negatively charged chloride ions, thereby acting as an off-switch (2). The first reported light-gated ionic channel illustrated in Fig. 1, channelrhodopsin, was only identified 30 years later (3,4), but has since revolutionized neuroscience.
Figure 1.
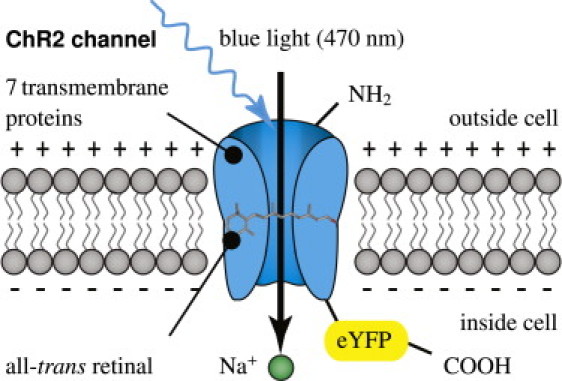
Channelrhodopsin-2 (ChR2) is a light-gated cation channel native to the green alga C. reinhardtii. It consists of seven transmembrane proteins and absorbs light through its interaction with retinal. Here, we induce channelrhodopsin coupled to enhanced yellow fluorescent protein (eYFP) into undifferentiated human embryonic stem cells via a lentiviral vector and differentiate these cells into cardiomyocytes.
Since the early 1990s, we have known that phototaxis and photophobic responses in the green alga Chlamydomonas reinhardtii are mediated by rhodopsins with a microbial-type all-trans retinal chromosphore (5,6). The photochemical isomerization of this all-trans retinal to 13-cis retinal is illustrated in Fig. 2. It occurs at peak absorption wavelengths of 470 nm, opening the channel to sodium, potassium, and calcium cations in response to blue light. In the dark, the covalently bound retinal spontaneously relaxes to all-trans, providing closure of the channel and regeneration of the chromophore.
Figure 2.
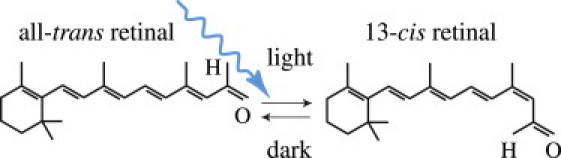
Channelrhodopsin-2 (ChR2) is activated by photoisomerization of all-trans retinal to 13-cis retinal at wavelengths of 470 nm. After photoisomerization, the covalently bound retinal spontaneously relaxes to all-trans in the dark, providing closure of the ion channel and regeneration of the chromophore.
A breakthrough-enabling technology was reported in 2005, when the light-sensitive target was first introduced genetically using engineered viruses (7,8), a technique that is now known as optogenetics (9,10). Since then, optical tools for controlling the electrical activity of neurons have rapidly evolved, and are now gaining widespread use in neuronal research and medicine (11,12). Although initial applications of optogenetics have been restricted exclusively to the neuronal system, optogenetic tools have now advanced to a level of maturity, where they can confidently be applied to other cells and organs (9). Natural first candidates of choice are stem cells, and electrically active glial cells, muscle cells, and cardiac cells (O. Abilez, J. A. Baugh, M. L. Gorrepati, R. Prakash, C. Lee-Messer, M. Huang, F. Jia, J. Yu, K. D. Wilson, J. C. Wu, K. Deisseroth, and C. K. Zarins, unpublished; and (14)).
The objective of this study is to demonstrate the potential of optogenetic control of the cardiac system using a hybrid experimental/computational technique. We demonstrate that channelrhodopsin-2 (ChR2) can be expressed stably and safely in human embryonic stem cells (hESC), which can then be differentiated into cardiomyocytes (hESCChR2-CM). Upon photostimulation, ChR2 opens rapidly and allows sodium ions to enter the cell, inducing a defined transmembrane potential, commonly known as the action potential. We illustrate how ChR2 can be introduced into a computational autorhythmic cell model via an additional photocurrent governed by a light-sensitive gating variable to simulate this effect. The calibrated cell model is capable of reliably reproducing photostimulation amplitudes, pulse widths, and frequencies from single action potential readings. Using a custom-designed finite element model, we virtually inject our calibrated model cells into different locations of a human heart to illustrate the potential of the proposed approach toward pacing hearts with light.
Materials and Methods
All experiments, methods, and protocols for this study were approved by the Stanford University Stem Cell Research Oversight committee.
Opsin sources and lentiviral vector
The channelrhodopsin-2 (ChR2) variant described here was optimized for mammalian expression by truncating the native sequence from 2241 basepair (bp) to 933 bp, by changing the native histidine (H) codon (CAC) to the arginine (R) codon (CGC) coding for protein residue 134 of ChR2 (H134R), and by changing its gene's codon usage to conform to human codon usage distribution (15,16). The lentiviral vector pLenti-EF1α-ChR2-eYFP-WPRE (pLECYT) was constructed as previously described (7,16). The pLET plasmid contains the ubiquitously expressed elongation factor 1-alpha (EF1α), to obtain high levels of ChR2-eYFP expression in a mammalian system ((8), O. Abilez, J. A. Baugh, M. L. Gorrepati, R. Prakash, C. Lee-Messer, M. Huang, F. Jia, J. Yu, K. D. Wilson, J. C. Wu, K. Deisseroth, and C. K. Zarins, unpublished). All constructs have been fully sequenced previously for accuracy of cloning (7,15). High-titer lentivirus was produced using a second-generation lentiviral system by cotransfection of 293FT cells (Invitrogen, Carlsbad, CA), the pLECYT viral vector described above, pCMVRΔ8.74 (containing GAG and POL), pMD2.G (containing VSVg), and calcium phosphate as previously described (16,17).
Stem cell culture and differentiation
Channelrhodopsin-expressing human embryonic stem cells (hESCChR2+) were grown as monolayers (O. Abilez, J. A. Baugh, M. L. Gorrepati, R. Prakash, C. Lee-Messer, M. Huang, F. Jia, J. Yu, K. D. Wilson, J. C. Wu, K. Deisseroth, and C. K. Zarins, unpublished) on hESC-qualified Matrigel (BD Biosciences, San Jose, CA) and maintained in the pluripotent state through daily feeding with mTeSR1 media (StemCell Technologies, Vancouver, British Columbia, Canada) (18), supplemented with 1× penicillin/streptomycin (Invitrogen). Cardiomyocyte differentiation was usually begun 2–5 days after initially seeding hESCChR2+ on Matrigel (BD Biosciences). At this time, the cells were transferred to RPMI-1640 media supplemented with B27, 1× nonessential amino acids, 1× penicillin/streptomycin, and 0.1 mM β-mercaptoethanol (all Invitrogen) and our differentiation method was begun using aspects of other methods previously described (19,20).
On the first day of differentiation, Day 0, RPMI media with 50 ng/mL of Activin A (R&D Systems, Minneapolis, MN) was added to each well. On the subsequent day, Day 1, 5 ng/mL of BMP-4 (R&D Systems) was added to each well. On Day 3, fresh RPMI media was added to each well and was replaced every 48 h until Day 11, when the cells were transferred to Dulbecco's modified Eagle's medium (DMEM) (Invitrogen) supplemented with 5% fetal bovine serum (Invitrogen), 1× nonessential amino acids, 1× penicillin/streptomycin, and 0.1 mM β-mercaptoethanol. This DMEM was then replaced approximately every 48 h. Cardiomyocytes generally began spontaneously beating between Days 9 and 20.
Fluorescence-activated cell sorting
Fluorescence-activated cell sorting (FACS) was performed with a BD FACSAria instrument equipped with BD FACSDiva 6.0 software (BD Biosciences). Up to 1 × 10⁶ cells transduced with the ChR2-eYFP lentivirus were sorted. Sorted cells were then resuspended in mTeSR1 media and replated on Matrigel-coated wells. After 2–3 days in culture, enhanced yellow fluorescent protein (eYFP) signal was confirmed via fluorescence microscopy. Analysis of FACS data was performed offline with FlowJo 7.6.1 software (Tree Star, Ashland, OR).
Polymerase chain reaction
For undifferentiated hESC, polymerase chain reaction (PCR) primers with gene product length for the following genes were used: GAPDH (152 bp), Oct-4 (169 bp), Nanog (154 bp), a region within eYFP (187 bp), a region spanning eYFP-ChR2 (197 bp), and a region within ChR2 (174 bp). Total RNA was isolated and RNA yield was then quantified using a Quant-iT kit (Invitrogen) and Qubit fluorometer (Invitrogen) per the manufacturer's instructions. For cDNA synthesis, 1 μg total RNA, random hexamers, annealing buffer, 2× First-Strand Reaction Mix (Invitrogen) and SuperScript III/RNase OUT Enzyme Mix (Invitrogen), and RNase/DNase-free water were combined, then incubated per the manufacturers instructions. For PCR amplification, AccuPrime Pfx SuperMix (Invitrogen), custom primers for pluripotency markers as described above, and cDNA were combined. Nontemplate control reactions were prepared by substituting cDNA with distilled water. Samples were transferred to a thermal cycler and the following cycling program was used: 1), initial denaturation at 95°C for 2 min; 2), 30 cycles of 95°C for 30 s, 60°C for 30 s, and 68°C for 1 min; and 3), final extension at 68°C for 5 min.
Finally, PCR products, a 100-bp ladder (Invitrogen), and nontemplate control reactions were loaded in separate wells of a 2% agarose E-gel with SYBR-Safe (Invitrogen) and run for 30 min. Bands were then visualized with an E-gel iBase blue-light transilluminator (Invitrogen).
Immunocytochemistry
Human-embryonic-stem-cell-derived cardiomyocytes (hESC-CMs) were labeled with primary antibodies for the cardiac markers α-actinin (IgG, 1:500; Sigma, St. Louis, MO) and troponin I (TnI) (IgG, 1:200; Millipore, Billerica, MA). The secondary antibody used was goat anti-mouse IgG-Alexa 594 (1:1000; Invitrogen) for both α-actinin and TnI. Cells were counterstained with 4′,6-diamidino-2-phenylindole (DAPI, Sigma) for 10 min. An AxioObserver Z1 (Carl Zeiss, Göttingen, Germany) inverted microscope was used to visualize hESC-CMs. The Zeiss microscope was equipped with a Lambda DG-4 300 W Xenon light source (Sutter Instruments, Novato, CA), an ORCA-ER charge-coupled device camera (Hamamatsu, Bridgewater, NJ), and AxioVison 4.7 software (Zeiss).
Optical stimulation
Optical stimulation was delivered to hESC-CMs via a Lambda DG-4 300 W Xenon light source (Sutter Instruments) or with a 470 nm LED at 7 mW/mm2 (Thorlabs, Newton, NJ). For multielectrode array (MEA) electrophysiology, optical stimulation consisted of a monophasic waveform with peak amplitude of 0, 33, 75, or 100% of maximum power (10 mW/mm2 for 40× objective), pulse width of 100 ms, and frequency of 0.5, 1.0, or 1.5 Hz. For whole-cell patch-clamp electrophysiology, optical stimulation consisted of a monophasic waveform with peak amplitude of 0, 12.5, 25, 50, or 100% of maximum power (10 mW/mm2 for 40× objective) and a pulse width of 1000 ms. Optical power delivered to cells at each microscope objective was measured with a digital power meter (Thorlabs) at the focal plane of the objective.
Multielectrode array electrophysiology
Multielectrode arrays (MEA) with sixty 30-μm titanium nitride electrodes equally spaced 200-μm apart, with indium tin oxide leads, and with an internal reference (Thin MEA 200/30 iR indium tin oxide; MultiChannel Systems, Reutlingen, Germany) were coated with 25 μg/mL fibronectin (Sigma). Desired cardiomyocyte (CM) colonies were then manually dissected off their plates, transferred to the MEAs, and allowed to attach. A single MEA containing cells and Tyrode's solution (Sigma) was then placed in the amplifier (MEA 1060-Inv-BC; MultiChannel Systems) for recordings. Signals were acquired at 1 kHz from a USB-6225 M Series DAQ (National Instruments, Austin, TX). Videos of contracting CM were captured at 30 fps for a duration of 1–30 s with a Retiga 2000R Color Cooled Camera (QImaging, Surrey, British Columbia, CA). The MEA amplifier was configured with MEA Select 1.1.0 software (MultiChannel Systems) and electrical and video signals were acquired and controlled with a custom program created with LabVIEW 2009 (National Instruments). To visualize hESC-CM contractions, a custom edge detection algorithm in LabVIEW 2009 (National Instruments) was used to detect rising and falling edge locations along a grayscale profile generated from a user-defined region of interest based on a user-defined threshold value.
Patch-clamp electrophysiology
hESC-CMs were recorded by means of whole-cell patch-clamp, using an Axon Multiclamp 700B amplifier (Molecular Devices, Sunnyvale, CA), an Axon Digidata 1440A data acquisition system (Molecular Devices), and pClamp 10 software (Molecular Devices) as previously described (15,21). Cells were visualized and optically stimulated on an Olympus upright microscope equipped with a 470 nm LED (Thorlabs) and EXFO X-Cite halogen light source (Lumen Dynamics, Mississauga, Ontario, Canada) through a 40×/0.8 NA water immersion objective. When using the halogen light source coupled to a shutter (VCM-D1; Uniblitz, Rochester, NY), an excitation filter of HQ470/40, dichroic Q495LP (Chroma Technology, Bellows Falls, VT) was used for delivering blue light for ChR2 activation (10, 5, 2.5, 1.25 mW/mm2). eYFP was visualized with a standard eYFP filter set (excitation 500/20, dichroic 515LP, emission 535/30; Chroma Technology). Borosilicate glass (Sutter Instruments) pipette resistance ranged from 3 to 6 MΩ.
Whole-cell patch-clamp recordings were performed as previously described (15), using the intracellular solution: 129 mM K-gluconate, 10 mM HEPES, 10 mM KCl, 4 mM MgATP, 0.3 mM NaGTP, titrated to pH 7.2; and extracellular Tyrode's solution: 125 mM NaCl, 2 mM KCl, 3 mM CaCl2, 1 mM MgCl2, 30 mM glucose, and 25 mM HEPES, titrated to pH 7.3. For voltage-clamp recordings, cells were held at −70 mV. All experiments were performed at room temperature, 22–25°C. Fluorescent cells were patched immersed in Tyrode's solution containing 5–10 μM blebbistatin to eliminate contractility while preserving electrical activity (22). Patch-clamp data were analyzed using ClampFit 10.2 (Molecular Devices).
Mathematical model of channelrhodopsin photocycle
To model the channelrhodopsin photocycle, we adopt a three-state photocycle model (23,24), which is characterized through an open, a closed but still recovering, and a fully closed state (4), as illustrated in Fig. 3. Upon photoabsorption, molecules that are in the closed state gc undergo a fast transition into the open state gChR2. After being open for some time, molecules spontaneously transition into the recovering state gr, where the ion channels are closed, but the molecules are not yet ready to photoswitch again. After a recovery period, the molecules finally return to the closed state gc, ready to undergo a new photocycle when exposed to light (25). Fig. 3 suggests the following first-order model for the channelrhodopsin photocycle:
| (1) |
Here Γr and Γc are the rates of recovery and full closure, ɛ is the quantum efficiency of the channelrhodopsin system, and npho is the number of photons hitting the cell per second. Herein, gChR2, gr, and gc define the fraction of molecules in the open, recovering, and closed states, scaled such that they sum up to one, gChR2 + gr + gc = 1. This implies that the photocycle system (Eq. 1) can be characterized through two independent variables, e.g., the fraction of molecules in the open and in the recovering states:
| (2) |
We identify the state gChR2 as the channelrhodopsin gating variable and integrate it into a well-defined autorhythmic cell model (26) characterized through ngate = 10 gating variables in total as illustrated in Fig. 4:
| (3) |
These are the fast sodium channel activation gate gm, the fast sodium channel inactivation gate gh, the channelrhodopsin activation gate gChR2, the hyperpolarization activated inward current activation gate gy, the delayed rectifier current activation gate gx, the long-lasting calcium channel activation gate gdL, the voltage-dependent long-lasting calcium channel inactivation gate gfL, the calcium-dependent long-lasting calcium channel inactivation gate gfCa, the transient calcium channel activation gate gdT, and the transient calcium channel inactivation gate gfT. The gating variables are parameterized in terms of the transmembrane potential ϕ, the ionic concentrations cion, and the gating variables ggate themselves. Their evolution is governed by classic Hodgkin-Huxley type equations,
| (4) |
each characterized through a steady-state value g∞gate and a time constant τgate for reaching this steady state (27). Both are usually exponential functions of the transmembrane potential ϕ.
Figure 3.
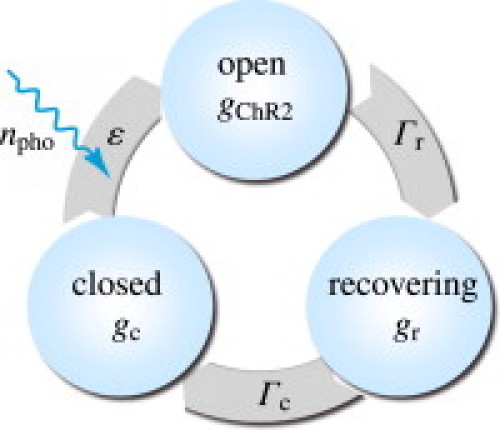
Three-state model for the channelrhodopsin photocycle. Upon photoabsorption, molecules in the closed state gc undergo a fast transition into the open state gChR2. After for some time, molecules spontaneously turn into the recovering state gr where the ion channels are closed, but the molecules are not yet ready to photoswitch again. After a recovery period, the molecules finally return to the closed state gc, ready to undergo a new photocycle when subjected to light.
Figure 4.
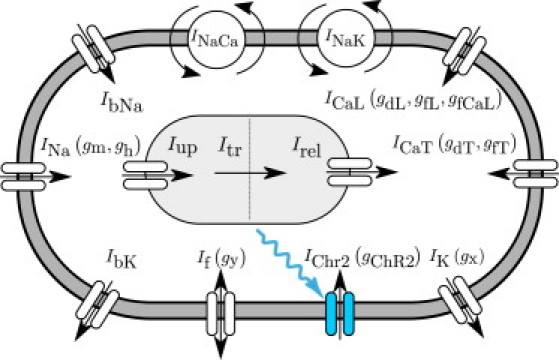
Ionic model of genetically engineered light sensitive cardiac cell. The electrochemical state of the cell is characterized in terms of nion = 8 ion concentrations, cion = [ceNa, ceK, ceCa, ciNa, ciK, ciCa, cupCa, crelCa], the extracellular and intracellular sodium, potassium, and calcium concentrations, and the sarcoplasmic reticulum calcium uptake and release. Ion concentrations are controlled through ncrt = 12 ionic currents, Icrt = [INa, IbNa, If, INaCa, INaK, IChR2, IK, IbK, ICaL, ICaT, Iup, Irel], where the baseline autorhythmic cell model (26) has been enhanced with the channelrhodopsin current IChR2 (shown in blue). The channels are governed by ngate = 10 gating variables ggate = [gm, gh, gChR2, gy, gx, gdL, gfL, gfCa, gdT, gfT], which may be functions of the current membrane potential ϕ.
Mathematical model of ionic currents
The channelrhodopsin gating variable gChR2 introduced in the previous section governs the channelrhodopsin current IChR2, for which we make the following Ansatz:
| (5) |
Here, CChR2 is the channelrhodopsin conductance and ϕChR2 is the reversal potential of channelrhodopsin (see the Supporting Material). We integrate the channelrhodopsin current IChR2 into an autorhythmic cardiac cell model (26,28), defined through a total of ncrt = 12 ionic currents,
| (6) |
which are, mathematically speaking, functions of the transmembrane potential ϕ, the individual gating variables ggate, and the ion concentrations cion:
| (7) |
These 12 ionic currents consist of 10 transmembrane currents, i.e., the fast sodium current INa, the background sodium current IbNa, the hyperpolarization-activated sodium and potassium currents If, the sodium calcium exchanger current INaCa, the sodium potassium pump current INaK, the channelrhodopsin sodium current IChR2, the delayed rectifying potassium current IK, the background potassium current IbK, the long-lasting L-type calcium current ICaL, and the transient T-type calcium current ICaT, and two sarcoplasmic reticulum currents, i.e., the calcium uptake Iup and the calcium release Irel.
Mathematical model of ionic concentrations
From a chemical point of view, light induces a channelrhodopsin current IChR2, which directly impacts the intracellular sodium concentrations ciNa,
| (8) |
where Vi is the cytosolic volume and F is the Faraday constant. The sodium concentration will directly, and indirectly through the resulting changes in the transmembrane potential ϕ, affect all other ionic concentrations in the cell. The biochemistry of our cell model is characterized through nion = 8 ion concentrations,
| (9) |
defined in terms of their evolution equations,
| (10) |
which are parameterized in terms of the transmembrane potential ϕ, the gating variables ggate, and the ion concentrations cion themselves. In particular, ceNa, ceK, and ceCa are the extracellular sodium, potassium, and calcium concentrations; ciNa, ciK, and ciCa are the intracellular sodium, potassium, and calcium concentrations; and cupCa and crelCa are the sarcoplasmic reticulum calcium uptake and release (see the Supporting Material for details about the cell model and its material parameters).
Mathematical model of action potential propagation
From an electrical point of view, light induces a channelrhodopsin current IChR2, which directly impacts the action potential propagation ϕ in the heart. Unlike the local ion concentrations for single cells, however, the action potential is a global field variable (29). Its spatiotemporal evolution
| (11) |
is driven by a local source term fϕ at the single cell level, and by a global flux term, div q, the divergence of the propagation vector q at the organ level. The local source term
| (12) |
is directly related to the negative sum of all transmembrane currents scaled by the individual cell membrane capacitance per unit surface area C. To account for the nonlocal nature of propagating excitation waves in the heart, we introduce the propagation vector
| (13) |
through the second-order diffusion tensor D scaling the gradient of the action potential field ∇ϕ (see the Supporting Material for the finite-element-based solution of the action potential propagation problem, and see (27,29,30)).
Results
Fig. 5 demonstrates our ability to stably transduce undifferentiated hESC with a ChR2-eYFP lentiviral vector. The resulting hESCChR2+ remain pluripotent and can differentiate into hESCChR2+-CM. In Fig. 5 a, the PCR shows that hESCChR2+ express the pluripotent Oct-4 gene (169 bp, lane 4) and Nanog gene (154 bp, lane 5) (blue box). In addition, amplification within the ChR2 gene (174 bp, lane 6), across the ChR2-eYFP gene (197 bp, lane 7), and within the eYFP gene (187 bp, lane 8), confirms stable transduction of the ChR2-eYFP lentivirus in undifferentiated hESCChR2+ (yellow box). A ladder (100 bp, lane 1) confirms the predicted sizes of PCR products. Nontemplate control (lane 2) and GAPDH (152 bp, lane 3) serve as negative and positive controls, respectively. Fig. 5 b illustrates that pluripotent hESCChR2+ is stain-positive for alkaline phosphatase (red). Fig. 5 c demonstrates the hESCChR2+ positive eYFP signal upon fluorescence microscopy (green). Fig. 5 d confirms that hESCChR2+-CM have positive TnI signals (red), consistent with a CM phenotype. DAPI staining (blue), demonstrates the position of nuclei. Fig. 5 e illustrates transmission electron microscopy of hESCChR2+-CM showing sarcomeres with characteristic z-lines and mitochondria. Fig. 5 f shows the light microscopy of three hESCChR2+-CM colonies (dashed white circles) on a multielectrode array.
Figure 5.
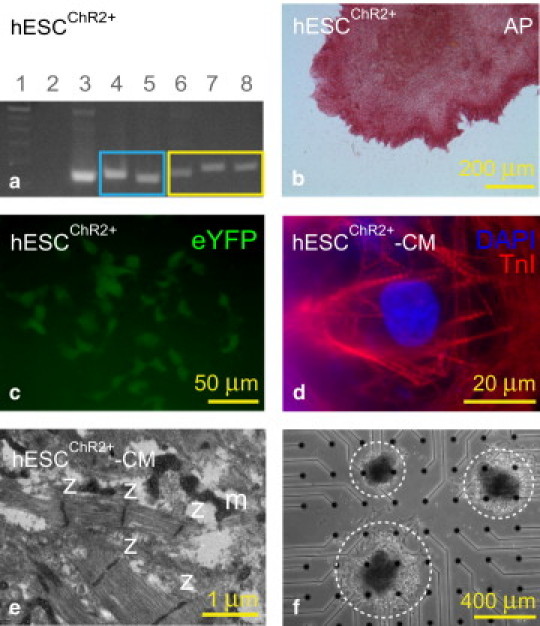
Undifferentiated human embryonic stem cells (hESC) stably transduced with a ChR2-eYFP lentiviral vector (hESCChR2+) remain pluripotent and can differentiate into cardiomyocytes (hESCChR2+-CM). (a) PCR shows that hESC ChR2+ express the pluripotent Oct-4 gene (169 bp, lane 4) and Nanog gene (154 bp, lane 5) (blue box). In addition, amplification within the ChR2 gene (174 bp, lane 6), across the ChR2-eYFP gene (197 bp, lane 7), and within the eYFP gene (187 bp, lane 8), confirms stable transduction of the ChR2-eYFP lentivirus in undifferentiated hESCChR2+ (yellow box). A ladder (100 bp, lane 1) confirms the predicted sizes of PCR products. Nontemplate control (lane 2) and GAPDH (152 bp, lane 3) serve as negative and positive controls, respectively. (b) Pluripotent hESCChR2+ stain is positive for alkaline phosphatase (red). (c) Fluorescence microscopy shows hESCChR2+ has a positive eYFP signal (green). (d) hESCChR2+-CM have positive TnI signals (red), consistent with a CM phenotype. DAPI staining (blue) demonstrates the position of nuclei. (e) Transmission electron microscopy shows sarcomeres with associated z-lines (z) and mitochondria (m) in hESCChR2+-CM. (f) Light microscopy shows three hESCChR2+-CM colonies (dashed white circles) on a multielectrode array.
Fig. 6 demonstrates the experimental and computational sensitivity of hESCChR2-CM with respect to different light intensities. With light on, the photocurrent IChR2 increases rapidly, peaks, and decays toward a characteristic plateau value. With light off, the photocurrent IChR2 drops rapidly and decays to zero. Fig. 6 (top) illustrates the varying light intensities from 12.5% to 25%, 50%, and 100% for which we measure the photocurrent IChR2 upon whole-cell voltage-clamp. Fig. 6 (middle) demonstrates the experimentally measured photocurrent IChR2, which increases with increasing light intensity. Fig. 6 (bottom) shows the calibrated computational cell model that captures the characteristic light sensitivity, displaying increased photocurrents IChR2 with increased light intensity (see the Supporting Material).
Figure 6.
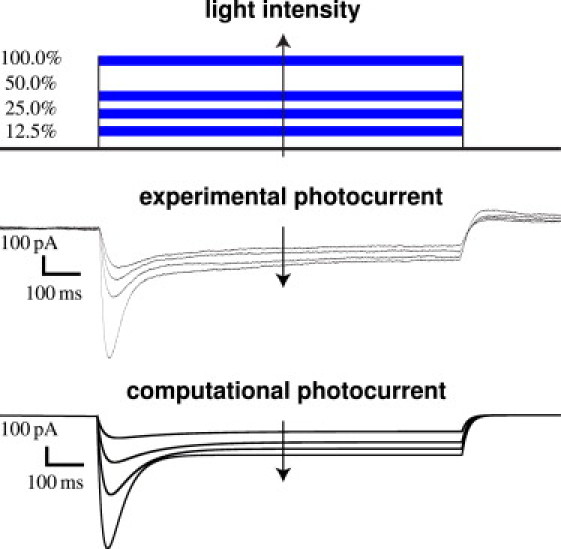
Experimental and computational sensitivity of hESCChR2-CM with respect to light intensity. With light on, the photocurrent IChR2 increases rapidly, peaks, and decays toward a characteristic plateau value. With light off, the photocurrent IChR2 drops rapidly and decays to zero. Light intensity is varied from 12.5% to 25%, 50%, and 100% (top). Whole-cell voltage-clamp reveals an increased photocurrent IChR2 as the light intensity increases (middle). The computational hESCChR2-CM model captures the light sensitivity and displays increased photocurrents IChR2 with increased light intensity (bottom).
Fig. 7 demonstrates the experimental and computational sensitivity of hESCChR2-CM with respect to different stimulation frequencies. Applied light stimulation at 100% intensity is illustrated (blue lines) at 100-ms pulse width. Experimentally measured electrical field potentials and mechanical contractions (black and red lines) and computationally predicted electrical transmembrane potentials are indicated (green lines). We probe the cells with light stimulation at 0.5 Hz (Fig. 7, top), 1.0 Hz (Fig. 7, middle), and 1.5 Hz (Fig. 7, bottom). Electrical and mechanical signals during light stimulation, shown in the center, are significantly different from pre- and poststimulation signals at all frequencies, shown at the beginning and end of the readings. The computational hESCChR2-CM model excellently captures the electrical signal both during light stimulation, and pre- and poststimulation. The two initial double spikes (see green curves) of the computational model paced at 0.5 Hz are caused by an interference of the photostimulation with the cell's natural frequency of 0.7 Hz. This interference is only present when cells are paced below their natural frequency, and does not occur during photostimulation at 1.0 Hz and 1.5 Hz.
Figure 7.
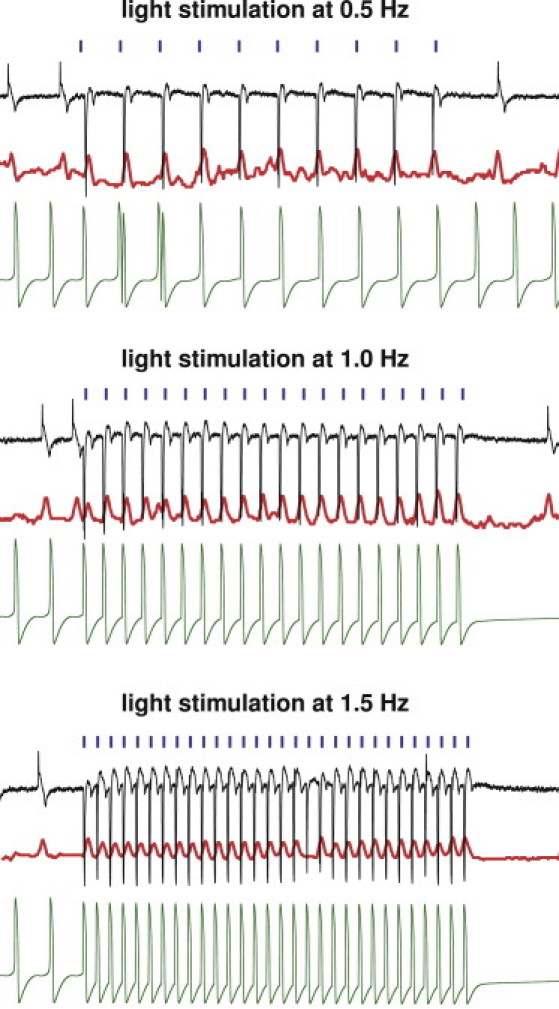
Experimental and computational sensitivity of hESCChR2-CM with respect to stimulation frequency. Light stimulation (blue) evokes field potentials (black) that translate into mechanical contractions (red). Light stimulation at 100% intensity is performed at 0.5 Hz (top), 1.0 Hz (middle), and 1.5 Hz (bottom). Evoked signals during light stimulation (center) are markedly different from pre- and poststimulation signals at all frequencies (left and right). The computational hESCChR2-CM model (green) captures the electrical signal at all frequencies, both during light stimulation (center), and pre- and poststimulation (left and right).
Fig. 8 illustrates the potential of the proposed technology to virtually pace a human heart with light. The finite element model of the heart created from magnetic resonance images consists of 3129 nodes and 11,347 three-dimensional tetrahedral elements (31) (see the Supporting Material). Fig. 8 (top) shows the effects of atrioventricular (AV) node photostimulation initiated through hESCChR2-CM, which are virtually injected into the basal region of the septum, whereas all other regions are modeled as standard ventricular CM. For AV node pacing, the depolarization wave is initiated at the AV node, travels down the septum, and then activates the left and right ventricles. Fig. 8 (bottom) shows the effects of biventricular photostimulation, initiated through hESCChR2-CM, which are virtually injected into the lateral wall of the left and right ventricles, whereas all other regions are modeled as standard ventricular CM. For biventricular photostimulation, the depolarization wave is initiated at the lateral left and right ventricular walls, travels along the ventricles, and then activates the apex and the septum. The color code indicates the magnitude of the transmembrane potential varying from −90 mV (blue) to +20 mV (red).
Figure 8.
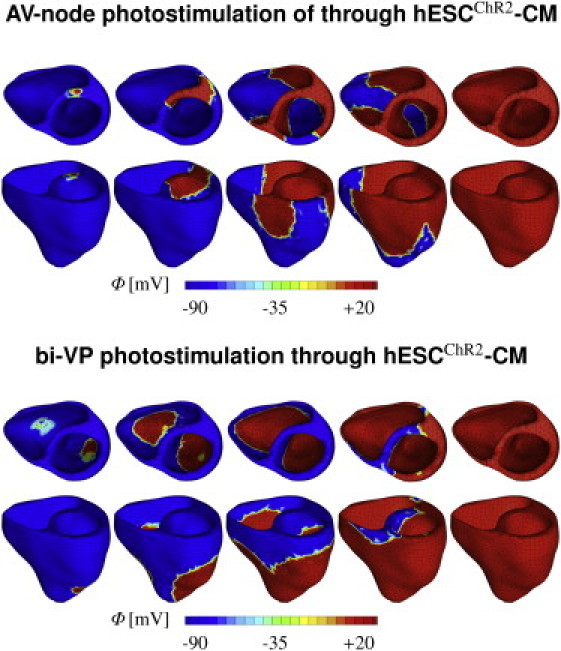
Virtual activation sequences of light-paced hearts. Atrioventricular node (top) and biventricular (bottom) photosimulations are initiated through hESCChR2-CM, virtually injected into the basal septum and into both lateral walls, respectively. All other regions are modeled as standard ventricular CM. The color code indicates the magnitude of the transmembrane potential ϕ varying from −90 mV (blue) to +20 mV (red).
Discussion
In Fig. 5, we have shown that ChR2 can be expressed stably and safely in hESC-CM to drive CM depolarization via photostimulation. Using a lentiviral vector (7,16), we have introduced ChR2 coupled to YFP into undifferentiated hESC. After confirming expression via immunocytochemistry, we have expanded these ChR2-expressing cells and demonstrated their pluripotency using PCR. Via directed differentiation, we have created hESCChR2-CM, which we have then subjected to optical stimulation. We have successfully recorded their electrical, biochemical, and mechanical signals using patch-clamping, MEA recordings, and video microscopy. These data have allowed us to calibrate our computational hESCChR2-CM model.
In Fig. 6, we have demonstrated the sensitivity of both experimental and computational photocurrents with respect to the stimulating light intensity (25). Both graphs illustrate the characteristic rapid increase to the intensity-dependent peak current, followed by a slower decrease toward the intensity-dependent asymptotic plateau value (32,33).
Although the translation of optogenetic techniques into clinical practice may still have many technical hurdles to pass, the technology itself can already serve as a valuable research tool in cardiac electrophysiology. Traditional tools based on the simultaneous use of electrical stimulation and electrical recording typically suffer from unavoidable artifacts (34). The inherent orthogonality of optical and electrical techniques allows us to significantly reduce these spurious errors when using optical stimulation combined with electrical recordings, as shown in Fig. 7.
A tremendous potential of opsin-based systems for optical manipulation lies in their inherent ability to not only turn-cells-on using channelrhodopsin as a blue-light-gated ion channel transporting positively charged cations along their concentration gradients (9), but also to turn-cells-off using halorhodopsin as a yellow-light-driving ion pump transporting negatively charged chloride ions against their concentration gradients (10). A promising first study in zebrafish has shown that a combination of channelrhodopsin and halorhodopsin allows for optically controlling heart rate, reversing cardiac conduction, and inducing diseaselike arrhythmias (14).
Computational modeling allows us to predict the response of living cells, both in isolation and in interaction with their environment. In Fig. 8, we have demonstrated our very first proof-of-principle, using finite element modeling in an attempt to bridge the scales from cells to systems (35). Finite-element-based models allow us to combine virtually any cell type (36) on virtually any geometry (37). Here, they allow us to predict the activation sequences in the human heart for different pacing sites (38).
Pacing hearts in silico by means of photostimulation will allow us to virtually probe different scenarios (39,40) toward our ultimate goal of light pacing hearts in vivo (14). In contrast to electrical pacemakers, light delivery is minimally invasive, genetically targeted, and temporally precise. Most importantly, light can be delivered at a distance. Unlike pacing leads for electrical stimulation, which are known to have a high failure rate due to mechanical fatigue (41), the light source for optical stimulation does not have to sit directly on the continuously moving heart muscle. Light pacing might therefore be an attractive remote, less invasive, and more durable alternative to current electrical pacing leads (42).
Limitations
This study presents our first attempts toward pacing the heart with light using a multiscale approach. On the photocycle level (4), we have adapted a classic three-state model for the ChR2 photocycle, which was initially proposed for ChR2-expressing neurons. This conceptually elegant model has allowed us to reliably reproduce the characteristic features of a light-evoked response in ChR2-expressing hESC-CM. However, the extension to a four-state (24) or five-state (43) model, either of which is known to reproduce the biexponential decay of the light-off current more accurately (23), is conceptually straightforward. In terms of photostimulation, we have applied pulse widths of 100 and 1000 ms. These relatively long durations of channel opening may increase sodium overload and adversely influence action potential profiles. Because the rapid upstroke of the action potential takes place in the first 10 ms (26), the stimulation pulse width could potentially be decreased to 10 ms or less (O. Abilez, J. A. Baugh, M. L. Gorrepati, R. Prakash, C. Lee-Messer, M. Huang, F. Jia, J. Yu, K. D. Wilson, J. C. Wu, K. Deisseroth, and C. K. Zarins, unpublished), which would favorably limit light exposure time (see the Supporting Material). Novel developments in ultrafast optogenetics suggest using the rationally engineered channelrhodopsin ChETA, which provides high-fidelity optical control of spiking at high frequencies and eliminates plateau potentials during continued stimulation (44).
On the ion channel level, we have assumed that the ChR2 current is driven exclusively by concentration gradients in the sodium concentration (24). Accordingly, we have modeled ChR2 to be selectively permeable to sodium ions only. Although ChR2 is known to be a general cation channel (12), its effects on potassium and calcium remain poorly characterized (45). However, making the channel permeable to other monovalent and divalent cations (4), would require only modular changes in the mathematical model.
On the cellular level, due to the lack of mathematical models for stem cell-derived cardiac cells, we have adopted a widely used and well-characterized model for mature cardiac cells (26,28). A recent study confirmed that ChR2 expresses its characteristic features independent of the particular expression system (45). Therefore, we have modified the mature cell model via an additional photocurrent governed by a light-sensitive gating variable. A thorough identification of the individual channel characteristics of hESC-CM and their quantitative comparison with mature CM and hESCChR2+-CM remain to be addressed to fully validate our conceptual approach (21).
On the whole-heart level, the simulation of the light-paced heart is admittedly relatively simplistic. Although our algorithm can, in principle, handle arbitrary mixtures of different cell types (36), here, we have assumed that the injected cells are pure hESCChR2+-CM. We have adopted a common procedure to model cell injection (37), which does not address additional obstacles commonly associated with cell delivery such as cell migration away from the injection site or cell survival in the myocardial wall. At this stage, our model also fails to appropriately predict the effects of light scattering by tissue and absorption by blood. Light scattering is a general barrier to in vivo translation, and efforts are underway by our groups and others to red-shift the opsins and maximize the efficiency of light delivery through tissues (15,46).
Conclusion
At an unprecedented temporal and spatial precision, optogenetic tools now enable us to manipulate electrically active cells. This study capitalizes on recent developments in optics and genetics, supplemented by novel technologies in stem cell biology, electrophysiology, and computational mechanics. It documents our first attempts to introduce a light-sensitive ion channel in human-embryonic-stem-cell-derived cardiomyocytes, with the ultimate goal to control the cardiac system by means of photostimulation. Unlike traditional electrical stimulation, optogenetics allows us to precisely control the selective permeability of the plasma membrane, its conductivity with respect to different ions, its sensitivity to light of different wavelengths, and the spatiotemporal evolution of different opening and closing profiles. Given this incredible freedom, we need to establish an economical strategy to optimize the matrix of input variables. Predictive computational models allow us to virtually probe landscapes of process parameters and identify optimal photostimulation sequences in various different tissues and organs. Here, as a very first proof-of-principle, we virtually inject photosensitive cells into different locations of a human heart model, and pace the heart with light. We believe that this concept will be widely applicable to systematically manipulate electrically active cells and, ultimately, support the design of novel therapies for various types of neuronal, musculoskeletal, pancreatic, and cardiac disorders such as depression, schizophrenia, cerebral palsy, paralysis, diabetes, pain syndromes, and cardiac arrhythmias.
Acknowledgments
We thank Joshua Baugh and Madhu Gorrepati for technical assistance.
This material was supported by the Stanford ARTS Fellowship to O.J.A., by the Stanford Graduate Fellowship to J.W., by National Science Foundation grant EFRI-CBE-0735551 and by California Institute for Regenerative Medicine No. RC1-00151 to C.K.Z., and by National Science Foundation CAREER Award CMMI-0952021 and National Institutes Health grant U54 GM072970 to E.K.
Footnotes
This is an Open Access article distributed under the terms of the Creative Commons-Attribution Noncommercial License (http://creativecommons.org/licenses/by-nc/2.0/), which permits unrestricted noncommercial use, distribution, and reproduction in any medium, provided the original work is properly cited.
Supporting Material
References
- 1.Oesterhelt D., Stoeckenius W. Rhodopsin-like protein from the purple membrane of Halobacterium halobium. Nat. New Biol. 1971;233:149–152. doi: 10.1038/newbio233149a0. [DOI] [PubMed] [Google Scholar]
- 2.Matsuno-Yagi A., Mukohata Y. Two possible roles of bacteriorhodopsin; a comparative study of strains of Halobacterium halobium differing in pigmentation. Biochem. Biophys. Res. Commun. 1977;78:237–243. doi: 10.1016/0006-291x(77)91245-1. [DOI] [PubMed] [Google Scholar]
- 3.Nagel G., Ollig D., Hegemann P. Channelrhodopsin-1: a light-gated proton channel in green algae. Science. 2002;296:2395–2398. doi: 10.1126/science.1072068. [DOI] [PubMed] [Google Scholar]
- 4.Nagel G., Szellas T., Bamberg E. Channelrhodopsin-2, a directly light-gated cation-selective membrane channel. Proc. Natl. Acad. Sci. USA. 2003;100:13940–13945. doi: 10.1073/pnas.1936192100. [DOI] [PMC free article] [PubMed] [Google Scholar]
- 5.Hegemann P., Gärtner W., Uhl R. All-trans retinal constitutes the functional chromophore in Chlamydomonas rhodopsin. Biophys. J. 1991;60:1477–1489. doi: 10.1016/S0006-3495(91)82183-X. [DOI] [PMC free article] [PubMed] [Google Scholar]
- 6.Lawson M.A., Zacks D.N., Spudich J.L. Retinal analog restoration of photophobic responses in a blind Chlamydomonas reinhardtii mutant. Evidence for an archaebacterial like chromophore in a eukaryotic rhodopsin. Biophys. J. 1991;60:1490–1498. doi: 10.1016/S0006-3495(91)82184-1. [DOI] [PMC free article] [PubMed] [Google Scholar]
- 7.Boyden E.S., Zhang F., Deisseroth K. Millisecond-timescale, genetically targeted optical control of neural activity. Nat. Neurosci. 2005;8:1263–1268. doi: 10.1038/nn1525. [DOI] [PubMed] [Google Scholar]
- 8.Zhang F., Wang L.P., Deisseroth K. Channelrhodopsin-2 and optical control of excitable cells. Nat. Methods. 2006;3:785–792. doi: 10.1038/nmeth936. [DOI] [PubMed] [Google Scholar]
- 9.Deisseroth K. Optogenetics. Nat. Methods. 2011;8:26–29. doi: 10.1038/nmeth.f.324. [DOI] [PMC free article] [PubMed] [Google Scholar]
- 10.Hegemann P., Möglich A. Channelrhodopsin engineering and exploration of new optogenetic tools. Nat. Methods. 2011;8:39–42. doi: 10.1038/nmeth.f.327. [DOI] [PubMed] [Google Scholar]
- 11.Lin J.Y., Lin M.Z., Tsien R.Y. Characterization of engineered channelrhodopsin variants with improved properties and kinetics. Biophys. J. 2009;96:1803–1814. doi: 10.1016/j.bpj.2008.11.034. [DOI] [PMC free article] [PubMed] [Google Scholar]
- 12.Szobota S., Isacoff E.Y. Optical control of neuronal activity. Annu. Rev. Biophys. 2010;39:329–348. doi: 10.1146/annurev.biophys.093008.131400. [DOI] [PMC free article] [PubMed] [Google Scholar]
- 14.Arrenberg A.B., Stainier D.Y.R., Huisken J. Optogenetic control of cardiac function. Science. 2010;330:971–974. doi: 10.1126/science.1195929. [DOI] [PubMed] [Google Scholar]
- 15.Gradinaru V., Zhang F., Deisseroth K. Molecular and cellular approaches for diversifying and extending optogenetics. Cell. 2010;141:154–165. doi: 10.1016/j.cell.2010.02.037. [DOI] [PMC free article] [PubMed] [Google Scholar]
- 16.Zhang F., Wang L.P., Deisseroth K. Multimodal fast optical interrogation of neural circuitry. Nature. 2007;446:633–639. doi: 10.1038/nature05744. [DOI] [PubMed] [Google Scholar]
- 17.Sena-Esteves M., Tebbets J.C., Flake A.W. Optimized large-scale production of high titer lentivirus vector pseudotypes. J. Virol. Methods. 2004;122:131–139. doi: 10.1016/j.jviromet.2004.08.017. [DOI] [PubMed] [Google Scholar]
- 18.Ludwig T.E., Bergendahl V., Thomson J.A. Feeder-independent culture of human embryonic stem cells. Nat. Methods. 2006;3:637–646. doi: 10.1038/nmeth902. [DOI] [PubMed] [Google Scholar]
- 19.Laflamme M.A., Chen K.Y., Murry C.E. Cardiomyocytes derived from human embryonic stem cells in pro-survival factors enhance function of infarcted rat hearts. Nat. Biotechnol. 2007;25:1015–1024. doi: 10.1038/nbt1327. [DOI] [PubMed] [Google Scholar]
- 20.Yang L., Soonpaa M.H., Keller G.M. Human cardiovascular progenitor cells develop from a KDR+ embryonic-stem-cell-derived population. Nature. 2008;453:524–528. doi: 10.1038/nature06894. [DOI] [PubMed] [Google Scholar]
- 21.Mummery C., Ward-van Oostwaard D., Tertoolen L. Differentiation of human embryonic stem cells to cardiomyocytes: role of co-culture with visceral endoderm-like cells. Circulation. 2003;107:2733–2740. doi: 10.1161/01.CIR.0000068356.38592.68. [DOI] [PubMed] [Google Scholar]
- 22.Fedorov V.V., Lozinsky I.T., Efimov I.R. Application of blebbistatin as an excitation-contraction uncoupler for electrophysiologic study of rat and rabbit hearts. Heart Rhythm. 2007;4:619–626. doi: 10.1016/j.hrthm.2006.12.047. [DOI] [PubMed] [Google Scholar]
- 23.Hegemann P., Ehlenbeck S., Gradmann D. Multiple photocycles of channelrhodopsin. Biophys. J. 2005;89:3911–3918. doi: 10.1529/biophysj.105.069716. [DOI] [PMC free article] [PubMed] [Google Scholar]
- 24.Nikolic K., Grossman N., Degenaar P. Photocycles of channelrhodopsin-2. Photochem. Photobiol. 2009;85:400–411. doi: 10.1111/j.1751-1097.2008.00460.x. [DOI] [PubMed] [Google Scholar]
- 25.Nikolic K., Degenaar P., Toumazou C. Modeling and engineering aspects of Channelrhodopsin2 system for neural photostimulation. Proc. 28th IEEE EMBS. 2006;40:1626–1629. doi: 10.1109/IEMBS.2006.260766. [DOI] [PubMed] [Google Scholar]
- 26.Dokos S., Celler B., Lovell N. Ion currents underlying sinoatrial node pacemaker activity: a new single cell mathematical model. J. Theor. Biol. 1996;181:245–272. doi: 10.1006/jtbi.1996.0129. [DOI] [PubMed] [Google Scholar]
- 27.Wong J., Göktepe S., Kuhl E. Computational modeling of electrochemical coupling: a novel finite element approach towards ionic models for cardiac electrophysiology. Comput. Methods Appl. Mech. Eng. 2011;200:3139–3158. [Google Scholar]
- 28.DiFrancesco D. Pacemaker mechanisms in cardiac tissue. Annu. Rev. Physiol. 1993;55:455–472. doi: 10.1146/annurev.ph.55.030193.002323. [DOI] [PubMed] [Google Scholar]
- 29.Göktepe S., Kuhl E. Computational modeling of electrophysiology: a novel finite element approach. Int. J. Numer. Methods Eng. 2009;79:156–178. doi: 10.1002/cnm.2565. [DOI] [PMC free article] [PubMed] [Google Scholar]
- 30.Dal H., Göktepe S., Kuhl E. A fully implicit finite element method for bidomain models of cardiac electrophysiology. Comput. Methods Biomech. Biomed. Eng. 2011 doi: 10.1080/10255842.2011.554410. [DOI] [PubMed] [Google Scholar]
- 31.Kotikanyadanam M., Göktepe S., Kuhl E. Computational modeling of electrocardiograms—a finite element approach towards cardiac excitation. Int. J. Numer. Meth. Biomed. Eng. 2010;26:524–533. [Google Scholar]
- 32.Ishizuka T., Kakuda M., Yawo H. Kinetic evaluation of photosensitivity in genetically engineered neurons expressing green algae light-gated channels. Neurosci. Res. 2006;54:85–94. doi: 10.1016/j.neures.2005.10.009. [DOI] [PubMed] [Google Scholar]
- 33.Tsunoda S.P., Ewers D., Hegemann P. H+-pumping rhodopsin from the marine alga Acetabularia. Biophys. J. 2006;91:1471–1479. doi: 10.1529/biophysj.106.086421. [DOI] [PMC free article] [PubMed] [Google Scholar]
- 34.Lee J.H., Durand R., Deisseroth K. Global and local fMRI signals driven by neurons defined optogenetically by type and wiring. Nature. 2010;465:788–792. doi: 10.1038/nature09108. [DOI] [PMC free article] [PubMed] [Google Scholar]
- 35.Göktepe S., Abilez O.J., Kuhl E. A multiscale model for eccentric and concentric cardiac growth through sarcomerogenesis. J. Theor. Biol. 2010;265:433–442. doi: 10.1016/j.jtbi.2010.04.023. [DOI] [PubMed] [Google Scholar]
- 36.Chen M.Q., Wong J., Kovacs G.T.A. Characterization of electrophysiological conduction in cardiomyocyte co-cultures using co-occurrence analysis. Comp. Meth. Biomech. Biomed. Eng. 2011 doi: 10.1080/10255842.2011.615310. In press. [DOI] [PubMed] [Google Scholar]
- 37.Wenk J.F., Eslami P., Guccione J.M. A novel method for quantifying the in-vivo mechanical effect of material injected into a myocardial infarction. Ann. Thorac. Surg. 2011;92:935–941. doi: 10.1016/j.athoracsur.2011.04.089. [DOI] [PMC free article] [PubMed] [Google Scholar]
- 38.Göktepe S., Kuhl E. Electromechanics of the heart—a unified approach to the strongly coupled excitation-contraction problem. Comput. Mech. 2010;45:227–243. [Google Scholar]
- 39.Puwal S., Roth B.J. Optimization of feedback pacing for defibrillation. IEEE Trans. Biomed. Eng. 2009;56:532–534. doi: 10.1109/TBME.2008.2003279. [DOI] [PubMed] [Google Scholar]
- 40.Göktepe S., Wong J., Kuhl E. Atrial and ventricular fibrillation—computational simulation of spiral waves in cardiac tissue. Arch. Appl. Mech. 2010;80:569–580. [Google Scholar]
- 41.Khan M.N., Joseph G., Wilkoff B.L. Delayed lead perforation: a disturbing trend. Pacing Clin. Electrophysiol. 2005;28:251–253. doi: 10.1111/j.1540-8159.2005.40003.x. [DOI] [PubMed] [Google Scholar]
- 42.Vlay S.C. Complications of active-fixation electrodes. Pacing Clin. Electrophysiol. 2002;25:1153–1154. doi: 10.1046/j.1460-9592.2002.01153.x. [DOI] [PubMed] [Google Scholar]
- 43.Bamann C., Kirsch T., Bamberg E. Spectral characteristics of the photocycle of channelrhodopsin-2 and its implication for channel function. J. Mol. Biol. 2008;375:686–694. doi: 10.1016/j.jmb.2007.10.072. [DOI] [PubMed] [Google Scholar]
- 44.Gunaydin L.A., Yizhar O., Hegemann P. Ultrafast optogenetic control. Nat. Neurosci. 2010;13:387–392. doi: 10.1038/nn.2495. [DOI] [PubMed] [Google Scholar]
- 45.Berndt A., Prigge M., Hegemann P. Two open states with progressive proton selectivities in the branched channelrhodopsin-2 photocycle. Biophys. J. 2010;98:753–761. doi: 10.1016/j.bpj.2009.10.052. [DOI] [PMC free article] [PubMed] [Google Scholar]
- 46.Berndt A., Schoenenberger P., Oertner T.G. High-efficiency channel rhodopsins for fast neuronal stimulation at low light levels. Proc. Natl. Acad. Sci. USA. 2011;108:7595–7600. doi: 10.1073/pnas.1017210108. [DOI] [PMC free article] [PubMed] [Google Scholar]
Associated Data
This section collects any data citations, data availability statements, or supplementary materials included in this article.