


Abstract
Riboswitches regulate gene expression via ligand binding to an aptamer domain which induces conformational changes in a regulatory expression platform. By unfolding and refolding single add adenine riboswitch molecules in an optical trap, an integrated picture of the folding was developed and related to the regulatory mechanism. Force-extension curves (FECs) and constant-force folding trajectories measured on the aptamer alone revealed multiple partially-folded states, including several misfolded states not on the native folding pathway. All states were correlated to key structural components and interactions within hierarchical folding pathways. FECs of the full-length riboswitch revealed that the thermodynamically stable conformation switches upon ligand binding from a structure repressing translation to one permitting it. Along with rapid equilibration of the two structures in the absence of adenine, these results support a thermodynamically-controlled regulatory mechanism, in contrast with the kinetic control of the closely-related pbuE adenine riboswitch. Comparison of the folding of these riboswitches revealed many similarities arising from shared structural features but also essential differences related to their different regulatory mechanisms.
INTRODUCTION
Riboswitches are gene regulatory elements in mRNA which modulate gene activity by sensing the concentration of associated small metabolites (1–3). Found in a wide range of organisms, they are often bipartite in structure, consisting of an aptamer domain which senses the target ligand and an expression platform which modulates gene expression. Ligand binding stabilizes the aptamer domain through changes in secondary and/or tertiary interactions, typically switching the structure of the expression platform between two alternatives and thereby altering transcription, translation, splicing or other processes during expression (1–3).
The purine riboswitches are among the smallest and structurally simplest riboswitches, yet collectively they still demonstrate much of the variety of mechanisms used by more complex riboswitches (4). For example, the xpt guanine riboswitch controls expression via transcription termination (5), the pbuE adenine riboswitch through transcription anti-termination (6) and the add adenine riboswitch through translation activation (7). Despite such different mechanisms, the aptamers of these riboswitches all have very similar structures: a ‘tuning-fork’ architecture wherein the purine binding site is located at a specific residue in a pocket formed at the junction of three helices, two of which are hairpins interacting via kissing loops and aligned on top of the third helix (7,8). Comparative studies of these riboswitches thus provide an opportunity to investigate the molecular features involved in their different regulatory mechanisms (9).
Previous studies have investigated various different features of the purine riboswitch aptamers, such as the ligand specificity (6,10) and its structural basis (10–12), the kinetics of the loop–loop interaction (13), the Mg2+-dependence of the folding (14), the folding energy landscape (15), the structural changes upon ligand binding (11,16–18) and the ligand binding/dissociation rates and energies, for both the aptamer and the full-length riboswitch (9,12,19). The relation of aptamer folding to regulatory mechanism has been less well studied, however, whether in purine riboswitches or more generally. The pbuE riboswitch has been shown, along with the FMN riboswitch, to function via kinetically-controlled folding of the aptamer in competition with ligand binding and transcription (9,13,15,20), while the folding kinetics of the preQ1 riboswitch aptamer suggest that transcription regulation is achieved instead by ligand-induced thermodynamic changes (21). The add riboswitch has been confirmed to control translation in vitro and in vivo, with expression levels indicating that regulation does not require transcription–translation coupling (9). To date, however, little has been done to characterize the interaction between an aptamer and its corresponding expression platform, a key question for understanding and manipulating riboswitch function (22).
We addressed these issues by using force spectroscopy to observe the folding and unfolding trajectories of individual add riboswitch molecules from Vibrio vulnificus held under tension in a high-resolution optical trap. Single molecule force spectroscopy provides a high-precision tool for probing structural transitions (23). Changes in the molecular extension can be measured with single-nucleotide (nt) resolution as the molecule unfolds and refolds under a controlled load, allowing the structural elements involved in each folding event to be determined. The force-dependence of reaction kinetics and equilibria also permit detailed characterization of the folding landscapes (15,24). We first built an integrated picture of folding in the aptamer alone, similar to previous force spectroscopy work on the closely-related pbuE adenine riboswitch aptamer (15). Since these riboswitches have very similar aptamer structures but work by completely different regulatory mechanisms—translation activation (add) rather than transcription anti-termination (pbuE)—we can begin to discern which aspects of the folding arise from shared structural features and which may be important for the different regulatory mechanisms. We then extended these measurements to the complete riboswitch, probing the interaction between aptamer and expression platform and thereby demonstrating that the regulation is likely controlled by the folding thermodynamics.
MATERIALS AND METHODS
RNA constructs were created by inserting the sequence for the add aptamer alone, expression platform alone or full-length riboswitch (Supplementary Table S1) into the pMLuc-1 plasmid. The resulting transcription template containing the riboswitch (or its constituent parts) flanked by linker regions on either side was amplified by PCR and transcribed in vitro. Two ssDNA handles (one complementary to the 842-nt linker on the 3′-end of the transcript and labelled with biotin, the other complementary to the 1289-nt linker on the 5′-end of the transcript and labelled with digoxigenin) were polymerized from the same template using asymmetric PCR (25). The handles were annealed with the RNA transcript, then incubated with 600-nm and 820-nm diameter polystyrene beads labelled with avidin DN (Vector Labs) and anti-digoxigenin (Roche), respectively, to create dumbbells. Dumbbells were placed in measuring buffer (50 mM MOPS pH 7.5, 130 mM KCl, 4 mM MgCl2, 200 U/ml Superase·In RNase inhibitor (Ambion) and oxygen scavenging system: 40 U/mL glucose oxidase, 185 U/mL catalase and 8.3 mg/ml glucose) and inserted into a sample chamber on a clean microscope slide in the optical trap.
Measurements were made using a custom-built, dual-beam optical trap similar to one described previously (26). Briefly, two laser beams at 1064 nm with independent position and intensity control were used to pull on the handles of the RNA constructs and apply force to the riboswitch. Changes in construct length resulting from the applied force were determined by monitoring the deflection of two separate detector beams at 633 nm that resulted from the motion of the beads, using position sensitive diodes. Constant force measurements were made using a passive force clamp, by pulling the bead in one trap out to a distance of ∼170–180 nm from the trap centre, where the force displacement curve had zero slope (26). Force was changed by adjusting the laser intensity using acousto-optic deflectors. Trap stiffness (0.3 and 0.6 pN/nm for force-extension curves (FECs)) was calibrated as described previously (27).
Data were recorded by custom Labview software (National Instruments), sampled at 20 kHz and filtered online at 10 kHz with an 8-pole Bessel filter. Offline analysis was done using custom software in Igor Pro (Wavemetrics). Multiple FECs were aligned to correct for slow drift of a few nanometres over several hours. Constant force data were median filtered offline in a 1–2.5 ms window, and states with different extensions were separated and identified using a modified thresholding algorithm (24). Additional details on all methods and materials are provided in the Supplementary Data.
RESULTS
Folding intermediates of the aptamer
First the aptamer alone was measured, using FECs and trajectories at constant force to identify states in the folding pathway. The optical trapping assay is illustrated schematically in Figure 1A. Three FECs measured in the absence of adenine (Figure 1B: black, blue and red lines) display typical features: the force, F, at first rises nonlinearly with extension due to the elasticity of the double-stranded (ds) handles (28,29), until characteristic ‘sawtooth’ patterns occur when the length increases abruptly due to unfolding of different parts of the aptamer (29). Four states are seen with different contour lengths. The change in the contour length associated with each unfolding transition, ΔLc, was found by fitting the aggregated FEC data from hundreds of pulls on the same molecule (Figure 1B: grey dots) to two extensible worm-like chain (WLC) models (30) in series, one for the ds handles, and a second for the unfolded ssRNA (31). The average values of ΔLc determined from more than 5200 FECs measured on four different molecules were: ΔLc = 39.6 ± 0.5 nm from the fully folded state (labelled ‘F’, purple line) to the fully unfolded state (labelled ‘U’, yellow line), ΔLc = 19 ± 1 nm from F to the shorter intermediate (labelled ‘P2P3’, cyan line), and ΔLc = 30.3 ± 0.5 nm from F to the longer intermediate (labelled ‘P3’, green line). All uncertainties are reported as the standard error.
Figure 1.

Force spectroscopy of add aptamer alone. (A) RNA containing the riboswitch aptamer flanked by 2 kb-long handle sequences was annealed to DNA strands complementary to the handles and attached to beads held in optical traps. (B) FECs in the absence of adenine reveal two intermediate states corresponding to the unfolding of everything except hairpins P2 and P3, followed by hairpin P2. Three FECs (black, blue, red) are plotted above the aggregated data from 700 FECs (grey dots). WLC fits are shown for the four states: F, fully folded (purple); U, fully-unfolded (yellow); P3–P3, folded (green) and P2P3, both P2 and P3 folded (cyan). (C) Adenine binding resulted in similar behaviour but higher unfolding forces. State P2P3 was observed less frequently if at all. (D) The extension as a function of time at different levels of constant force in the absence of adenine reveals five distinct states corresponding to the major structural features: fully-unfolded at the largest extension (‘U’), then P3 folded (‘P3’), then both P2 and P3 folded but no loop–loop interaction (‘P2P3’), then the P2–P3 kissing loop complex (labelled ‘P1_U’, P1 unfolded) and finally fully-folded (‘F’). Only short segments of the full records are displayed. (E) Histograms of the full extension records show force-dependent occupancies of the states. The P1_U state always has low occupancy.
We related these states to the unfolding of distinct structural elements in the aptamer (Figure 1B, inset) via the ΔLc values expected from these structures: ΔLc = Nnt·Lcnt − Δnh·dh, where Nnt is the number of nucleotides unfolded, Lcnt = 0.59 nm is the contour length/nt for ssRNA (32), Δnh is the number of RNA helices removed during unfolding and dh = 2.2 nm is the diameter of the A-form dsRNA helix (32). The ΔLc values expected for different structures are listed in Supplementary Table S2, alongside the measured values. We found excellent agreement with the expected value for full unfolding (F to U), confirming that the aptamer is being completely unfolded. P1 unfolding by itself was not observed, but the intermediate labelled P2P3 matched the result expected for unfolding P1 and the loop–loop interaction (i.e. everything but P2 and P3). The last intermediate (labelled P3) was in good agreement with the expectation for unfolding everything except P3. However, since hairpins P2 and P3 differ by only 2 nt in length, additional confirmation for this state was obtained using an anti-sense DNA oligomer complementary to the 5′ stem and loop of hairpin P2 to block P2 folding, and another complementary to the loop and 3′ stem of hairpin P3 to block P3 folding (Supplementary Figure S1). Notably, whereas state F never reformed once it was unfolded in a given FEC, multiple transitions between states P2P3, P3 and U were often observed (Figure 1B), indicating much faster kinetics for hairpins P2 and P3 than for helix P1 and the junction.
Similar behaviour was observed when measurements were repeated in the presence of saturating adenine concentration (200 μM >> KD ∼ 600 nM (12)), as shown in Figure 1C. In this case, the aptamer was held at F ∼ 0 for 5 s between FECs to ensure that adenine binding occurred (15). The principal change due to adenine binding was an increase in the typical unfolding force for the fully-folded state, and a concomitant reduction in the population of the intermediate states; P2P3 was in particular often not observed. The average contour length changes between states, measured from >3000 FECs on eight different molecules, were found to be identical to the results above within experimental uncertainty, indicating the same intermediates as when adenine is absent (Supplementary Table S2).
To characterize the intermediate states in greater detail, folding trajectories were measured at constant force using a passive force clamp (26). The aptamer was first fully unfolded at high force then the force was reduced in discrete steps, measuring the molecular extension while maintaining a constant force after each step for up to 1 min to observe equilibrium behaviour. The force was stepped down until the aptamer was fully folded. In the absence of adenine, transitions between five different extensions were observed (Figure 1D), indicating five separate structural elements forming in apparently sequential order. The populations of these states changed as the force was reduced, as seen from histograms of the extension (Figure 1E), with the more-folded states (at shorter extensions) becoming more populated at lower forces. All five states could, however, be observed coexisting in equilibrium at F ∼ 10 pN.
Analogously to the FEC analysis, the states were identified by converting the extension changes between them into the number of nucleotides folded, using Nnt = [Δx(F) + Δnh·dh]/Δxnt(F), where Δxnt(F) is the extension/nt at a given force. The first folding transition from the unfolded state, at F ∼ 11–14 pN (Figure 1D, red), involved 19.0 ± 0.4 nt, precisely the number expected for hairpin P3. The second transition (at F ∼ 10–12 pN) involved 21.3 ± 0.4 nt, matching the expectation for P2. These are the same partially-folded intermediates seen in the FECs (P3 and P2P3); once again, the identifications were confirmed using an anti-sense oligo to block P2 folding (Supplementary Figure S1C). The last two transitions displayed very different behaviour. At F < 9–10 pN, the aptamer folded into a long-lived state 30.3 ± 0.7 nt shorter than P2P3 (Figure 1D, yellow). Since only 31 nucleotides remain unfolded once P2 and P3 have formed, this must be the fully-folded state F. Before F formed, however, a rarely- and transiently-occupied state ∼ 5 nm shorter than P2P3 was typically seen (Figure 1D, green), at the extension expected when the loop–loop interaction has formed to pre-organize the binding pocket and only P1 is unfolded (8.6 ± 0.7 nt of folding measured from P2P3, 8 nt expected). We identify this as the P1 unfolded state (labelled ‘P1_U’ in Figure 1D). This state was the only one not observed in the FECs.
When 200 μM adenine was added, the qualitative behaviour of the aptamer was unchanged, with the same progression of states seen at similar forces. The principal differences involved helix P1: it folded at a slightly higher force, and most prominently, its lifetime was greatly increased. Indeed, once P1 folded in the presence of adenine, it was never observed to unfold again (on the typical timescale of ∼1 min) without a large force increase. Adenine thus clearly shifts the equilibrium for P1 folding, moving the mid-point between folded and unfolded P1, F1/2, to a higher force that is above the equilibrium for formation of the kissing loops and possibly even hairpins P2 and/or P3. As a result, with adenine bound it was not possible to observe equilibrium folding of P1 under constant force. The results of the constant force analysis are summarized in Supplementary Table S3.
Energy landscape of the aptamer
Using the measurements above, we reconstructed the five-state folding landscape of the aptamer. Because P1 folding was never in equilibrium in the presence of adenine, we first used Jarzynski’s equality (33) to determine from the FECs the free energy change between F and P2P3. The free energy for unfolding P1, the binding pocket junction, and the kissing loop complex was found to be 10 ± 1 kcal/mol without adenine and 18 ± 2 kcal/mol with 200 μM adenine. Comparing to the free energy predicted for the secondary structure of P1 and the junction loops, estimated as approximately −8.6 kcal/mol (Supplementary Data), our results indicate a stabilization energy of ∼−1.5 kcal/mol from tertiary interactions that form in the absence of adenine (principally the loop–loop complex), and a more substantial −8 kcal/mol of additional stabilization upon adenine binding. This is consistent with NMR results showing some tertiary interactions without adenine but considerable stabilization of tertiary interactions upon adenine binding (16,34), with a binding energy of approximately −8 kcal/mol as calculated from dissociation constants obtained by fluorescence studies (12).
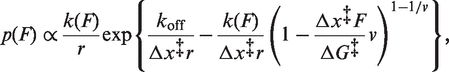
We next found the height and location of the barrier for unfolding P1 by analysing the distributions of unfolding forces from the FECs. Representative unfolding force distributions measured at similar loading rates (∼ 40 pN/s) with and without adenine (Figure 2A) show a typical increase of several pN in unfolding force upon adenine binding. These distributions are well fit by a quantitative model based on the shape of the energy landscape (35):
 |
(1) |
 |
(2) |
koff is the unfolding rate at zero force, Δx‡ is the distance to the transition state from the folded state, ΔG‡ is the height of the energy barrier, r is the loading rate, kB is Boltzmann’s constant and ν is a parameter characterizing the shape of the energy barrier (ν = 1/2 for a cusp-like barrier, ν = 2/3 for a softer cubic potential). A complementary analysis of the kinetics based on the cumulative probability of unfolding yielded the lifetime of the folded state as a function of force and hence the unfolding rate k(F) (36). Values of k(F) from datasets at different loading rates collapse to a single curve (36), well fit by the same type of landscape model using Equation (2) (Figure 2B).
Figure 2.

Unfolding force distributions and force-dependent rates determined from FECs. (A) The unfolding force is higher with adenine bound (red) than without adenine (blue). Solid lines: fits to Equation (1). Error bars show SD. (B) Unfolding rate as a function of force, fit to Equation (2). Error bars show SEM. The barrier to unfolding is located at the first base triple between P1 and the junction loop (inset, red).
Distributions measured at loading rates ranging from 5–400 pN/s, with and without adenine, were analysed by both methods. We averaged the results obtained under the two limiting cases for the shape of the energy barrier (ν = 1/2, ν = 2/3), since this shape is unknown. The unfolding rate at zero force was found to be 1.5 × 10⁻⁵ s−1 (log koff = −4.8 ± 0.1) without adenine and 3 × 10⁻⁷ s−1 (log koff = −6.5 ± 0.4) with adenine bound. The barrier height was 12.3 ± 0.4 kcal/mol without adenine, and 16 ± 2 kcal/mol with adenine bound. The barrier position did not depend on adenine binding: Δx‡ = 6.2 ± 0.6 nm with adenine and 6.1 ± 0.5 nm without. Since ssRNA has an extension of 0.40–0.45 nm/nt in the force range 12–20 pN matching the most probable unfolding forces, this result places the transition state for unfolding at 7–8 bp along helix P1. A comparison to the crystal structure of the ligand-bound aptamer (7) reveals that the transition state is located next to the first base pair in P1 involved in triplex interactions with the junction loops: nucleotides U20:A76 in P1 and U49 in the loop, shown in red in Figure 2B (inset). These interactions therefore appear to act as structural keystones preventing unfolding.
Finally, these FEC results for P1 unfolding were combined with the constant force results for all the other transitions to reconstruct piecewise the energy landscape for the native folding pathway of the aptamer at a constant force of F = 10.8 pN, with and without the binding of an adenine molecule (Figure 3). The transitions other than P1 unfolding were analysed as sequential two-state processes. The relative positions and energies of the states were determined from constant-force extension histograms, whereas the positions and heights of the energy barriers between states were determined from the force-dependent kinetics (15,37).
Figure 3.

Folding energy landscapes. The key features of the energy landscapes for the five-state native folding pathway were reconstructed from piecewise two-state analyses of each transition. Energies and positions are plotted with reference to the P2P3 state. Error bars show SEM. Dotted lines indicate notional landscape shapes in the presence (red) and absence (black) of adenine. Cartoons indicate the structural features associated with each state.
Misfolded states in the aptamer
Intriguingly, an additional set of states with different extensions and distinct features (Figure 4A) was observed occasionally at medium forces (∼10 pN). Most prominent was a long-lived state labelled ‘M’ in Figure 4A. This state was observed for all molecules, independent of adenine concentration (Supplementary Figure S2A), occurring at a rate of ∼1 min−1 with a lifetime of ∼1–10 s. Within state M, additional transient folding events were also seen, such as the spike labelled ‘M3’ in Figure 4A, with lifetimes of ∼10 ms. The extension change from U to M, determined from extension histograms (Supplementary Figure S2B), corresponds to 31 ± 1 nt of folded RNA. This does not match the length of any structural feature in the regular folding pathway of the aptamer. As the aptamer almost always (∼95% of the time) entered and exited this state via the fully unfolded state, rather than any of the partially folded intermediates, we therefore attribute it to an off-pathway, ‘misfolded’ structure.
Figure 4.

Misfolded states. (A) Occasionally a state with extension between P3 and P2P3 (labelled ‘M’) forms from the unfolded state. It does not lead to any of the other states on the pathway to the natively folded state F—it begins and ends at U—but it does lead occasionally to other misfolded states with different extensions, such as the state M3. (B) Two potential misfolded structures include a pseudoknot (nucleotides 17–45) and a hairpin (37–68). (C) With a DNA oligomer bound to the 5′ strand of P1, the misfolded state still occurs, indicating that misfolding does not involve the pseudoknot. The P1_U state is still observed even when P1 is prevented from forming. (D) Extension histograms of the off-pathway, misfolded states reveal three distinct misfolded states which are well fit by Gaussian distributions. Insets: structures associated with each state. (E) Folding pathways of the aptamer. The native pathway involves sequential formation of hairpins P3 and P2, then the P2–P3 kissing loop complex (P1_U) and finally the fully-folded aptamer. 0.3% of the time the unfolded state folds into state M, preventing formation of the adenine binding pocket and leading to other off-pathway, misfolded states.
A search of suboptimal structures using mfold (38) and HotKnots (39) revealed two possible candidates for state M: a potential pseudoknot involving 29 nts that would normally form hairpin P2 and the 5′-end of P1, or a hairpin made from 32 nts which would normally form the 3′ stem of P2 through to the 5′ stem of P3 (Figure 4B). By using anti-sense oligos to block in turn the 5′ stem of P1 and the 8-nt junction loop between P2 and P3 (J2/3), we found that M still forms when P1 is blocked (Figure 4C) but not when J2/3 is blocked, indicating that M is the hairpin, not the pseudoknot. Evidence for at least two additional, transient folding transitions out of state M was found from the extension histograms (Figure 4D): one to a state that is 2.6 ± 0.5 nm shorter than M (labelled ‘M2’) and another to a state that is 7.1 ± 0.5 nm shorter (‘M3’). These distances are consistent with two of the extra misfolded states that may form along in concert with M (inset, Figure 4D): an 11-nt hairpin causing an extension decrease of 2.5 nm (M2: nucleotides 24–34) and a 16-nt helix-bulge decreasing the extension by 6.5 nm (M3: nucleotides 30–36 and 69–77).
The misfolded state clearly prevents the adenine binding site from forming, which would negate the regulatory ability of the riboswitch. However, we do not expect state M to be biologically relevant: its folding rate is much slower than that of P2 and P3, and it forms only very rarely in our in-vitro assay (only ∼0.3% of the folding transitions initiated from U go to M). It would likely form even more rarely co-transcriptionally, because P2 would be expected to fold first. Numerous RNAs are known to misfold into non-native structures simply due to the rugged energy landscape generated by alternative patterns of basepairing (40), although few have been studied with single-molecule methods allowing individual trajectories to be followed (41,42). Combining all the results above, we can build an integrated picture of the alternative pathways, each with multiple states (Figure 4E).
Full-length riboswitch
In order to probe the interaction between the aptamer and the expression platform, we also made constructs containing the full riboswitch sequence, consisting of the aptamer plus the expression platform. FECs were measured by pulling the traps apart until the riboswitch unfolded, then rapidly bringing the traps together, waiting 5 s for folding and ligand binding, and repeating. FECs measured in the presence of 200 μM adenine (Figure 5A) look very similar to FECs of the adenine-bound aptamer alone: the riboswitch unfolds between two principal states at relatively high force, with an unfolding force distribution (Figure 5C) that matches the result found for the adenine-bound aptamer (Figure 2A, red). The contour length change between the two states, determined from WLC fits to 990 FECs from two molecules, was ΔLc = 40.7 ± 0.5 nm. This is very close to ΔLc for complete unfolding of the aptamer alone (39.7 nm), indicating that the aptamer is almost always folded, the expression platform is unstructured, and the riboswitch is in the ‘on’ state for gene expression (Figure 5A, inset).
Figure 5.

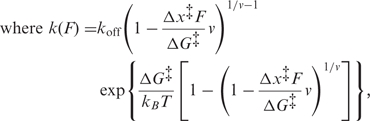
FECs of the full-length riboswitch. (A) With adenine bound, the aptamer is folded (‘on’ state) and the contour length change is the same as for the aptamer alone. Solid lines: fits to ‘on’ (grey) and unfolded (green) states. Inset: secondary structure in the ‘on’ state. (B) Without adenine, the expression platform is folded (red, blue, brown) more often than the aptamer (black). Solid lines indicate fits to ‘on’ (grey), ‘off’ (orange) and unfolded (green) states. Dotted lines indicate partially-folded intermediates of the aptamer alone: P1_U (blue), P2P3 (pink) and P3 (cyan). Inset: secondary structure in the ‘off’ state. (C) The unfolding force distribution of FECs measured with adenine present matches that expected for the adenine-bound aptamer. Red line: fit to Equation (1). (D) The unfolding force distribution without adenine reveals two sub-populations. The higher-force peak (black) comes from curves initially in the ‘on’ state and matches the distribution expected for the adenine-free aptamer [red line: fit to Equation (1)]. The lower peak (orange) comes from curves initially in the ‘off’ state and matches the distribution expected for the expression platform alone [brown line: fit to Equation (1)]. (E) Unfolding force distribution of the expression platform alone [brown line: fit to Equation (1)]. The most likely force is lower than for the ‘off’ state in (D) due to a 15-fold lower loading rate.
When no adenine is present, the signature of aptamer unfolding is still observed some of the time (Figure 5B, black), but a majority of the FECs display qualitatively different behaviour (Figure 5B: red, blue and brown). These two sub-populations of unfolding behaviour are reflected very clearly in the unfolding force distribution, which reveals two distinct peaks for the force of the first unfolding event in each curve (Figure 5D). The higher-force peak (Figure 5D, black) results from the curves where the contour length change indicates the aptamer is initially folded and the riboswitch is ‘on’ (Figure 5B, black). Fits to this part of the distribution using Equation (1) (Figure 5D, red) return the parameters expected for the adenine-free aptamer (compare to Figure 2A, blue), confirming the identification of the state as ‘on’. The riboswitch was observed to be ‘on’ ∼35% of the time, even though no adenine was present. This ‘leakage’ rate under conditions that should turn the expression off is within the typical range of rates for similar regulatory elements such as transcription terminators (43,44).
The lower-force peak is due to the other, majority class of FECs (Figure 5B: red, blue and brown), which lack the single prominent sawtooth feature seen for the aptamer alone and display instead a larger number of smaller, repeated unfolding/refolding transitions. In these curves, the first unfolding event occurs at considerably lower force (∼5–8 pN) than for the ‘on’ state, as seen from the unfolding force distribution (Figure 5D, orange). The contour length of these curves also starts off shorter than that of the ‘on’ state: fitting the low-force region of these FECs to a WLC model (Figure 5B, orange) reveals ΔLc = 52.2 ± 0.9 nm to the fully-unfolded state (Figure 5B, green), measured from 1989 FECs on 4 molecules. This agrees well with the value of 53.4 nm expected for unfolding the full riboswitch in the ‘off’ state, assuming that the expression platform is folded as well as P2, P3, and the loop–loop complex (Figure 5B, inset). The low unfolding force observed is also consistent with unfolding the expression platform, since its three bulges and low G:C content reduce its mechanical stability (24,37). Indeed, the low-force peak of the distribution in Figure 5D matches the unfolding force distribution measured using constructs that contain the expression platform alone, shown in Figure 5E (1400 FECs on 2 molecules). With no adenine present, we observed the riboswitch to be in the ‘off’ state ∼ 65% of the time. Interestingly, the riboswitch is in the ‘on’ state ∼2.5 times more frequently when adenine is present than when it is not, matching well the ∼3-fold increase in expression levels observed in vitro (9).
In the FECs measured without adenine, the riboswitch is seen to fluctuate between six different states: the five states of the aptamer alone and the ‘off’ state with expression platform folded. Indeed, what looks like noise in the FECs between the ‘off’ state and the unfolded state is consistent with frequent inter-conversion between the different partially-folded states of the aptamer, shown in Figure 5B as dotted lines. However, the unfolding of the full riboswitch from the ‘off’ state is not simply sequential, as for the aptamer alone, even though the unfolding force for the expression platform is several pN lower than that of any other structural element of the riboswitch. Instead, the presence of two alternative, fully-folded states is observed directly, through switching between the ‘on’ and ‘off’ states.
Examples of this behaviour are seen in Figure 5B (brown curve at ∼6 pN, blue curve at ∼8–9 pN). It is even seen very occasionally with adenine present, as in Figure 6. Here, the riboswitch is initially folded in the ‘off’ state (without adenine bound), but at F ∼ 5 pN the contour length twice increases briefly to the ‘on’ state value before returning to the ‘off’ state, i.e. the folded expression platform is transiently replaced by a folded P1. A last switching event is seen at ∼7 pN, when the ‘off’ state unfolds to the contour length expected for the P1-unfolded state (i.e. with repressor hairpin completely unfolded) before P1 folds to produce the ‘on’ state one last time. Adenine clearly binds to the aptamer soon thereafter, since the ‘on’ state is stabilized and does not unfold until a high-force characteristic of the adenine-bound state.
Figure 6.
Switching and ligand binding. A riboswitch, initially ‘off’ in the presence of adenine, switches several times between ‘off’ and ‘on’, eventually binding adenine and remaining in the thermodynamically more stable adenine-bound ‘on’ state before unfolding completely.
DISCUSSION
These results provide new insight into the relation between folding and functional mechanisms in the add riboswitch, both at the level of the aptamer alone as well as the full-length riboswitch, especially through comparison to previous results for the pbuE riboswitch (15). While the two riboswitches have aptamers with very similar structures, they operate by quite different mechanisms: translation activation for add as opposed to transcription anti-termination for pbuE. Comparison of the behaviour of the aptamers reveals many commonalities due to the similar structures, but also some important differences. In both cases, a total of five states were observed, and the aptamers were found to fold sequentially: first the two hairpins (P2 and P3) forms, then the loop–loop interaction and finally P1. Crucially, the helix P1—which acts as the mechanical switch—is the last part of the molecule to fold. In both cases, this helix is strongly stabilized by adenine binding, whereas the energetic and kinetic properties of the other states are not affected (Figure 3). The reconstructed energy landscapes are in fact quantitatively very similar, due to the extensive structural and sequence similarities between the two aptamers.
The landscapes in Figure 3 also highlight some of the important differences between the aptamers. First, the order of folding of the two hairpin loops is reversed: P3 folds at higher force than P2 in the add aptamer, vice versa for the pbuE aptamer. This effect was predicted by simulations (45) and is due to the different relative stabilities of the helices P2 and P3 in the two different aptamers. More fundamental is the difference in stability of helix P1. In the add aptamer, P1 is similar in stability to P2 and P3 even in the absence of adenine (F1/2 ∼ 10 pN) and it has a low unfolding rate at F = 0 (koff ∼ 10−5 s−1). In contrast, P1 in the pbuE aptamer is quite unstable without adenine bound (F1/2 = 3 pN) and has an unloaded unfolding rate koff that is 10 000 times higher. As a result, the pbuE aptamer is much more susceptible to strand invasion by the expression platform, the process which is required to form the terminator hairpin and switch the gene off.
The different stabilities of P1 appear to be related directly to the different functional mechanisms of the riboswitches. For the pbuE riboswitch, the conformation with terminator hairpin folded and aptamer unfolded is the most stable thermodynamically, regardless of whether or not adenine is bound to the aptamer; both in vitro (13,15,19) and in vivo (9) measurements point to a mechanism whereby the outcome of riboswitch folding (and hence level of gene expression) is governed by a competition between the kinetics of aptamer folding, ligand binding and transcription elongation. In such a situation, an unstable P1 is what is needed to permit strand invasion on a timescale competitive with transcription rates. Kinetic control of riboswitch folding has also been demonstrated for the FMN riboswitch (20). Our measurements on the full-length add riboswitch, in contrast, show quite clearly that the thermodynamically stable conformation switches upon adenine binding: the state with the aptamer folded and expression platform unfolded (‘on’) is dominant, and hence most stable, when adenine is bound, but the state with the expression platform folded and aptamer partially-unfolded is dominant when adenine is not bound. Results such as those in Figure 6 encapsulate the essence of the folding of this riboswitch: the RNA inter-converts from ‘off’ to ‘on’, with the outcome ultimately determined by thermodynamic changes due to ligand binding.
It was previously suggested, based on the adenine-binding ability of the full-length riboswitch as well as mfold (38) predictions of secondary structure energies for the ‘on’ and ‘off’ states, that the ‘off’ state is more stable than the ‘on’ state without adenine but still readily fluctuates into the ‘on’ state in an equilibrium (9,12). Our observations directly show that this is, in fact, the case. Given that the ‘off’ state is occupied ∼1.7 times more often than the ‘on’ state in the absence of adenine, the ‘off’ state is more stable by ∼0.3 kcal/mol without adenine bound. This agrees within error with our estimate of the energy difference between the ‘on’ and ‘off’ states obtained by adding to secondary-structure energy calculations the energies we measured for tertiary interactions and ligand binding: the ‘off’ state should be more stable than the ‘on’ state by ∼1.4 kcal/mol when no adenine is bound, whereas the ‘on’ state should be more stable by ∼6.6 kcal/mol with adenine bound (Supplementary Data).
In order to demonstrate that the regulatory mechanism of this riboswitch is controlled thermodynamically, we also measured the kinetics of the folding. We first determined the folding rate of the aptamer (the ‘on’ state) at F = 0 from refolding FECs measured in the absence of adenine while ramping the force from ∼20 pN (where the aptamer is completely unfolded) down to 0 pN. A total of 1227 refolding FECs were measured, and the cumulative folding probabilities were analysed (36) as in Figure 2B. The average refolding times plotted as a function of force (Figure 7A) were then extrapolated to zero force by fitting to Equation (2), resulting in an unloaded folding rate of ∼30 s−1. Since transcription in vivo occurs at a typical rate of ∼40–50 nt/s (46,47) and the expression platform contains 40 nt, this folding rate implies that the aptamer should fold completely well before the repressor hairpin has even been partially transcribed, regardless of adenine binding. Hence the riboswitch always starts in the ‘on’ state.
Figure 7.

Folding kinetics and riboswitch mechanism. (A) The aptamer refolding rate as a function of force without adenine is determined from the distribution of refolding forces when ramping the force down from denaturing values. Error bars show SEM. Red line: fit to Equation (2). (B) The fraction of unfolding FECs in the off state as a function of refolding time at low force in the absence of adenine shows an exponential rise as the riboswitch structure equilibrates into the more stable ‘off’ state. (C) Schematic of the riboswitch mechanism. The aptamer folds rapidly before the expression platform is transcribed, regardless of adenine binding. If adenine binds to the aptamer, it stabilizes the ‘on’ state of the riboswitch (aptamer folded, ribosome binding site exposed). Without adenine binding, the ‘on’ state is unstable and equilibrates into the ‘off’ state (P1 unfolded, ribosome binding site sequestered). RBS: ribosome binding site.
Since adenine binding locks the riboswitch into the ‘on’ state with a large binding energy and low unfolding rate, then if the riboswitch is to act as a switch, clearly the ‘on’ state must be able to equilibrate into the ‘off’ state rapidly in the absence of adenine, before the ribosome binds the Shine–Dalgarno sequence. To determine this equilibration rate, 5012 FECs were measured on 11 molecules while varying the time spent waiting at low force to permit equilibration, from 0.3–5 s. An exponential fit to the fraction of molecules found in the ‘off’ state as a function of time (Figure 7B) yielded an equilibration time of τeq = 0.2 ± 0.1 s. The ribosome binding time is not well known, but a lower bound (even for coupled transcription and translation) is provided by the time required to transcribe the mRNA footprint for the ribosome. Footprinting studies and crystal structures (48,49) imply this involves another ∼15 nt downstream of the 3′-end of the riboswitch expression platform, requiring ∼0.3 s at typical transcription rates (or 1.5 τeq). Hence the ‘on’ and ‘off’ states should be substantially (if not completely) equilibrated by the time the ribosome binds, strongly supporting a thermodynamically-controlled regulatory mechanism.
The picture of the riboswitch mechanism suggested by our results is summarized in Figure 7C. During the transcription of the expression platform, the riboswitch folds into the ‘on’ state. If adenine does not bind to the aptamer after the expression platform is fully transcribed, the ‘on’ state is no longer thermodynamically stable and the riboswitch equilibrates rapidly into the lower-energy ‘off’ state, repressing gene expression but still allowing the ‘on’ state to be populated at an appreciable level. If adenine does bind to the ‘on’ state, then it becomes greatly favoured thermodynamically and the riboswitch stays ‘on’.
SUPPLEMENTARY DATA
Supplementary Data are available at NAR Online.
FUNDING
National Institute for Nanotechnology and the Canadian Institutes of Health Research grant reference number NHG 91374. Funding for open access charge: National Institute for Nanotechnology, NRCC.
Conflict of interest statement. None declared.
Supplementary Material
ACKNOWLEDGEMENTS
We thank W.J. Greenleaf and A. Hoffmann for helpful comments on the manuscript.
REFERENCES
- 1.Roth A, Breaker RR. The structural and functional diversity of metabolite-binding riboswitches. Annu. Rev. Biochem. 2009;78:305–334. doi: 10.1146/annurev.biochem.78.070507.135656. [DOI] [PMC free article] [PubMed] [Google Scholar]
- 2.Coppins RL, Hall KB, Groisman EA. The intricate world of riboswitches. Curr. Opin. Microbiol. 2007;10:176–181. doi: 10.1016/j.mib.2007.03.006. [DOI] [PMC free article] [PubMed] [Google Scholar]
- 3.Baird NJ, Ferré-D’Amaré AR. Idiosyncratically tuned switching behavior of riboswitch aptamer domains revealed by comparative small-angle X-ray scattering analysis. RNA. 2010;16:598–609. doi: 10.1261/rna.1852310. [DOI] [PMC free article] [PubMed] [Google Scholar]
- 4.Kim JN, Breaker RR. Purine sensing by riboswitches. Biol. Cell. 2008;100:1–11. doi: 10.1042/BC20070088. [DOI] [PubMed] [Google Scholar]
- 5.Mandal M, Boese B, Barrick JE, Winkler WC, Breaker RR. Riboswitches control fundamental biochemical pathways in Bacillus subtilis and other bacteria. Cell. 2003;113:577–586. doi: 10.1016/s0092-8674(03)00391-x. [DOI] [PubMed] [Google Scholar]
- 6.Mandal M, Breaker RR. Adenine riboswitches and gene activation by disruption of a transcription terminator. Nat. Struct. Mol. Biol. 2004;11:29–35. doi: 10.1038/nsmb710. [DOI] [PubMed] [Google Scholar]
- 7.Serganov A, Yuan YR, Pikovskaya O, Polonskaia A, Malinina L, Phan AT, Hobartner C, Micura R, Breaker RR, Patel DJ. Structural basis for discriminative regulation of gene expression by adenine- and guanine-sensing mRNAs. Chem. Biol. 2004;11:1729–1741. doi: 10.1016/j.chembiol.2004.11.018. [DOI] [PMC free article] [PubMed] [Google Scholar]
- 8.Batey RT, Gilbert SD, Montange RK. Structure of a natural guanine-responsive riboswitch complexed with the metabolite hypoxanthine. Nature. 2004;432:411–415. doi: 10.1038/nature03037. [DOI] [PubMed] [Google Scholar]
- 9.Lemay JF, Desnoyers G, Blouin S, Heppell B, Bastet L, St-Pierre P, Massé E, Lafontaine DA. Comparative study between transcriptionally- and translationally-acting adenine riboswitches reveals key differences in riboswitch regulatory mechanisms. PLoS Genet. 2011;7:e1001278. doi: 10.1371/journal.pgen.1001278. [DOI] [PMC free article] [PubMed] [Google Scholar]
- 10.Noeske J, Richter C, Grundl MA, Nasiri HR, Schwalbe H, Wöhnert J. An intermolecular base triple as the basis of ligand specificity and affinity in the guanine- and adenine-sensing riboswitch RNAs. Proc. Natl Acad. Sci. USA. 2005;102:1372–1377. doi: 10.1073/pnas.0406347102. [DOI] [PMC free article] [PubMed] [Google Scholar]
- 11.Gilbert SD, Stoddard CD, Wise SJ, Batey RT. Thermodynamic and kinetic characterization of ligand binding to the purine riboswitch aptamer domain. J. Mol. Biol. 2006;359:754–768. doi: 10.1016/j.jmb.2006.04.003. [DOI] [PubMed] [Google Scholar]
- 12.Rieder R, Lang K, Graber D, Micura R. Ligand-induced folding of the adenosine deaminase A-riboswitch and implications on riboswitch translational control. ChemBioChem. 2007;8:896–902. doi: 10.1002/cbic.200700057. [DOI] [PubMed] [Google Scholar]
- 13.Lemay JF, Penedo JC, Tremblay R, Lilley DM, Lafontaine DA. Folding of the adenine riboswitch. Chem. Biol. 2006;13:857–868. doi: 10.1016/j.chembiol.2006.06.010. [DOI] [PubMed] [Google Scholar]
- 14.Buck J, Noeske J, Wöhnert J, Schwalbe H. Dissecting the influence of Mg2+ on 3D architecture and ligand-binding of the guanine-sensing riboswitch aptamer domain. Nucleic Acids Res. 2010;38:4143–4153. doi: 10.1093/nar/gkq138. [DOI] [PMC free article] [PubMed] [Google Scholar]
- 15.Greenleaf WJ, Frieda KL, Foster DAN, Woodside MT, Block SM. Direct observation of hierarchical folding in single riboswitch aptamers. Science. 2008;319:630–633. doi: 10.1126/science.1151298. [DOI] [PMC free article] [PubMed] [Google Scholar]
- 16.Noeske J, Buck J, Fürtig B, Nasiri HR, Schwalbe H, Wöhnert J. Interplay of ‘induced fit’ and preorganization in the ligand induced folding of the aptamer domain of the guanine binding riboswitch. Nucleic Acids Res. 2007;35:572–583. doi: 10.1093/nar/gkl1094. [DOI] [PMC free article] [PubMed] [Google Scholar]
- 17.Ottink OM, Rampersad SM, Tessari M, Zaman GJR, Heus HA, Wijmenga SS. Ligand-induced folding of the guanine-sensing riboswitch is controlled by a combined predetermined–induced fit mechanism. RNA. 2007;13:2202–2212. doi: 10.1261/rna.635307. [DOI] [PMC free article] [PubMed] [Google Scholar]
- 18.Stoddard CD, Gilbert SD, Batey RT. Ligand-dependent folding of the three-way junction in the purine riboswitch. RNA. 2008;14:675–684. doi: 10.1261/rna.736908. [DOI] [PMC free article] [PubMed] [Google Scholar]
- 19.Wickiser JK, Cheah MT, Breaker RB, Crothers DM. The kinetics of ligand binding by an adenine-sensing riboswitch. Biochemistry. 2005;44:13404–13414. doi: 10.1021/bi051008u. [DOI] [PubMed] [Google Scholar]
- 20.Wickiser JK, Winkler WC, Breaker RR, Crothers DM. The speed of RNA transcription and metabolite binding kinetics operate an FMN riboswitch. Mol. Cell. 2005;18:49–60. doi: 10.1016/j.molcel.2005.02.032. [DOI] [PubMed] [Google Scholar]
- 21.Rieder U, Kreutz C, Micura R. Folding of a transcriptionally acting PreQ1 riboswitch. Proc. Natl Acad. Sci. USA. 2010;107:10804–10809. doi: 10.1073/pnas.0914925107. [DOI] [PMC free article] [PubMed] [Google Scholar]
- 22.Zhang J, Lau MW, Ferré-D’Amaré AR. Ribozymes and Riboswitches: Modulation of RNA Function by Small Molecules. Biochemistry. 2010;49:9123–9131. doi: 10.1021/bi1012645. [DOI] [PMC free article] [PubMed] [Google Scholar]
- 23.Woodside MT, Gracia-Gracia C, Block SM. Folding and unfolding single RNA molecules under tension. Curr. Opin. Chem. Biol. 2008;12:640–646. doi: 10.1016/j.cbpa.2008.08.011. [DOI] [PMC free article] [PubMed] [Google Scholar]
- 24.Woodside MT, Behnke-Parks WM, Larizadeh K, Travers K, Herschlag D, Block SM. Nanomechanical measurements of the sequence-dependent folding landscapes of single nucleic acid hairpins. Proc. Natl Acad. Sci. USA. 2006;103:6190–6195. doi: 10.1073/pnas.0511048103. [DOI] [PMC free article] [PubMed] [Google Scholar]
- 25.Saiki RK, Bugawan TL, Horn GT, Mullis KB, Erlich HA. Analysis of enzymatically amplified beta-globin and HLA-DQ alpha DNA with allele-specific oligonucleotide probes. Nature. 1986;324:163–166. doi: 10.1038/324163a0. [DOI] [PubMed] [Google Scholar]
- 26.Greenleaf WJ, Woodside MT, Abbondanzieri EA, Block SM. Passive all-optical force clamp for high-resolution laser trapping. Phys. Rev. Lett. 2005;95:208102–208104. doi: 10.1103/PhysRevLett.95.208102. [DOI] [PMC free article] [PubMed] [Google Scholar]
- 27.Svoboda K, Block SM. Biological applications of optical forces. Annu. Rev. Biophys. Biomol. Struct. 1994;23:247–285. doi: 10.1146/annurev.bb.23.060194.001335. [DOI] [PubMed] [Google Scholar]
- 28.Smith SB, Cui Y, Bustamante C. Overstretching B-DNA: The elastic response of individual double-stranded and single-stranded DNA molecules. Science. 1996;271:795–799. doi: 10.1126/science.271.5250.795. [DOI] [PubMed] [Google Scholar]
- 29.Liphardt J, Onoa B, Smith SB, Tinoco IJ, Bustamante C. Reversible unfolding of single RNA molecules by mechanical force. Science. 2001;292:733–737. doi: 10.1126/science.1058498. [DOI] [PubMed] [Google Scholar]
- 30.Wang MD, Yin H, Landick R, Gelles J, Block SM. Stretching DNA with optical tweezers. Biophys. J. 1997;72:1335–1346. doi: 10.1016/S0006-3495(97)78780-0. [DOI] [PMC free article] [PubMed] [Google Scholar]
- 31.Seol Y, Skinner GM, Visscher K. Elastic properties of a single-stranded charged homopolymeric ribonucleotide. Phys. Rev. Lett. 2004;93:118102–118105. doi: 10.1103/PhysRevLett.93.118102. [DOI] [PubMed] [Google Scholar]
- 32.Saenger W. Principles of Nucleic Acid Structure. New York: Springer; 1984. [Google Scholar]
- 33.Jarzynski C. Nonequilibrium equality for free energy differences. Phys. Rev. Lett. 1997;78:2690–2693. [Google Scholar]
- 34.Buck J, Fürtig B, Noeske J, Wöhnert J, Schwalbe H. Time-resolved NMR methods resolving ligand-induced RNA folding at atomic resolution. Proc. Natl Acad. Sci. USA. 2007;104:15699–16704. doi: 10.1073/pnas.0703182104. [DOI] [PMC free article] [PubMed] [Google Scholar]
- 35.Dudko OK, Hummer G, Szabo A. Intrinsic rates and activation free energies from single-molecule pulling experiments. Phys. Rev. Lett. 2006;96:108101–108104. doi: 10.1103/PhysRevLett.96.108101. [DOI] [PubMed] [Google Scholar]
- 36.Dudko OK, Hummer G, Szabo A. Theory, analysis, and interpretation of single-molecule force spectroscopy experiments. Proc. Natl. Acad. Sci. USA. 2008;105:15755–15760. doi: 10.1073/pnas.0806085105. [DOI] [PMC free article] [PubMed] [Google Scholar]
- 37.Woodside MT, Anthony PC, Behnke-Parks WM, Larizadeh K, Herschlag D, Block SM. Direct measurement of the full sequence-dependent folding landscape of a nucleic acid. Science. 2006;314:1001–1004. doi: 10.1126/science.1133601. [DOI] [PMC free article] [PubMed] [Google Scholar]
- 38.Zuker M. Mfold web server for nucleic acid folding and hybridization prediction. Nucleic Acids Res. 2003;31:3406–3415. doi: 10.1093/nar/gkg595. [DOI] [PMC free article] [PubMed] [Google Scholar]
- 39.Andronescu M, Aguirre-Hernandez R, Condon A, Hoos HH. RNAsoft: a suite of RNA secondary structure prediction and design software tools. Nucleic Acids Res. 2003;31:3416–3422. doi: 10.1093/nar/gkg612. [DOI] [PMC free article] [PubMed] [Google Scholar]
- 40.Russell R. RNA misfolding and the action of chaperones. Front Biosci. 2008;13:1–20. doi: 10.2741/2557. [DOI] [PMC free article] [PubMed] [Google Scholar]
- 41.Li PTX, Bustamante C, Tinoco I., Jr Real-time control of the energy landscape by force directs the folding of RNA molecules. Proc. Natl Acad. Sci. USA. 2007;104:7039–7044. doi: 10.1073/pnas.0702137104. [DOI] [PMC free article] [PubMed] [Google Scholar]
- 42.Russell R, Zhuang X, Babcock HP, Millett IS, Doniach S, Chu S, Herschlag D. Exploring the folding landscape of a structured RNA. Proc. Natl. Acad. Sci. USA. 2002;99:155–160. doi: 10.1073/pnas.221593598. [DOI] [PMC free article] [PubMed] [Google Scholar]
- 43.Reynolds R, Bermúdez-Cruz RM, Chamberlin MJ. Parameters affecting transcription termination by Escherichia coli RNA polymerase: I. Analysis of 13 rho-independent terminators. J. Mol. Biol. 1992;224:31–51. doi: 10.1016/0022-2836(92)90574-4. [DOI] [PubMed] [Google Scholar]
- 44.Nojima T, Lin AC, Fujii T, Endo I. Determination of the termination efficiency of the transcription terminator using different fluorescent profiles in green fluorescent protein mutants. Anal. Sci. 2005;21:1479–1481. doi: 10.2116/analsci.21.1479. [DOI] [PubMed] [Google Scholar]
- 45.Lin J-C, Thirumalai D. Relative stability of helices determines the folding landscape of adenine riboswitch aptamers. J. Am. Chem. Soc. 2008;130:14080–14081. doi: 10.1021/ja8063638. [DOI] [PubMed] [Google Scholar]
- 46.Proshkin S, Rahmouni AR, Mironov A, Nudler E. Cooperation between translating ribosomes and RNA polymerase in transcription elongation. Science. 2010;328:504–508. doi: 10.1126/science.1184939. [DOI] [PMC free article] [PubMed] [Google Scholar]
- 47.Vogel U, Jensen KF. The RNA chain elongation rate in Excherichia coli depends on the growth rate. J. Bacteriol. 1994;176:2807–2813. doi: 10.1128/jb.176.10.2807-2813.1994. [DOI] [PMC free article] [PubMed] [Google Scholar]
- 48.Hüttenhofer A, Noller HF. Footprinting mRNA-ribosome complexes with chemical probes. EMBO J. 1994;13:3892–3901. doi: 10.1002/j.1460-2075.1994.tb06700.x. [DOI] [PMC free article] [PubMed] [Google Scholar]
- 49.Yusupova GZ, Yusupov MM, Cate JHD, Noller HF. The path of messenger RNA through the ribosome. Cell. 2001;106:233–241. doi: 10.1016/s0092-8674(01)00435-4. [DOI] [PubMed] [Google Scholar]
Associated Data
This section collects any data citations, data availability statements, or supplementary materials included in this article.