Abstract
Analysis of polyethylene component wear and implant loosening in total knee arthroplasty (TKA) requires precise knowledge of in vivo articular motion and loading conditions. This study presents a simultaneous, in vivo measurement of tibiofemoral articular contact forces and contact kinematics in three TKA patients. These measurements were accomplished via a dual fluoroscopic imaging system and instrumented tibial implants during dynamic single leg lunge and chair rising-sitting. The measured forces and contact locations were also used to determine mediolateral distribution of axial contact forces. Contact kinematics data showed a medial pivot during flexion of the knee, for all patients in the study. Average axial forces were higher for lunge compared to chair rising-sitting (224% body weight vs. 187% body weight). In this study we measured peak anteroposterior and mediolateral forces averaging 13.3% BW, during lunge and 18.5% BW during chair rising-sitting. Mediolateral distributions of axial contact force were both patient and activity specific. All patients showed equitable medial-lateral loading during lunge but greater loads at the lateral compartment during chair rising-sitting. The results of this study may enable more accurate reproduction of in vivo loads and articular motion patterns in wear simulators and finite element models. This in turn may help advance our understanding of factors limiting longevity of TKA implants, such as aseptic loosening and polyethylene component wear, and enable improved TKA designs.
Introduction
To improve the longevity of total knee arthroplasty (TKA), it is important to have a quantitative understanding of the tibiofemoral articular contact forces on the medial and lateral polyethylene component surfaces (Blunn, et al., 1997, Callaghan, et al., 2004, Currier, et al., 2005, D’Lima, et al., 2006, Stiehl, et al., 1999, Wright, et al., 1992, Zhao, et al., 2007). However, determination of in vivo tibiofemoral contact forces has been a challenging issue in biomechanics. Instrumented tibial implants have been used to measure tibiofemoral forces in-vitro (Kaufman, et al., 1996, Nicholls, et al., 2007). Computational models using inverse dynamic optimization have also been used to estimate joint reaction forces (Crowninshield and Brand, 1981, Li, et al., 1999, Taylor, et al., 2004). In vivo measurement of forces in the femur via an instrumented distal femoral prosthesis has been utilized to calculate forces at the knee. However the knee joint in this prosthesis was substantially different from TKA designs (Taylor, et al., 1998). Recently, D’Lima et al. reported the first in vivo measurement of tibiofemoral forces via an instrumented implant in a TKA patient (D’Lima, et al., 2006). This technique is capable of measuring resultant knee forces in six-DOFs (D’Lima, et al., 2007). However the implant design does not provide a direct estimation of contact forces in the medial and lateral tibiofemoral compartments.
Recently, a dual fluoroscopic imaging system (DFIS) has been used to measure articular contact kinematics of TKA during quasi-static weight-bearing knee flexion (Hanson, et al., 2007, Li, et al., 2006, Suggs, et al., 2008), where tibiofemoral contact locations on the medial and lateral tibial polyethylene surfaces could be accurately determined. The DFIS technique was further developed to measure dynamic knee joint motion (Bingham, et al., 2008). The objective of this study was to combine the DFIS technique and the instrumented TKAs to determine the dynamic 3D articular contact locations and contact forces on the medial and lateral tibial polyethylene surfaces during functional activities of the knee.
Materials and Methodology
Three patients (Table 1) who received custom TKA implants with instrumented tibial components (NKII Zimmer, Warsaw, IN) were recruited with approval of the Institute Review Board and informed patient consent was obtained. A standard anteromedial approach was used to implant a posterior cruciate-retaining femoral component (NK-II CR, Zimmer) and a standard polyethylene insert (NK-II CR Congruent, Zimmer). The distal femoral cut was made at 6° valgus to the femoral anatomic axis. The posterior femoral cut was made at 3° external rotation using the the posterior surface of the condyles as reference, as in a typical measured-resection approach. The tibial cut was made at 90° to the tibial long axis in both the coronal and sagittal planes. Femoral and tibial bone preparation was done using intramedullary alignment. Soft tissues were released to create rectangular tibiofemoral gap that was equal in extension and 90° flexion. The patella was resurfaced with a standard dome-shaped, all-polyethylene component. All components were cemented. At the time of the study, patients were between 5 and 12 months postoperative.
Table 1.
Patient demographics
| Patient # | Sex | R/L Knee | Age (Yrs) | Weight* (N) | Height (m) | Months Post Op |
|---|---|---|---|---|---|---|
| 1 | M | R | 79 | 780 | 1.74 | 7 |
| 2 | F | L | 65 | 950 | 1.71 | 5 |
| 3 | M | L | 84 | 900 | 1.78 | 12 |
Includes weight of protective lead apparel worn during fluoroscopic imaging
During the study, the subject was asked to stand straight with the target knee in the field of view of the two fluoroscopes (BV Pulsera, Philips, Bothell, WA) (Fig. 1). The subject was then asked to perform a single leg lunge, followed by rising-sitting from a chair after a 10 minute rest. Each subject performed the two activities at the speed they felt most comfortable with. In general, subjects practiced the activities a few times and then one cycle of each activity was recorded. This was done to minimize radiation exposure. Subjects were asked to repeat a particular activity only if there was a problem with quality of the acquired images or the telemetric data.
Figure 1.
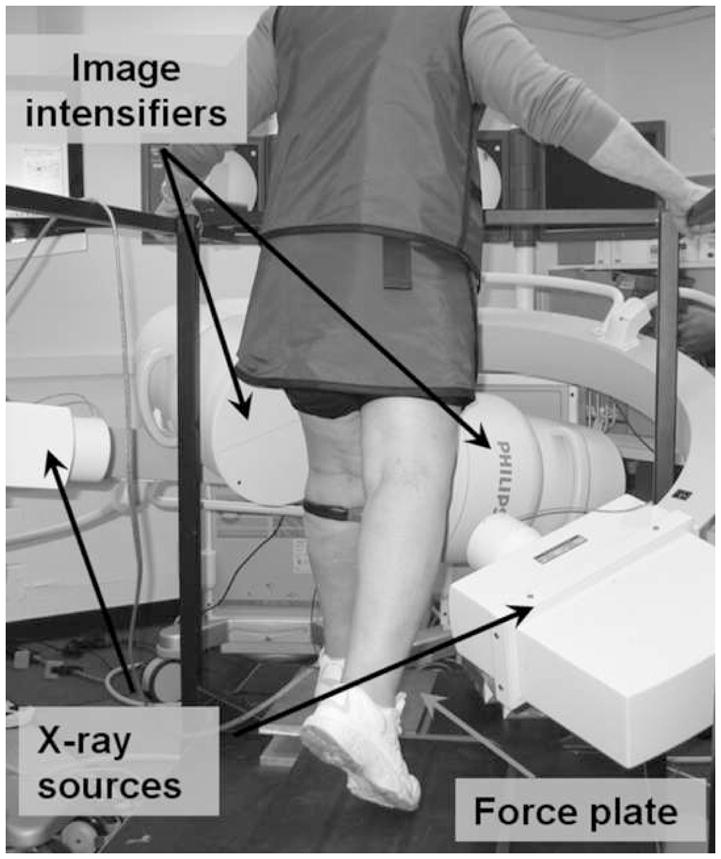
Subject positioned for performing single leg lunge with the reconstructed knee in field of view of the dual fluoroscopes.
In vivo tibiofemoral contact forces were obtained via telemetry from the instrumented implant while patients performed dynamic activities (D’Lima, et al., 2007); simultaneously, the patient’s knee was imaged with the fluoroscopes to determine 3D articular contact kinematics (Bingham, et al., 2008). The measured contact kinematics and forces were used to determine the tibiofemoral contact forces in the medial and lateral compartment.
Measurement of Articular Contact Kinematics
During the experiment, the fluoroscopes used 8 ms width X-ray pulses to acquire 30 images per second from the posteromedial and posterolateral directions (Li, et al., 2008). The acquired images and 3D models of the TKA components were then matched in six-DOF using an automatic matching algorithm (Bingham and Li, 2006). Our validation of this technique has shown that the method has accuracy better than 0.17 ± 0.13 mm in determination of dynamic TKA positions for speeds up to 250 mm/sec and better than 0.38 ± 0.24 mm for speeds up to 500 mm/sec (see Appendix A). Six-DOF knee kinematics was obtained by analyzing the relative positions of the femoral and tibial models (see Appendix B). The matched models were used to calculate the intersection between the femoral condyles and tibial polyethylene component surfaces. Contact locations were defined as the centroid of the intersection area between the femoral condyle and polyethylene articular surfaces.
Measurement of Tibiofemoral Forces
Design and calibration of the instrumented tibial implants have been described in detail by Kirking et al. (2006). The hollow stem of the tibial implant housed four three-element stacked rosette strain gauges, which were used to measure the forces and moments acting on the tibia. Average absolute errors of the instrumented implants were less than 3.9 N and 0.16 Nm.
The tibiofemoral contact forces were recorded as three force and three moment components. The origin of the instrumented implant was located at the intersection of the tibial tray and the axis of the tibial stem. The center of pressure (CoP) for the tibiofemoral joint was calculated as a point on a transverse plane, such that the forces and moments measured at the origin of the instrumented implant would be equivalent to a pure contact force at this point. The transverse plane was defined as a plane parallel to the tibial plateau and at a height equal to average thickness of the polyethylene component.
Calculation of Mediolateral Axial Force Distribution
The mediolateral axial force distribution was determined using the measured axial contact forces and location of articular contacts. If the centroids of the contact areas are assumed to represent the contact force locations on the polyethylene surfaces (Fig. 2A), the axial contact forces on the medial and lateral surfaces can be calculated by solving two algebraic equations. The first equation states that the sum of the medial (F⃗axial,medial) and lateral forces (F⃗axial,lateral) equals the net measured axial force (F⃗axial,net, Equation 1).
Figure 2.
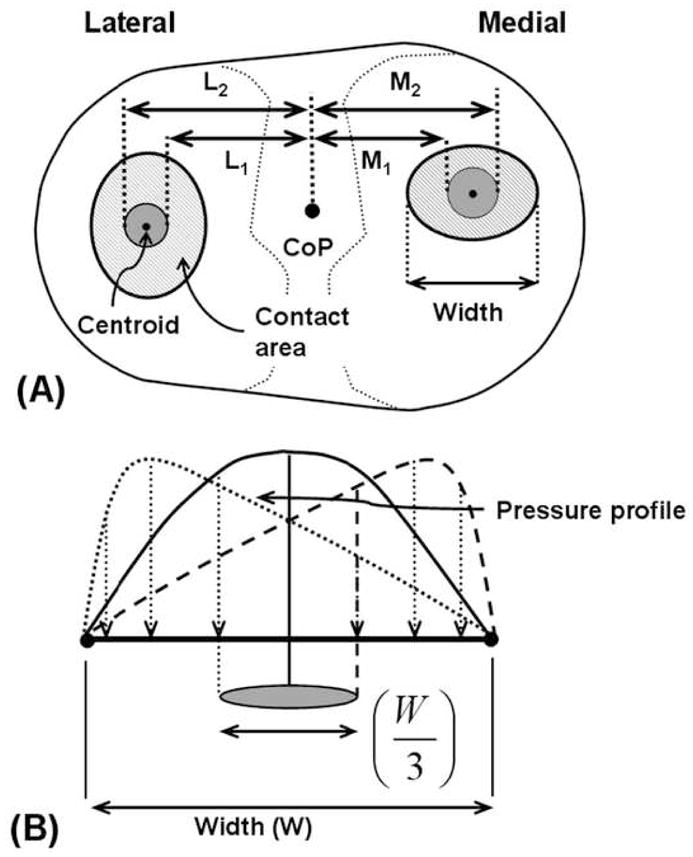
Schematic showing (A) the mediolateral limits (shaded grey) within which medial / lateral (M/L) contact force application points can be located and (B) the extreme case of contact pressure distribution, where pressure is maximum at one edge of the contact and minimum at the opposite edge. For this case the contact force application point is located a distance ± W/6 from the contact centroid.
| (Equation 1) |
The second equation draws upon the fact that sum of the anteroposterior moments of the medial and lateral force at the CoP is zero (Equation 2). The medial/lateral moment vector is calculated as the cross product of the vector joining the CoP to the centroid of the medial/lateral contact area (r⃗medial,COP, r⃗lateral,COP), and the medial/lateral force vector (F⃗axial,medial/F⃗axial,lateral). The component of the moment vector in the anteroposterior direction is defined as the anteroposterior moment; denoted by subscript AP in Equation 2.
| (Equation 2) |
If the pressure profile is symmetric about the contact area centroid, the corresponding contact force will pass through the centroid. However, in reality the centroids of the contact areas might not represent the contact force application point. For a non-symmetric pressure profile, the net contact force can be located away from the centroid. The uncertainty in contact force location can be estimated by assuming an extreme case of the pressure distribution, where pressure is maximal at one edge of the contact and minimal at the opposite edge (Fig. 2B). For this extreme case, the contact force application point is located a distance ± W/6 from the contact centroid. Where W is the mediolateral width of the contact. Thus, contact force is expected to lie within a region of mediolateral width W/3 (Fig 2). By considering the extreme cases, we also estimated the upper and lower bound of the contact forces.
Results
3D Articular Contact Kinematics
The peak knee flexion velocity during single leg lunge was 82°/s, 75°/s and 53°/s for patients 1, 2 and 3, respectively. During chair rising-sitting, the peak knee flexion velocity for patients 1, 2 and 3 was 118°/s, 102°/s and 73°/s, respectively. In both activities, the medial compartment contacts were located anterior (avg 10.1 mm) and slightly medial (avg 2.1 mm) to the compartment center for all patients (Fig. 3). Contacts in the medial compartment also showed limited anteroposterior and mediolateral excursions (avg 3.6 mm and 6.3 mm, respectively). In contrast, the lateral compartment contacts showed larger excursions (avg 11.3 and 13.1 mm in anteroposterior and mediolateral directions, respectively) and were both patient and activity specific.
Figure 3.
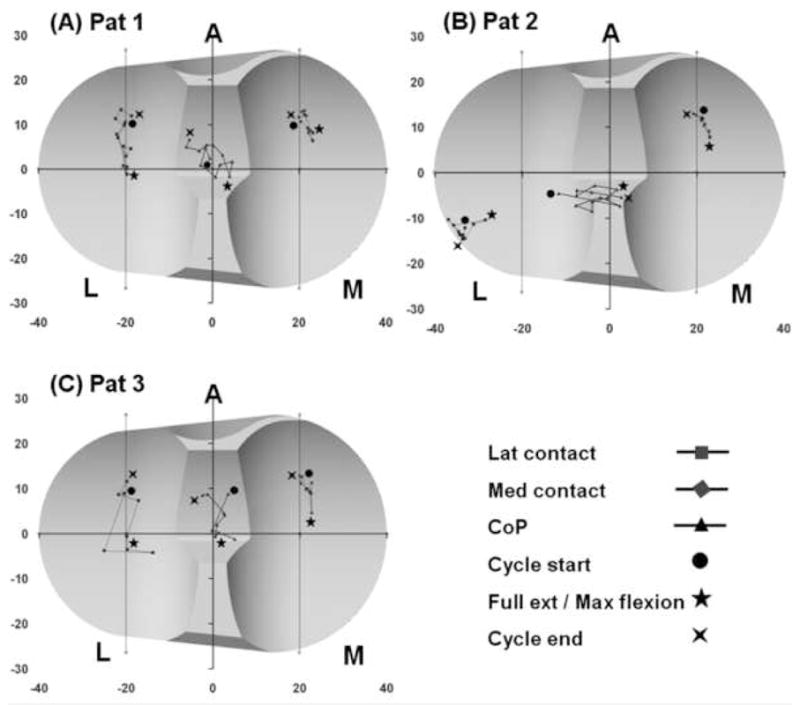
Patient specific tibiofemoral contact and center of pressure (CoP) locations during one cycle of single leg lunge.
Patient 1 (Figs. 3A and 4A)
Figure 4.

Patient specific tibiofemoral contact and center of pressure (CoP) locations during one cycle of chair rising-sitting.
During lunge, mediolateral excursion of lateral compartment contacts was 3.7 mm and anteroposterior excursion was 14.5 mm. During chair rising-sitting, mediolateral excursions of lateral contacts was 4.8 mm and anteroposterior excursion was 16.3 mm. Contact points in the lateral compartment showed greater posterior excursion than points in the medial compartment (avg 15.4 mm vs. 7.2 mm), indicating internal rotation of the tibia with a medial pivot (Appendix B).
Patient 2 (Figs. 3B and 4B)
The lateral compartment contacts were located near the posterolateral edge of the polyethylene component. The lateral contact points showed 4.4 mm of anteroposterior excursion during lunge and 10.8 mm during chair rising-sitting, and were also much more posteriorly positioned than contacts in the medial compartment. This was consistent with the constant internal tibial rotation seen for this patient (Appendix B). The mediolateral excursion of the lateral contacts was 8.4 mm during lunge and 13.1 mm during chair rising-sitting activities. Corresponding value for medial contacts was 3.9 mm during both activities.
Patient 3 (Figs. 3C and 4C)
Lateral compartment contact locations varied about the compartment center. During lunge, mediolateral and anteroposterior excursions of the lateral compartment contacts were 11.1 mm and 15.8 mm, respectively. During chair rising-sitting the corresponding values were 26.5 mm and 16.6 mm. This was again consistent with femoral rollback and internal rotation of the tibia with a medial pivot (Appendix B).
Tibiofemoral Articular Contact Forces
Patient specific tibiofemoral articular contact forces were represented by the locations (CoP) (Figs. 3 and 4), magnitudes (Fig. 5) and orientations (Fig. 6) of the net contact force. The CoP moved along anteroposterior and mediolateral directions with knee flexion and extension, as did the contact points. In general, the CoP was always between the corresponding medial and lateral contact points.
Figure 5.
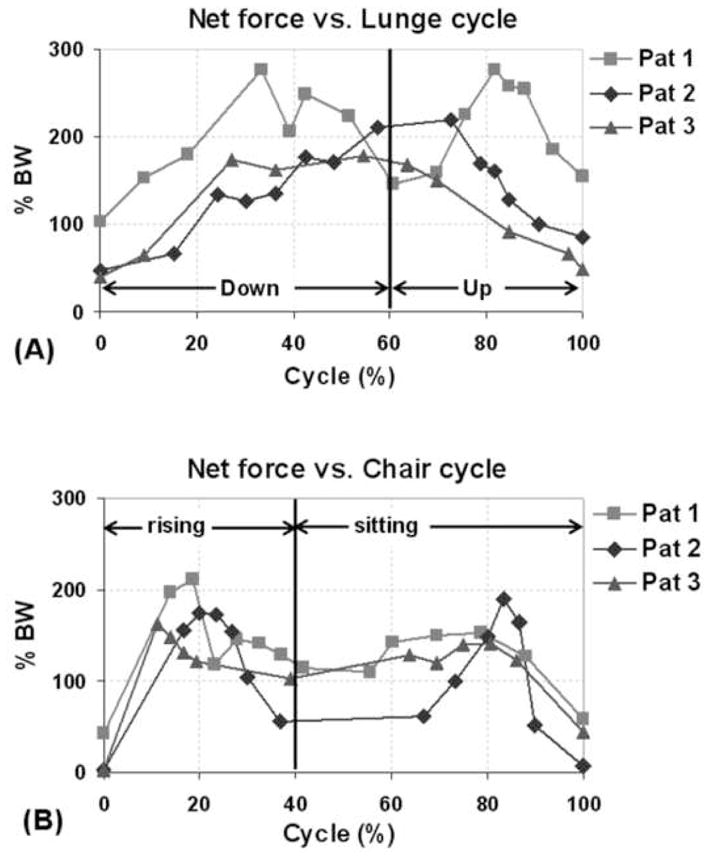
Net articular contact forces during one cycle of (A) single leg lunge and (B) chair rising-sitting.
Figure 6.
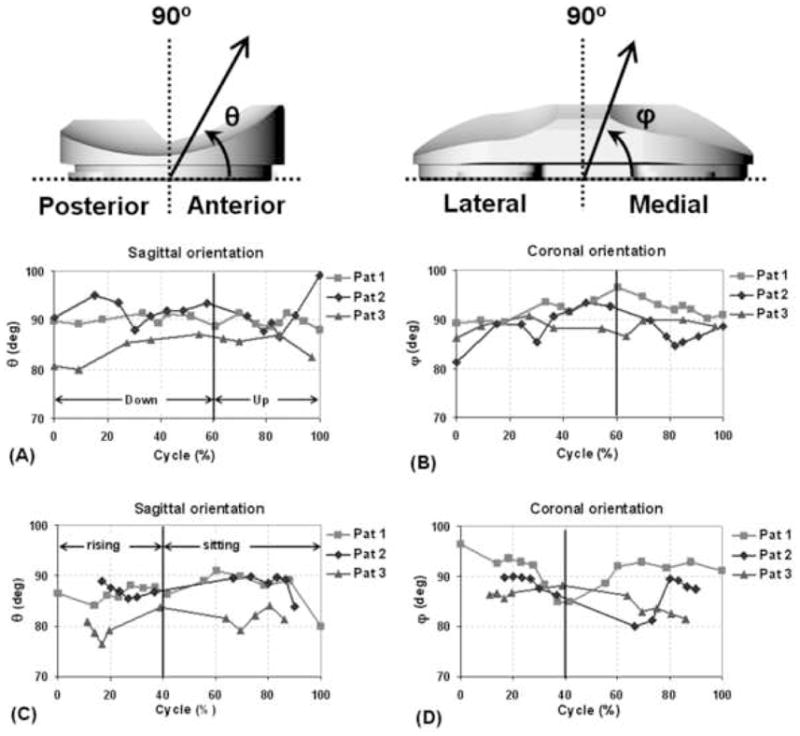
Sagittal and coronal plane orientations of net contact force during one cycle of (A,B) single leg lunge and (C,D) chair rising-sitting.
For all patients, the peak net contact force was higher during lunge compared to chair rising-sitting (Fig. 5). During lunge, patient 1 showed peak net contact force of about 277% BW at 33% and 82% of the cycle. Patient 2 showed peak contact force of about 215% BW between 58% and 73% of the cycle. Patient 3 showed peak contact force of about 170% BW between 27% and 64% of the cycle. For chair rising-sitting, all patients showed two peaks in net force. The corresponding peak values were 183% BW (average) near early part of chair-rising (11–20% of cycle) and 161% BW (average) during late part of chair-sitting (78–83% of cycle).
The sagittal and coronal plane orientations of the contact forces for all patients varied less than 14° from the vertical to the tibial tray, during both activities (Fig. 6). For example, during chair rising-sitting, sagittal plane orientation for patient 1 varied between 80° and 90.9° and coronal plane orientation varied between 84.9° and 96.4°. Patient 2 showed sagittal plane orientations ranging from 83.9° to 89.7°, and coronal plane orientations ranging from 80.0° to 90.0°. In patient 3, sagittal plane orientations ranged between 76.3° and 83.9°, while coronal plane orientations ranged between 81.5° and 88.1°. These variations in the sagittal and coronal plane orientations of the net contact force from the vertical to the tibial tray correspond to the anteroposterior and mediolateral components of the force, respectively. The anteroposterior force equals the net contact force multiplied by the cosine of its orientation in the sagittal plane. Similarly, the mediolateral force equals the net contact force multiplied by the cosine of its orientation in the coronal plane. The average of the peak anteroposterior and mediolateral contact forces in our study was 13.3% BW during lunge and 18.5% BW during chair rising-sitting.
Mediolateral Axial Force Distribution
The patient specific force distributions on the medial and lateral compartments were determined together with estimated upper and lower bounds. During the lunge activity, all patients showed nearly equitable mediolateral force distributions (Fig. 7). For the chair activity, all patients showed higher forces on the lateral compartment compared to medial compartment (Fig. 8), with average lateral contact force ratios of 61.7 ± 10.5%, 74.2 ± 12.6% and 71.8 ± 6.8% for patients 1, 2 and 3 respectively. The corresponding peak lateral to total force ratios were 80.5%, 95.6% and 78.6% respectively. For patients 1 and 2 the peak ratio was found close to full extension position (40% of cycle) and for patient 3 the peak ratio was seen at fully seated position (100% cycle).
Figure 7.
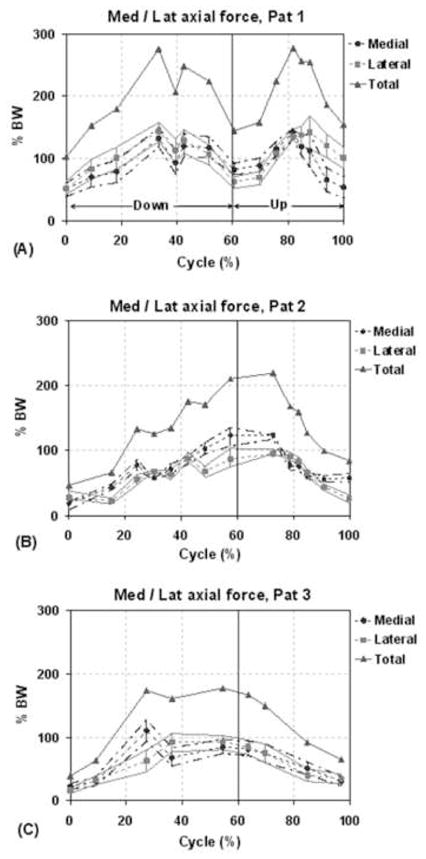
Distribution of axial force on medial and lateral compartments for each patient during one cycle of single leg lunge. The solid lines with triangles represent the total axial load acting at the knee (sum of medial and lateral loads). The dashed lines with the circles and squares correspond to the axial force at the medial and lateral compartment, respectively. The bars and the lines passing through the ends of the bars represent the upper and lower bounds on the estimates of the medial/lateral contact forces.
Figure 8.
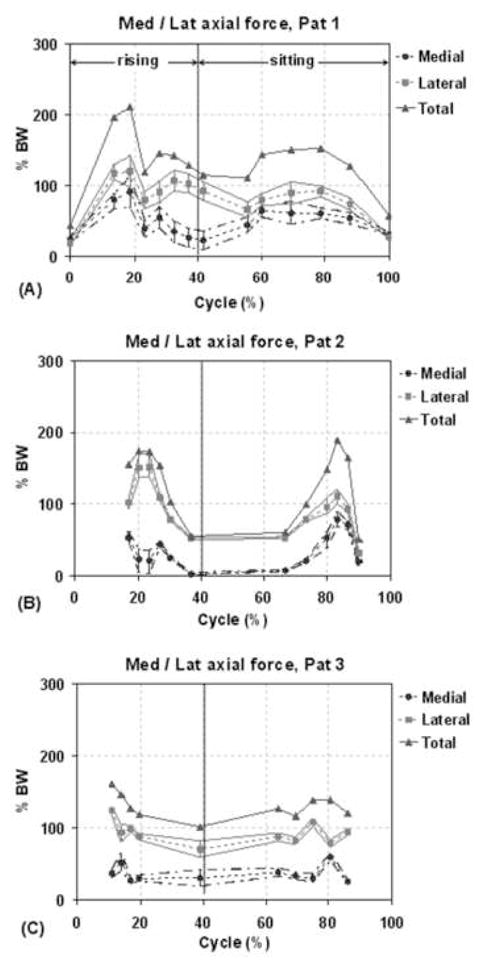
Distribution of axial force on medial and lateral compartments for each patient during one cycle of chair rising-sitting. The solid lines with triangles represent the total axial load acting at the knee (sum of medial and lateral loads). The dashed lines with the circles and squares correspond to the axial force at the medial and lateral compartment, respectively. The bars and the lines passing through the ends of the bars represent the upper and lower bounds on the estimates of the medial/lateral contact forces.
Discussion
Accurate knowledge of in vivo articular contact kinematics and contact forces at tibiofemoral interfaces has important implications for analyzing factors limiting longevity of TKA components, such as aseptic loosening of implants and polyethylene component wear (Au, et al., 2007, Liau, et al., 2002). Our study presented simultaneous measurement of tibiofemoral articular contact forces and 3D articular contact kinematics in 3 TKA patients. These measurements were made during dynamic single leg lunge and chair rising-sitting activities, using a dual fluoroscopic imaging system and instrumented tibial implants. The measured tibiofemoral contact forces and articular contact locations were also used to calculate axial force distributions on the medial and lateral compartments.
The medial compartment contacts of all patients were shown to undergo limited anteroposterior and mediolateral excursions (avg 3.7 mm and 6.4 mm) in both activities. In contrast, the lateral compartment contacts showed larger excursions in both anteroposterior and mediolateral directions (avg 11.3 and 13.1 mm) and were both patient and activity specific. In general, the larger anteroposterior excursions and more posterior location of contact points in the lateral compartment indicated an internal tibial rotation with a medial contact pivot during knee flexion. Bertin et al. and Li et al. reported similar observations of posterior excursions of articular contact points with increasing flexion (Bertin, et al., 2002, Li, et al., 2006). They also observed greater excursions of the lateral compartment contacts that were consistent with internal tibial rotation. This pattern of femoral rollback also occurs in the normal knee (Li, et al., 2005).
In patient 3 during the chair rising-sitting, we observed quick changes of tibiofemoral contact locations in mediolateral direction (points marked 1, 2). This phenomenon might imply a tibiofemoral contact “rocking” during motion. However, the quick changes in contact locations did not cause similar changes in the contact force locations as shown in Fig. 4C. These contact patterns were only found to correspond to small perturbations in varus-valgus rotations of the knee, as shown in Appendix B.
Larger contact forces were seen during the lunge activity compared to the chair rising-sitting. This was consistent with higher ground reaction forces measured during lunge (54.4 ± 11.0% BW, see Appendix B) compared to chair rising-sitting (38.0 ± 11.3 % BW). D’Lima et al. measured axial tibiofemoral forces in a patient and reported peak forces of 150% BW during chair rise (D’Lima, et al., 2006). In a more recent study, D’Lima et al. observed peak net force of 250% BW during chair rise in a patient with an instrumented implant (D’Lima, et al., 2007). This is consistent with the range of peak forces (164–212% BW) measured in the current study for the same activity. Zhao et al. reported in vivo axial forces of 220% BW in a patient during quasi-static lunge at maximum flexion (Zhao, et al., 2007). This is close to the range of axial forces at maximum flexion (158–210% BW) seen in the current study during dynamic lunge.
It is interesting to note that the measured tibiofemoral contact forces had varied application locations (CoP) during the two activities. In all patients during lunge, the CoPs were found near the central area of the tibial plateau surface. However, for patients 2 and 3 during chair rising-sitting, the CoPs were located in the lateral tibial plateau. For all patients and during both activities the contact force orientation changed relatively little from the vertical direction to the tibial plateau.
The average of peak anteroposterior and mediolateral forces in our study was 13.3% BW during lunge and 18.5% BW during chair rising-sitting. These values agree well with that of D’Lima et al. (2007) during chair rise (17% BW). In general the joint contact forces were both patient and activity specific. In addition to patient and activity, joint forces may also be affected by the component geometry and their implanted positions.
The contact force distributions between the medial and lateral compartments also varied between patients and activities. For the lunge activity, all patients showed nearly equitable mediolateral force distributions. However, for the chair activity all patients showed higher forces on the lateral compartment, with an average lateral to total force ratio of 68.7%. During chair activity, the medial contact force in patient 2 was close to zero near full extension. This indicated that the medial condyle of the patient had a trend towards to lift-off at full extension. However, this phenomenon was not seen during lunge activity.
Wear of tibial polyethylene component depends, among various other factors, on load distributions, component geometry and kinematics of the knee (Laz, et al., 2006, McEwen, et al., 2005). Increased sliding, particularly combined anteroposterior and mediolateral sliding, at the contact interface has been associated with increased wear (Blunn, et al., 1991, Fisher, et al., 2006, McEwen, et al., 2005, Todo, et al., 1999). Our study indicates that mediolateral force distributions are patient and activity specific. We noticed that a uniform force distribution, characterized by CoP located midway between medial and lateral contact points, was associated with minimal mediolateral contact location changes. However a non-uniform force distribution, characterized by CoP located closer to lateral contact points, was associated with increased mediolateral articulation on the lateral tibial plateau. This occurred for patients 2 and 3 during chair rising-sitting.
To delineate the indications on TKA component wear, other daily activities such as walking and their frequency should also be analyzed so that the loading history of TKA can be obtained. Recently, we have refined our dual fluoroscopic technique for the study of treadmill gait. The highly patient specific nature of the kinematics and force data and the small patient population precludes statements regarding the general TKA population. Nonetheless, the six-DOF kinematics (Appendix B) measured in this study are within range of values reported for larger populations of cruciate-retaining TKAs (Banks and Hodge, 2004, Hanson, et al., 2006). The estimation of mediolateral axial contact force distribution did not consider the possible polyethylene wear in the patients, which may also affect the force distribution. In future, a 3D finite element calculation should be developed in order to estimate the dynamic contact stress distributions in the tibial polyethylene component. Nevertheless, valuable new knowledge was gained for these patients in particular, and future studies can readily extend the methodology presented to a larger group of patients and other dynamic activities.
In conclusion, this study presented the first simultaneous in vivo measurement of six-DOF tibiofemoral forces and 3D articular contact kinematics in 3 TKA patients. These measurements were made during dynamic single leg lunge and chair rising-sitting, using dual fluoroscopic imaging and instrumented tibial implants. Contact kinematics data were in general consistent with internal tibial rotation about a medial pivot during flexion of the knee. The lunge activity was associated with a net joint contact force of 225% BW and the chair rising-sitting activity showed a net force of 188% BW. Articular contact forces and mediolateral distributions of axial force were both patient and activity specific. While axial loads were equitability distributed between the medial and lateral compartments during lunge, greater load was seen on the lateral compartment during chair rising-sitting. These data may enable more accurate reproduction of in vivo loads and articular motion patterns in wear simulators and finite element models (Zhao, et al., 2007). This in turn may help advance our understanding of factors limiting longevity of TKA implants, such as aseptic loosening and polyethylene component wear, and enable improved TKA designs (Au, et al., 2007, Liau, et al., 2002). Musculoskeletal models of the lower limb would also benefit from the availability of accurate data against which they can be validated (D’Lima, et al., 2006).
Supplementary Material
Figure A1. In-vitro setup for dynamic validation of DFIS. Cadaveric femur and tibia specimen were given pure translation (δ) along an arbitrary direction and pure rotation (θ) about the robot wrist.
Figure B1. Femoral and tibial coordinate systems used for calculation of six-DOF kinematics. Polyethylene component of tibia not shown in the figure.
Figure B2. Patient specific six-DOF kinematics during one cycle of single leg lunge (A–F) and chair rising sitting (G–L).
Figure B3. Net ground reaction force during one cycle of (A) single leg lunge and (B) chair rising-sitting.
Acknowledgments
The technical assistance of Nick Steklov, George Hanson, Jeremy Suggs, Ali Hosseini, Jeffrey Bingham, Samuel Van de Velde and Ramprasad Papannagari was greatly appreciated.
APPENDIX A - Validation of the Dual Fluoroscopic Imaging System (DFIS) for Measurement of Dynamic TKA Motion
The DFIS has been extensively validated in determination of quasi-static TKA motion (Bingham and Li, 2006, Hanson, et al., 2006). This study validated the DFIS for measurement of dynamic TKA motion. A cadaveric human specimen with a cruciate retaining TKA component (NexGen CR Flex, Zimmer, Warsaw, IN) was moved by a robotic system (Most, et al., 2003) within the field of view of the two fluoroscopes (Fig. A1). The robot moved the knee at known translational and rotational velocities. The displacements and velocities were reproduced from the dual fluoroscopic images using previously described image matching method (Hanson, et al., 2006) and compared to robot-determined values. The robot has a position repeatability of 0.1 mm at slow speeds and better than 0.3 mm at fully loaded, high speed (>1000 mm/s) conditions (Most, 2000, Most, et al., 2003).
The specimens were given a constant translation (δ) along an arbitrary direction or a constant rotation (θ) about the robot wrist, at different speeds. Simultaneously, the specimen was imaged by the dual fluoroscopes at 30 frames per second at a frame rate of 125 Hz (Fig. A1). For validation of image matching, at each speed of the robot four sets of fluoroscopic images were chosen such that the expected displacement between images was identical at all speeds. These images were segmented and matched to calculate three values for image-to-image displacements and velocities using our image matching method. For each set of images, the matching process was repeated five times. The obtained distance and velocity data were compared to those determined by the robot. Tests with translations were carried out at four speeds; 50, 125, 250 and 500 mm/s. Tests with pure rotations were carried out at 42.0°/s.
The results from the dynamic validation are shown in Table A1. The values in the table represent differences between displacements and velocities obtained from DFIS and the robotic manipulator. Root-mean-square differences (RMSD) are obtained by averaging the squared sum of differences, and taking a square root. While standard deviation represents the variations about the mean value, RMSD represents the variations about the expected value. The expected value is that specified via the robot for translations and the slow speed DFIS values for rotations. Thus, for translations the expected velocities are 50, 125, 250 and 500 mm/s, and expected displacements are 16.67 mm. For rotations the expected velocities are 41.7°/s and 41.9°/s for the femur and tibia, respectively. Expected displacements are 4.17° and 4.19°, respectively.
For pure translations of the femur, at speeds less than 250mm/s, differences in displacements are less than 0.04 ± 0.06 mm and differences in velocities are less than 0.79 ± 1.91 mm/s. At 500 mm/s the differences in displacements are less than 0.33 ± 0.16 mm and differences in velocities are less than 9.91 ± 4.66 mm/s. For pure rotations of the femur, differences in displacements are less than 0.05 ± 0.04° and differences in velocities are less than 0.29 ± 0.45°/s. For pure translations of the tibia, at speeds less than 250mm/s, differences in displacements are less than 0.17 ± 0.13 mm and differences in velocities are less than −1.32 ± 1.31 mm/s. At 500 mm/s the differences in displacements are less than 0.38 ± 0.24 mm and differences in velocities are less than 11.34 ± 7.17 mm/s. For pure rotations of the tibia, differences in displacements are less than −0.01 ± 0.05° and differences in velocities are less than −0.21 ± 0.47°/s.
The purpose of this validation was to quantify the accuracy of the DFIS in measuring dynamic TKA motion. The reported differences between expected and DFIS values for tests with pure translations, relates to its accuracy in measuring proximal-distal, mediolateral and anteroposterior translations and translation velocities. Similarly, differences between expected and DFIS values for tests with pure rotations, corresponds to its accuracy in determining flexion, internal-external and varus-valgus rotations and rotation velocities.
Appendix A – References
- Bingham J, Li G. An optimized image matching method for determining in-vivo TKA kinematics with a dual-orthogonal fluoroscopic imaging system. Journal of Biomechanical Engineering. 2006;128:588–95. doi: 10.1115/1.2205865. [DOI] [PubMed] [Google Scholar]
- Hanson GR, Suggs JF, Freiberg AA, Durbhakula S, Li G. Investigation of in vivo 6DOF total knee arthoplasty kinematics using a dual orthogonal fluoroscopic system. Journal of Orthopaedic Research. 2006;24:974–81. doi: 10.1002/jor.20141. [DOI] [PubMed] [Google Scholar]
- Most E. Development of 6-DOF Robotic Test System for Studying the Biomechanics of Total Knee Replacement. Master of Science, Massachusetts Institute of Technology; 2000. [Google Scholar]
- Most E, Zayontz S, Li G, Otterberg E, Sabbag K, Rubash HE. Femoral rollback after cruciate-retaining and stabilizing total knee arthroplasty. Clinical Orthopaedics and Related Research. 2003:101–13. doi: 10.1097/01.blo.0000062380.79828.2e. [DOI] [PubMed] [Google Scholar]
APPENDIX B - Six-DOF kinematics and ground reaction forces
Six- DOF kinematics
The dynamic motion of the knee was reproduced as a series of 3D TKA models matched to fluoroscopic images. This series of matched TKA components was used to calculate 6DOF knee kinematics. A joint coordinate system was established first (Fig. B1). The y-axis (flexion-extension axis) of the femoral component was defined as a line connecting the tips of the two femoral pegs. The x-axis (internal-external axis) was defined as a line though the mid-point of y-axis and parallel to the pegs. The z-axis (varus-valgus axis) was defined as a cross-product of x and y axis. For the tibial component, the z axis is defined as line of symmetry on the base of the polyethylene component. The y-axis is defined to be perpendicular to the z axis in the plane of the polythene base and passing through its center. The x-axis was defined as the cross-product of y- and z-axes. For each subject, the kinematics was calculated with respect to a reference position. This position was defined such that the femoral component contacted the polyethylene surface at its lowest point and the femoral and tibial (x) axes were parallel to each other.
Translations in the anteroposterior (AP), mediolateral (ML) and proximal-distal (PD) directions are calculated as translations of the origin of the femoral axis with respect to its reference position. Flexion-extension (FE), internal-external (IE) and varus-valgus (VV) rotations are calculated as Euler rotations of femur with respect to reference axes, assuming a YZX rotation sequence. Internal-external rotations are viewed as rotations of tibia with respect to the femur.
During the dynamic lunge, all patients flexed their knee to about 90° and then extended back to full extension (Fig. B2-A). The average peak flexion speed was 42°/s and occurred at 30% of the cycle (55° flexion). Extension speed varied more among patients, but on average the peak speed was 70°/s and occurred at 81% of cycle (55° flexion). Patient 3 had the lowest speed compared to other patients. The general trends in 6DOF kinematics were similar for all patients but had varied magnitudes (Figs. B2-A to F). In particular, patient 2 showed a relatively constant internally rotated position.
During chair rising-sitting, all subjects extended their knee to full extension during rising and then flexed back to about 90° in sitting (Fig. B2-G). During rising, the peak speed reached on average 97°/s and occurred at 23% of the cycle (56° flexion). In sitting the average peak speed was about 63°/s, occurring at 68% of the cycle (50° flexion). Again, patient 3 had the lowest speed. While the trends in kinematics were similar among patients, the magnitudes were varied (Figs. B2-G to L). Patient 2 again showed less change in IE rotation compared to other patients.
Ground reaction forces
During the dynamic lunge and chair rising-sitting tests, a force plate constructed using a 6DOF load cell (JR3, Inc. Woodland, CA) was used to measure ground reaction forces. The net ground reaction forces of patients 1 and 3 increased with flexion during lunge and reached a peak value of about 77% BW (Fig. B3-A). Thereafter the forces remained relatively constant until about 83% of the cycle and then decreased as the knee extended to full extension. Patient 2 maintained a relatively constant ground reaction force (48 to 57% BW) throughout the lunge activity.
During chair rising-sitting, all patients showed increase in ground reaction force as the knee extended to 25% of the cycle and then kept relatively constant until 83% of the cycle (Fig. B3-B). On average, patients showed ground reaction forces less than 50% BW during this activity.
Footnotes
Conflict of Interest Statement
This work was partially supported by the Orthopaedic Department at Massachusetts General Hospital, research grant from Zimmer Inc. and National Institutes of Health (R21 EB00458, DDL). None of the investigators have any role as consultants to corporate sources that would lead to a conflict of interest.
Publisher's Disclaimer: This is a PDF file of an unedited manuscript that has been accepted for publication. As a service to our customers we are providing this early version of the manuscript. The manuscript will undergo copyediting, typesetting, and review of the resulting proof before it is published in its final citable form. Please note that during the production process errors may be discovered which could affect the content, and all legal disclaimers that apply to the journal pertain.
References
- Au AG, James Raso V, Liggins AB, Amirfazli A. Contribution of loading conditions and material properties to stress shielding near the tibial component of total knee replacements. Journal of Biomechanics. 2007;40:1410–6. doi: 10.1016/j.jbiomech.2006.05.020. [DOI] [PubMed] [Google Scholar]
- Banks SA, Hodge WA. Implant design affects knee arthroplasty kinematics during stair-stepping. Clinical Orthopaedics and Related Research. 2004:187–93. doi: 10.1097/01.blo.0000138956.04316.ac. [DOI] [PubMed] [Google Scholar]
- Bertin KC, Komistek RD, Dennis DA, Hoff WA, Anderson DT, Langer T. In vivo determination of posterior femoral rollback for subjects having a NexGen posterior cruciate-retaining total knee arthroplasty. Journal of Arthroplasty. 2002;17:1040–8. doi: 10.1054/arth.2002.35793. [DOI] [PubMed] [Google Scholar]
- Bingham J, Li G. An optimized image matching method for determining in-vivo TKA kinematics with a dual-orthogonal fluoroscopic imaging system. Journal of Biomechanical Engineering. 2006;128:588–95. doi: 10.1115/1.2205865. [DOI] [PubMed] [Google Scholar]
- Blunn GW, Joshi AB, Minns RJ, Lidgren L, Lilley P, Ryd L, Engelbrecht E, Walker PS. Wear in retrieved condylar knee arthroplasties. A comparison of wear in different designs of 280 retrieved condylar knee prostheses. Journal of Arthroplasty. 1997;12:281–90. doi: 10.1016/s0883-5403(97)90024-3. [DOI] [PubMed] [Google Scholar]
- Blunn GW, Walker PS, Joshi A, Hardinge K. The dominance of cyclic sliding in producing wear in total knee replacements. Clinical Orthopaedics and Related Research. 1991:253–60. [PubMed] [Google Scholar]
- Callaghan JJ, O’Rourke MR, Saleh KJ. Why knees fail: lessons learned. Journal of Arthroplasty. 2004;19:31–4. doi: 10.1016/j.arth.2004.02.015. [DOI] [PubMed] [Google Scholar]
- Crowninshield RD, Brand RA. A physiologically based criterion of muscle force prediction in locomotion. Journal of Biomechanics. 1981;14:793–801. doi: 10.1016/0021-9290(81)90035-x. [DOI] [PubMed] [Google Scholar]
- Currier JH, Bill MA, Mayor MB. Analysis of wear asymmetry in a series of 94 retrieved polyethylene tibial bearings. Journal of Biomechanics. 2005;38:367–75. doi: 10.1016/j.jbiomech.2004.02.016. [DOI] [PubMed] [Google Scholar]
- D’Lima DD, Patil S, Steklov N, Chien S, Colwell CW., Jr In vivo knee moments and shear after total knee arthroplasty. Journal of Biomechanics. 2007;40:S11–17. doi: 10.1016/j.jbiomech.2007.03.004. [DOI] [PubMed] [Google Scholar]
- D’Lima DD, Patil S, Steklov N, Slamin JE, Colwell CW., Jr Tibial forces measured in vivo after total knee arthroplasty. Journal of Arthroplasty. 2006;21:255–62. doi: 10.1016/j.arth.2005.07.011. [DOI] [PubMed] [Google Scholar]
- Fisher J, McEwen H, Tipper J, Jennings L, Farrar R, Stone M, Ingham E. Wear-simulation analysis of rotating-platform mobile-bearing knees. Orthopedics. 2006;29:S36–41. [PubMed] [Google Scholar]
- Hanson GR, Park SE, Suggs JF, Moynihan AL, Nha KW, Freiberg AA, Li G. In vivo kneeling biomechanics after posterior stabilized total knee arthroplasty. Journal of Orthopaedic Science. 2007;12:476–83. doi: 10.1007/s00776-007-1165-7. [DOI] [PubMed] [Google Scholar]
- Hanson GR, Suggs JF, Freiberg AA, Durbhakula S, Li G. Investigation of in vivo 6DOF total knee arthoplasty kinematics using a dual orthogonal fluoroscopic system. Journal of Orthopaedic Research. 2006;24:974–81. doi: 10.1002/jor.20141. [DOI] [PubMed] [Google Scholar]
- Kaufman KR, Kovacevic N, Irby SE, Colwell CW. Instrumented implant for measuring tibiofemoral forces. Journal of Biomechanics. 1996;29:667–71. doi: 10.1016/0021-9290(95)00124-7. [DOI] [PubMed] [Google Scholar]
- Laz PJ, Pal S, Fields A, Petrella AJ, Rullkoetter PJ. Effects of knee simulator loading and alignment variability on predicted implant mechanics: a probabilistic study. Journal of Orthopaedic Research. 2006;24:2212–21. doi: 10.1002/jor.20254. [DOI] [PubMed] [Google Scholar]
- Li G, DeFrate LE, Park SE, Gill TJ, Rubash HE. In vivo articular cartilage contact kinematics of the knee: an investigation using dual-orthogonal fluoroscopy and magnetic resonance image-based computer models. American Journal of Sports Medicine. 2005;33:102–7. doi: 10.1177/0363546504265577. [DOI] [PubMed] [Google Scholar]
- Li G, Kaufman KR, Chao EY, Rubash HE. Prediction of antagonistic muscle forces using inverse dynamic optimization during flexion/extension of the knee. Journal of Biomechanical Engineering. 1999;121:316–22. doi: 10.1115/1.2798327. [DOI] [PubMed] [Google Scholar]
- Li G, Suggs J, Hanson G, Durbhakula S, Johnson T, Freiberg A. Three-dimensional tibiofemoral articular contact kinematics of a cruciate-retaining total knee arthroplasty. Journal of Bone and Joint Surgery - American. 2006;88:395–402. doi: 10.2106/JBJS.D.03028. [DOI] [PubMed] [Google Scholar]
- Li G, Van de Velde S, Bingham J. Validation of a Non-invasive Fluoroscopic Imaging Technique for the Measurement of Dynamic Knee Joint Motion. Journal of Biomechanics. 2008 doi: 10.1016/j.jbiomech.2008.01.034. (in press), available online. [DOI] [PubMed] [Google Scholar]
- Liau JJ, Cheng CK, Huang CH, Lo WH. The effect of malalignment on stresses in polyethylene component of total knee prostheses--a finite element analysis. Clinical Biomechanics (Bristol, Avon) 2002;17:140–6. doi: 10.1016/s0268-0033(01)00109-7. [DOI] [PubMed] [Google Scholar]
- McEwen HM, Barnett PI, Bell CJ, Farrar R, Auger DD, Stone MH, Fisher J. The influence of design, materials and kinematics on the in vitro wear of total knee replacements. Journal of Biomechanics. 2005;38:357–65. doi: 10.1016/j.jbiomech.2004.02.015. [DOI] [PubMed] [Google Scholar]
- Nicholls RL, Schirm AC, Jeffcote BO, Kuster MS. Tibiofemoral force following total knee arthroplasty: Comparison of four prosthesis designs in vitro. Journal of Orthopaedic Research. 2007;25:1506–12. doi: 10.1002/jor.20438. [DOI] [PubMed] [Google Scholar]
- Stiehl JB, Dennis DA, Komistek RD, Crane HS. In vivo determination of condylar lift-off and screw-home in a mobile-bearing total knee arthroplasty. Journal of Arthroplasty. 1999;14:293–9. doi: 10.1016/s0883-5403(99)90054-2. [DOI] [PubMed] [Google Scholar]
- Suggs JF, Hanson G, Park SE, Moynihan AL, Freiberg A, Li G. Patient’s function after a posterior stabilizing total knee arthroplasty: cam-post engagement and knee kinematics. Knee Surgery, Sports Traumatology, Arthroscopy. 2008 doi: 10.1007/s00167-007-0467-9. In press. [DOI] [PubMed] [Google Scholar]
- Taylor SJ, Walker PS, Perry JS, Cannon SR, Woledge R. The forces in the distal femur and the knee during walking and other activities measured by telemetry. Journal of Arthroplasty. 1998;13:428–37. doi: 10.1016/s0883-5403(98)90009-2. [DOI] [PubMed] [Google Scholar]
- Taylor WR, Heller MO, Bergmann G, Duda GN. Tibio-femoral loading during human gait and stair climbing. Journal of Orthopaedic Research. 2004;22:625–32. doi: 10.1016/j.orthres.2003.09.003. [DOI] [PubMed] [Google Scholar]
- Todo S, Tomita N, Kitakura T, Yamano Y. Effect of sliding locus on subsurface crack formation in ultra-high-molecular-weight polyethylene knee component. Bio-Medical Materials and Engineering. 1999;9:13–20. [PubMed] [Google Scholar]
- Wright TM, Rimnac CM, Stulberg SD, Mintz L, Tsao AK, Klein RW, McCrae C. Wear of polyethylene in total joint replacements. Observations from retrieved PCA knee implants. Clinical Orthopaedics and Related Research. 1992:126–34. [PubMed] [Google Scholar]
- Zhao D, Banks SA, D’Lima DD, Colwell CW, Jr, Fregly BJ. In vivo medial and lateral tibial loads during dynamic and high flexion activities. Journal of Orthopaedic Research. 2007;25:593–602. doi: 10.1002/jor.20362. [DOI] [PubMed] [Google Scholar]
Associated Data
This section collects any data citations, data availability statements, or supplementary materials included in this article.
Supplementary Materials
Figure A1. In-vitro setup for dynamic validation of DFIS. Cadaveric femur and tibia specimen were given pure translation (δ) along an arbitrary direction and pure rotation (θ) about the robot wrist.
Figure B1. Femoral and tibial coordinate systems used for calculation of six-DOF kinematics. Polyethylene component of tibia not shown in the figure.
Figure B2. Patient specific six-DOF kinematics during one cycle of single leg lunge (A–F) and chair rising sitting (G–L).
Figure B3. Net ground reaction force during one cycle of (A) single leg lunge and (B) chair rising-sitting.


