Abstract
Neurons from layer II of the medial entorhinal cortex show subthreshold membrane potential oscillations (SMPOs) which could contribute to theta-rhythm generation in the entorhinal cortex and to generation of grid cell firing patterns. However, it is unclear whether single neurons have a fixed unique oscillation frequency or whether their frequency varies depending on the mean membrane potential in a cell. We therefore examined the frequency of SMPOs at different membrane potentials in layer II stellate-like cells of the rat medial entorhinal cortex in vitro. Using whole-cell patch recordings, we found that the fluctuations in membrane potential show a broad band of low power frequencies near resting potential that transition to more narrowband oscillation frequencies with depolarization. The transition from broadband to narrowband frequencies depends on the location of the neuron along the dorsoventral axis in the entorhinal cortex, with dorsal neurons transitioning to higher-frequency oscillations relative to ventral neurons transitioning to lower-frequency oscillations. Once SMPOs showed a narrowband frequency, systematic frequency changes were not observed with further depolarization. Using a Hodgkin–Huxley-style model of membrane currents, we show that differences in the influence of depolarization on the frequency of SMPOs at different dorsal to ventral positions could arise from differences in the properties of the h current. The properties of frequency changes in this data are important for evaluating models of the generation of grid cell firing fields with different spacings along the dorsal-to-ventral axis of medial entorhinal cortex.
Introduction
Recent studies on the medial entorhinal cortex showed a range of physiological differences along the dorsal-to-ventral axis. These studies started with the demonstration in awake, behaving rats that the firing fields of grid cells are smaller and closer to each other in dorsal medial entorhinal cortex and become progressively larger and farther apart more ventrally (Hafting et al., 2005; Sargolini et al., 2006; Brun et al., 2008). A model of grid cells based on oscillatory interference generated the explicit prediction that the intrinsic oscillation frequency of neurons should decrease along the dorsal-to-ventral axis (Burgess et al., 2005; O'Keefe and Burgess, 2005; Burgess et al., 2007). This prediction was confirmed by the experimental demonstration that the frequency of intracellular subthreshold membrane potential oscillations (SMPOs) and resonance decreases along the dorsal-to-ventral axis (Giocomo et al., 2007). This effect has been replicated (Giocomo and Hasselmo, 2008b, 2009; Boehlen et al., 2010; Heys et al., 2010) and extended to include increases in temporal summation of synaptic potentials along the dorsal-to-ventral axis (Garden et al., 2008).
The differences described above primarily focus on measurements of oscillation frequency at a single membrane potential in a single neuron. However, the model of grid cells described above requires that the oscillation frequency change with running velocity of the rat, presumably via a depolarization of neuronal membrane potential due to synaptic input from cells coding head direction and running speed (Burgess et al., 2007; Hasselmo et al., 2007). The model therefore predicts that the difference in grid cell spacing along the dorsal–ventral axis should arise from a difference in the slope of frequency to membrane potential (Burgess et al., 2007; Hasselmo et al., 2007).
We designed the current study to test the prediction that the slope of frequency to membrane potential within single cells should differ for cells at different dorsal to ventral anatomical locations. In a previous study, comparison of oscillation frequency in different neurons at different membrane potentials did show a difference in the slope of this relationship in dorsal versus ventral cells (Giocomo and Hasselmo, 2008a), but it is important to emphasize that this previous measurement was across different neurons, rather than varying membrane potential within a single neuron. Here we analyze the change in SMPO frequency in single neurons at different membrane potentials induced by different magnitudes of current injection, either during long steps or during a changing ramp. An early study suggested there was a large increase of SMPO frequency with depolarization in the entorhinal stellate cells (SCs) (Alonso and Klink, 1993), whereas later studies have suggested that, on average, there is little change in the resonance frequency at different membrane potentials and a slight increase in natural frequency with depolarization (Erchova et al., 2004). The present study directly addresses the properties of SMPOs at different membrane potentials in entorhinal cortex layer II stellate-like cells, using both whole-cell patch recording in vivo and biophysical modeling in compartmental simulations of entorhinal stellate cells.
Materials and Methods
Slice preparation.
We tested the effects of membrane potential on subthreshold oscillation frequency using whole-cell patch recordings in individual stellate-like cells in slices obtained at different dorsal to ventral anatomical positions in the medial entorhinal cortex. All experimental protocols were approved by the Institutional Animal Care and Use Committee at Boston University. Long–Evans rats of either sex (postnatal days 17 to 25; Charles River) were deeply anesthetized with isoflurane (Abbot Laboratories). After the absence of both pedal and tail pinch reflex was confirmed, the brain was removed and placed in ice-cold ACSF containing the following (in mm): 124 NaCl, 3 KCl, 1.25 NaH2PO4, 26 NaHCO3, 1.6 CaCl2, 1.8 MgSO4, and 10 glucose, pH adjusted to 7.4 by saturation with 95% O2/5% CO2. Slices (350 μm thick) were cut horizontally using a tissue slicer (World Precision Instruments Vibroslicer or Leica VT 1000). After cutting, the slices were transferred to a holding chamber, where they were kept submerged at 30°C for 30 min and then at room temperature for at least another 30 min before transfer to the recording chamber. The holding chamber was filled with the ACSF.
Electrophysiological recording.
For recording, slices were transferred to a submerged recording chamber and superfused with ACSF, maintaining the temperature between 34 and 36°C for recordings. Patch pipettes were fabricated from borosilicate glass capillaries by means of a P-87 horizontal puller (Sutter Instrument). Patch pipettes were filled with intracellular solution containing the following (in mm): 120 K-gluconate, 10 HEPES, 0.2 EGTA, 20 KCl, 2 MgCl, 7 phosphocreatine-diTris, 4 Na2ATP, and 0.3 TrisGTP, pH adjusted to 7.3 with KOH. Both cAMP and cGMP modulate the h current (Pape and Mager, 1992; Richter et al., 2000). To prevent the rundown of the h current due to alteration of the intracellular fluid, our intracellular solution contained ATP and GTP. The intracellular solution also contained 0.1% biocytin for the purpose of labeling. When filled with this solution, the patch pipettes had a resistance of 3–5 MΩ. Slices were visualized with an upright microscope (Zeiss Axioskop 2), equipped with a 40× water-immersion objective lens and a near-infrared charge-coupled device camera (JAI CV-M50IR). Tight seals (>1 GΩ) were formed on cell bodies, and the membrane was ruptured with negative pressure. Current-clamp recordings were made with a Multi Clamp 700B amplifier (Molecular Devices) using built-in bridge balance and capacitance compensation circuits. Signals were low-pass filtered at 5 or 10 kHz and sampled at 10 or 20 kHz, respectively, using Clampex 9.0 software (Molecular Devices). A liquid junction potential of 10 mV was not corrected.
The peak frequency of oscillations at different membrane potentials was tested with two different experimental designs. In the first design, the membrane potential was shifted with stepwise transitions in current injection. The experiment would start with the membrane potential at near resting potential, and then small stepwise increases in current injection (of a magnitude of 20 to 100 pA) would be implemented to move the mean membrane potential progressively toward firing threshold over a period of about 3 min. Once the firing threshold was reached and the cell was firing continuously at low frequency (<1 Hz), the experiment would be terminated and sometimes repeated.
In the second design, a rising and falling ramp of current injection was presented. In the rising ramp protocol, current injection was increased linearly by 40 pA over a duration of 90 s to reach the membrane potential where cells fired with a low frequency. In the falling ramp protocol, current was reduced by 40 pA over 90 s starting at the membrane potential where cells fired with a low frequency. The properties of membrane potential oscillations during this ramp were analyzed as described in the next section.
In both of the above experiments, proper series resistance compensation is crucial because miscompensation could cause an incorrect membrane potential reading during current injection. We compensated series resistance immediately before the stepwise current injection using 20-ms-long 20 pA current steps using the built-in bridge balance circuit of the amplifier. We recorded the membrane potential response to the same current step after compensation in each cell to detect any miscompensated recording. During the recording, we carefully watched for indication of a series resistance change such as a sudden jump of membrane potential, change in spike threshold, or change in spike height. Series resistance was recompensated after 15 min of recording. We did not detect a systematic or significant change in series resistance from this second compensation.
Data analysis.
Matlab (MathWorks, version 7.9) and Origin 6.1 (OriginLab) were used for data analysis. The peak frequency of membrane potential oscillations was computed using two different methods: fast Fourier transform (FFT) and autocorrelation, similar to the techniques used in previous recordings of stellate-like cells from this laboratory (Giocomo et al., 2007). For analysis of the oscillation frequency during stepwise increases in current injection, the membrane potential recordings were analyzed with a 6.56-s-long window that shifted continuously across the membrane potential trace. If the window contained a spike or injected current was altered by >10 pA within the window, it was not analyzed, resulting in blank segments in the analysis shown in the figures. The membrane potential from each step of the sliding window was analyzed with an FFT (using the fft command in Matlab) or using an autocorrelation (using Matlab's xcorr function). In the FFT, the power spectrum was smoothed, and a peak detection function was used to extract the peak frequency from the power spectra at each time point of the sliding window. In the autocorrelation, the frequency for each time point of the sliding window was determined as the inverse of the interval from the central maximum to the first-side local maximum in the autocorrelation. In the case of autocorrelation analysis of an additional data set (see Fig. 6B1–B3), a 50 Hz low-pass filter was applied to the membrane potential trace before analysis to avoid detecting as the local maximum SMPO frequency a fast frequency regular noise component present in this data set.
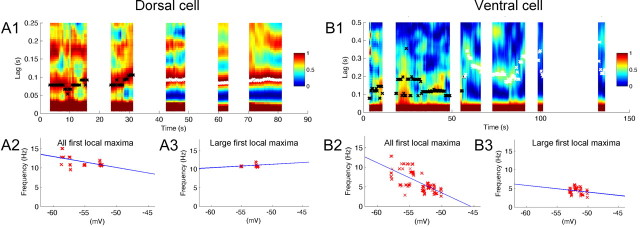
Figure 6.
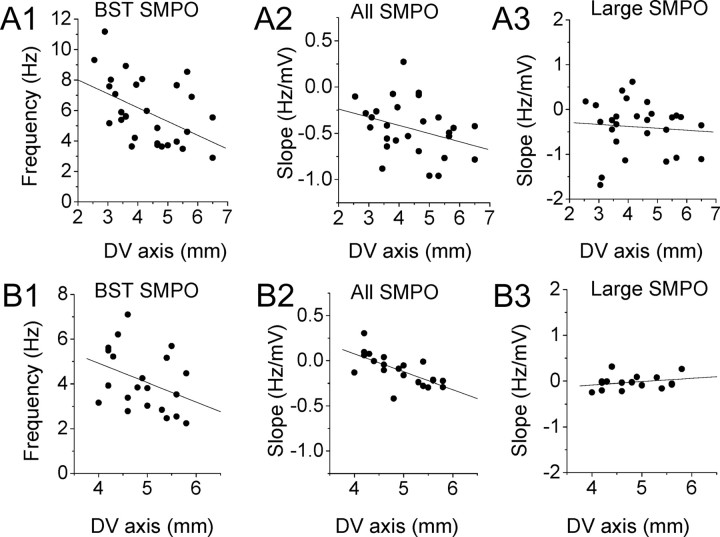
Trends of transition of SMPO frequency in populations of cells using autocorrelation. A1–A3, Autocorrelation analysis for same data set as in Figure 2A–H. B1–B3, Autocorrelation analysis for additional data set in Figure 4A–C. A1, B1, The BST SMPO frequency of individual cells (see Materials and Methods) along the dorsoventral (DV) axis. A2, B2, Slope of autocorrelation frequency versus membrane potential in individual neurons at different dorsal to ventral positions. A3, B3, Similar to A2 and B2 but only with traces with large SMPOs. Linear regression values are as follows: A1, r = −0.47, p = 0.0095, n = 30; A2, r = −0.33, p = 0.091, n = 28; A3, r = −0.084, p = 0.67, n = 28; B1, r = −0.37, p = 0.10, n = 21; B2, r = −0.68, p = 0.0007, n = 21; B3, r = 0.26, p = 0.32, n = 16.
As mentioned above, existing models of grid cells using oscillatory interference use a linear relationship between oscillation frequency and the velocity of the running rat. This change in frequency could arise from linear shifts in SMPO frequency caused by changes in membrane potential due to synaptic input from cells coding head direction and running speed (Burgess et al., 2007; Giocomo et al., 2007; Hasselmo et al., 2007). The slope of the frequency to membrane potential determines the spacing and size of firing fields in the model. Based on the experimental data for a dorsal–ventral difference in spacing and size of firing fields, these models predict that dorsal cells should show a steeper slope of frequency to membrane potential than ventral cells. For this reason, we measured the slope of peak frequency to mean membrane potential in each cell by performing a linear regression using Matlab.
To evaluate the frequency and power of SMPO when it is the strongest in each cell, we chose three windows with the largest FFT power between 2 and 30 Hz and obtained the average peak frequency and power of these three windows. These values are referred to as best (BST) SMPO frequency and BST SMPO power of each cell. BST SMPO was obtained from a period of recording with stepwise depolarization that lasted for up to 3 min and had ∼30 s at the most depolarized membrane potential, where strong SMPOs were observed. For differences in mean peak frequency and standard deviation of frequency peaks (see Fig. 2E,F), the significance was evaluated using a two-way repeated measures ANOVA followed by Bonferroni post-tests. A significance level of <0.05 was used. Data are expressed as means ± SEM.
Figure 2.
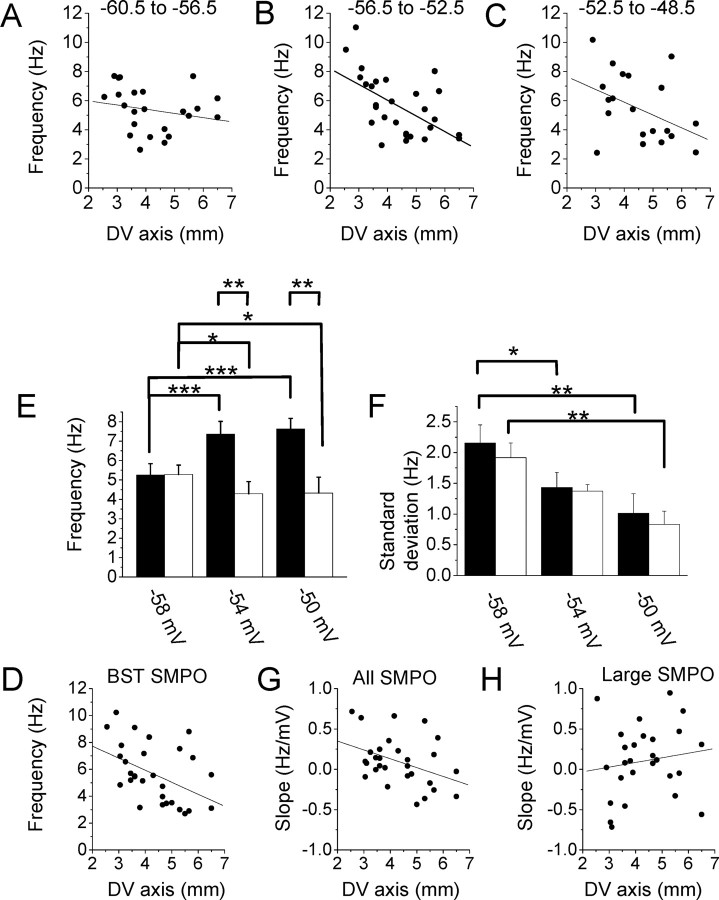
Trends of transition of SMPO frequency in populations of cells. A–C, The mean SMPO frequency of individual cells at the membrane potential ranges between −60.5 and −56.5 mV (linear regression, r = −0.21; p = 0.31; n = 24; A), −56.5 and −52.5 mV (linear regression, r = −0.56; p = 0.0016; n = 29; B), and −52.5 and −48.5 mV (linear regression, r = −0.42; p = 0.061; n = 21; C). D, Located below E. The BST SMPO frequency of individual cells (see Materials and Methods) along the dorsoventral (DV) axis (linear regression, r = −0.45; p = 0.014; n = 30). E, Mean peak frequency of oscillations measured at three different membrane potential ranges within cells that were recorded from all of the three ranges. Cells were grouped into population of dorsal cells (filled bars; n = 7) and ventral cells [open bars; n = 7; two-way repeated measures ANOVA, dorsoventral axis (dorsal and ventral groups), F(1,24) = 6.41, p < 0.05; membrane potential (−60, −56, and −52 mV), F(2,24) = 3.86, p < 0.05; interaction, F(2,24) = 24.04, p < 0.001]. F, Standard deviation of SMPO frequencies from the same group of cells at three different membrane potential ranges [two-way repeated measures ANOVA, dorsoventral axis (dorsal and ventral groups), F(1,24) = 0.38, p = 0.55; membrane potential (−60, −56, and −52 mV), F(2,24) = 15.27, p < 0.001; interaction, F(2,24) = 0.11, p = 0.90]. G, Slope of FFT peak frequency versus membrane potential in individual neurons at different dorsal to ventral positions using all traces (linear regression, r = −0.40; p = 0.029; n = 30). H, Slope of FFT peak frequency versus membrane potential in individual neurons at different dorsal to ventral positions using only traces with large SMPOs (linear regression, r = 0.20; p = 0.29; n = 28). Significance levels in E and F: *p < 0.05, **p < 0.01, ***p < 0.001.
Identification of anatomical location and type of cells.
Distances of recorded neurons from the dorsal surface were determined by keeping track of the position of each slice with separate holding chambers. At the end of slicing, the distance from the dorsal surface to the last slice was measured manually.
Locations of the cells in the slice were confirmed by biocytin staining after recording in 87% of the cells. Locations of the rest of the cells were confirmed by photos taken after recordings with the pipettes still attached to the cells through the low-magnification objective lens, which was enough to approximate anatomical location of each cell. Layer II of the entorhinal cortex contains two different types of principal neurons: stellate and pyramidal neurons. Since stellate cells are known to have larger sag potential and larger SMPOs, we used principal neurons with a sag ratio of >0.15 and with BST SMPO power >0.0015 mV2/Hz in this study. However, since h current density varies with the age of the animal (Richter et al., 1997), it is possible that a small number of our recordings could include nonstellate cells. Therefore, we use the term “stellate-like cells” in this paper.
Biophysical simulation methods.
The prediction about differences in slope of frequency to membrane potential in different cells along the dorsoventral axis can also be tested by analyzing how the biophysical properties of channels affect the slope of frequency to membrane potential. For this purpose, biophysical simulations were performed in Matlab (version 7.9, 2009). A single compartmental model of a medial entorhinal cortex, layer II SC was constructed. Similar to previous models (Dickson et al., 2000; Fransén et al., 2004; Schreiber et al., 2004), the system contained currents proposed previously to underlie SMPOs, these being the hyperpolarization activated cation current, Ih, and persistent sodium current, INaP. The model also included a noise current Ins using sodium channel conductance current as a noise source. For fast-spiking simulations, we included Hodgkin–Huxley currents INa (fast sodium channel) and IK (delayed rectifier) based on parameters from a model of a CA3 pyramidal neuron (Traub et al., 1991). All currents were modeled using the Hodgkin–Huxley formalism in an equivalent circuit representation of membrane potential dynamics as follows:
 |
In this first-order dynamical system, Vm is the membrane potential variable, and Cm is the membrane capacitance constant (1 μF/cm2). The term in the right-hand side summation includes the currents listed above, each with reversal potentials Ei and with voltage-dependent conductance gating variables gi incorporating the corresponding channel kinetics. Also included in the summation is leakage current IL, which has constant conductance. The remaining term Iapp represents injected current, typically set to a constant depolarizing value for an interval of several seconds to obtain steady-state statistics on SMPOs. We also apply current ramps, with slowly and linearly increasing (depolarizing) value, to replicate electrophysiological methods (Erchova et al., 2004; Heys et al., 2010). In general, the voltage-dependent gating variables gi are proportional to the product of the corresponding channel activation and inactivation probabilities,
 |
where Gi is the maximum conductance density for the channel, and mi and hi are the probability of channel activation or inactivation, respectively, each following (by integration) a variable long-term value at a variable rate,
 |
where p∞ is the voltage-dependent long-term (steady-state) value of activation or inactivation, and τp is the corresponding, voltage-dependent, integration time constant. In our system, only fast sodium current INa was modeled with continuous functions for both activation and inactivation probabilities. In addition, the fast sodium activation probability was moderated in its contribution to INa by squaring (Traub et al. 1991). For the sodium conductance noise, a white noise term was added to the above equation. This term was a normally distributed random sample, taken at each integration time step, scaled by the value 0.14 mS/cm2 · ms.
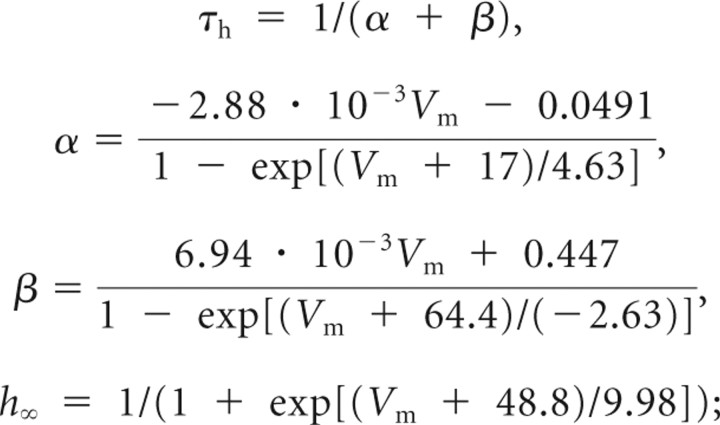
The kinetics of the persistent sodium current were modeled according to Fransén et al. (2004) for activation, and according to Magistretti and Alonso (1999) for inactivation. The fast time scale of activation permitted simplification by setting the activation directly to its steady-state value for the current membrane potential at each time step. The h current is modeled with fast and slow activation time constants (Fransén et al., 2004). The Matlab curve fitting tool was used to fit the time constant and the steady-state activation functions to experimental voltage-clamp data for both dorsal and ventral stellate cells (Giocomo and Hasselmo, 2008a).
The differential equations in the above system were integrated using a Matlab ODE (ordinary differential equations) solver (ode15s was selected for beneficial speed/accuracy trade-off, compared with ode45 or the Crank–Nicolson method). The time step used for analysis of the solutions was 0.1 ms. For all simulations, the results presented were preceded by a 3 s equilibration interval, after which, given continued fixed current input, the mean membrane potential would change less than ∼5% per second.
Conductance gating models.
The voltage dependence of the gating parameters for each active conductance was modeled as follows [voltages are in millivolts, time is in milliseconds, gating variables are probabilities in the range of 0 to 1 (inclusive); constant values are calculated for 37°C]: Ih fast activation, dorsal,
 |
ventral,
 |
Ih slow activation, dorsal,
 |
ventral,
 |
INaP activation,
INaP inactivation,
 |
INa fast sodium activation,
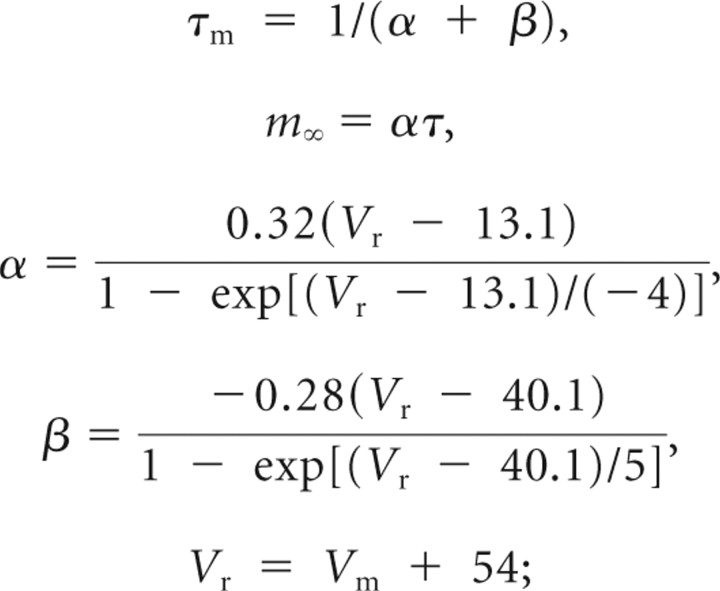 |
INa fast sodium inactivation,
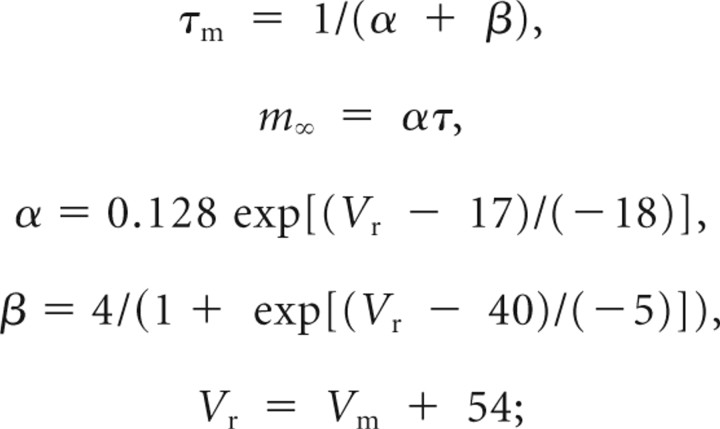 |
Ins sodium conductance noise,
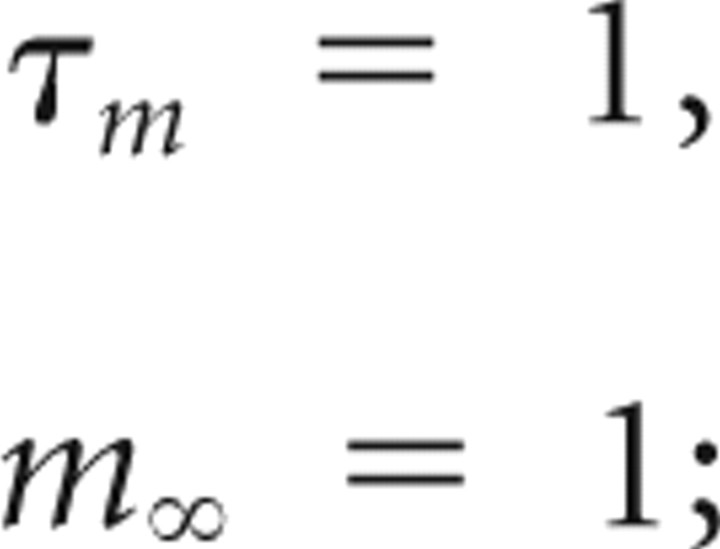 |
delayed rectifier IK activation,
 |
Maximum conductance values.
Maximum conductance (Gi) values are as follows (in mS/cm2): fast h current, 0.169; slow h current, 0.103; NaP, 0.060; leakage current, 0.11; noise current, 0.9; fast-spiking Na, 3.8; fast-spiking K, 10.7.
Reversal potentials.
Reversal potentials (Ei) are as follows (in mV): hyperpolarization-activated nonspecific cation channel (Ih), −20; sodium channels (INaP, INa, Ins), 87; potassium channels (IK), −83; leakage channel (IL), −90; Vm at rest, −60.
These values were chosen to give physiologically relevant membrane resistance, sag response, resonance frequency, resonance strength, SMPO frequency, and SMPO amplitude.
Membrane potential oscillations and power spectra in the model.
Subthreshold membrane potential oscillation frequency and power spectral density (PSD) were obtained in simulations with linearly increasing Iapp (ramped injection) during the interval up to the onset of the first spike event, after subtracting its mean value (DC level), using a modified periodogram method (Matlab Signal Processing Toolbox spectrogram function). For simulations with a fixed current injection, the frequency of the peak value in the PSD was taken as the SMPO frequency for that simulation.
Results
Frequency of subthreshold oscillations at different membrane potentials
We analyzed the effect of membrane potential on subthreshold oscillation frequency in layer II stellate-like cells at different positions along the dorsoventral axis of medial entorhinal cortex. In the first set of experiments, we altered the mean membrane potential by giving stepwise increases in current injection and analyzing the peak frequency of the membrane potential trace. The stepwise increase was used because it is a classical procedure to study subthreshold membrane potential oscillations employed in many previous studies, such as those by Alonso and Llinas (1989), Alonso and Klink (1993), and Schmitz et al. (1998). For the second set of experiments, we used ramp protocols where current injection was continuously increased and decreased (see Materials and Methods). The ramp methods were employed first because the membrane potential depolarization in vivo is not necessarily stepwise but instead may be continuous, and second because the effect of hyperpolarization can be tested easily using the ramp-down protocol in a short amount of time compared to the stepwise protocol.
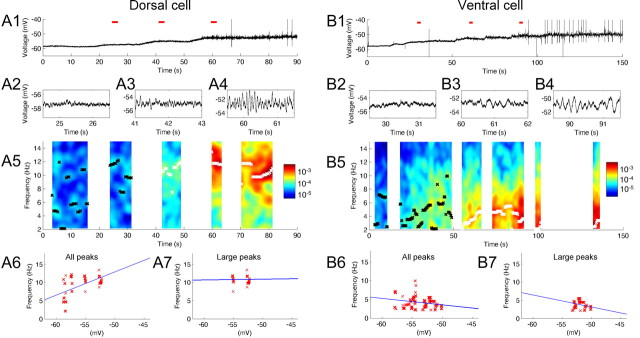
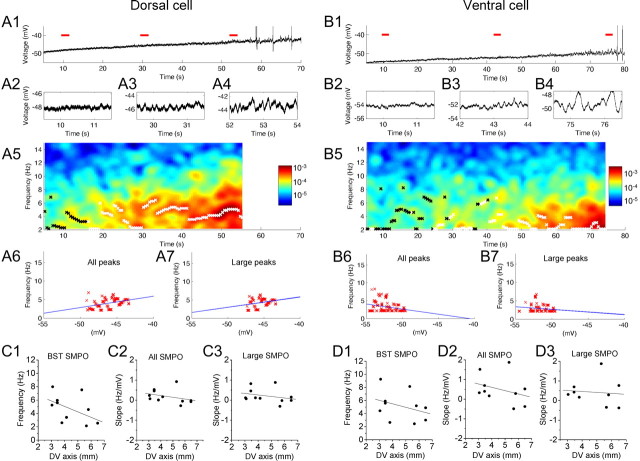
Examples of membrane potential traces from cells recorded at different dorsal to ventral positions using stepwise current injection are shown in Figure 1. Figure 1A1 shows an example of the membrane potential of a dorsal cell, as the membrane potential was depolarized from near resting potential to a suprathreshold level. SMPOs became clearer with depolarization as shown in the magnified traces (Fig. 1A2–A4). The color plot shown in the Figure 1A5 illustrates the power at different frequencies computed with the FFT from the membrane potential plot shown in the Figure 1A1. As the membrane potential is depolarized, the neuron transitions from lower power at a wide range of frequencies to a peak of power at the single higher frequency around 10 Hz. Please note that FFT analysis was omitted when the membrane potential was changing rapidly or when the trace included action potentials (for details, see Materials and Methods). To understand the change in SMPO frequency at different membrane potentials, we detected peak frequency from the FFT analysis. This is shown by black and white crosses superposed on to the color map. Black crosses denote frequency peaks with amplitudes smaller than 0.0001 mV2/Hz, and white crosses denote peaks with amplitudes larger than that value. When the SMPO amplitude is relatively small (black crosses), peaks are scattered over a wide range of membrane potentials, whereas peaks can be found in a narrower range when amplitude is larger (white crosses).
Figure 1.
Frequency of subthreshold membrane potential oscillations at different mean membrane potential voltages. As membrane potential is depolarized, dorsal neurons transition to higher frequencies, and ventral neurons transition to lower frequencies. A1–A7, A dorsal neuron. B1–B7, A ventral neuron. A1, B1, Individual traces illustrate membrane potential oscillations as the mean membrane potential voltage is manipulated by stepwise increases in current injection. Traces corresponding to three red lines are magnified in A2–A4 and B2–B4. A5, B5, Color plot of power spectrum of SMPO frequencies obtained using FFT. Peaks are shown with black (power, <0.0001 mV2/Hz) and white (power, ≥0.0001 mV2/Hz) crosses superimposed on the color map. In a dorsal neuron, transitions from broadband oscillation frequencies to a single, higher band of oscillations around 10 Hz can be seen. The color bars show the power spectrum scale in mV2/Hz. A6, B6, All the peaks (A5, B5, black and white crosses) of the power spectrum replotted as a function of average membrane potential of the corresponding trace. A7, B7, Only large-amplitude peaks of the power spectrum (A5, B5, white crosses) plotted as a function of the average membrane potential of the corresponding trace.
To quantitatively evaluate the frequency change with membrane depolarization, we replotted these peak frequencies on the voltage axis, and this was fit with a straight line (Fig. 1A6,A7). When all detected peaks (both black and white colored) were fitted, the regression line showed a positive slope (Fig. 1A6). However, note that this does not reflect a linear change in large-amplitude oscillations as predicted by the model, but instead reflects the transition from broadband frequencies to narrowband frequencies. In contrast, the slope was flat when only relatively large peaks (white crosses) were fit (Fig. 1A7), indicating that the stronger oscillations do not appear to change in a linear manner with mean membrane potential.
Cells at different positions on the dorsoventral axis of medial entorhinal cortex show different properties in response to the stepwise depolarization. As shown in Figure 1B, cells in the ventral portion transition from lower-amplitude broadband activity to clear oscillations at a single frequency band around 4 Hz. As a result, the slope of the linear regression showed negative values (Fig. 1B6,B7). Cells at an intermediate anatomical position along the dorsoventral axis transition from broadband activity to clear oscillations in a single band of frequency at an intermediate level around 8 Hz (data not shown).
This difference in frequency distribution is confirmed by combining the data across the full population of cells that were measured at three different mean membrane potentials: −58 mV (range, −60.5 to −56.5; n = 24; Fig. 2A), −54 mV (range, −56.5 to −52.5; n = 29; Fig. 2B), and −50 mV (range, −52.5 to −48.5; n = 21; Fig. 2C). For each cell, the peak frequency from the FFT at a membrane potential within the range was averaged and this was plotted against the dorsoventral anatomical location of the cell. Average frequency did not show a significant trend for different dorsoventral anatomical locations at the most hyperpolarized range (Fig. 2A). In contrast, frequency was consistently higher in dorsal cells and lower in ventral cells at more depolarized levels (Fig. 2B,C). This trend was most clearly seen when the BST SMPO frequencies (see Materials and Methods) of individual neurons were plotted along the dorsoventral axis, as reported previously (Fig. 2D; n = 30) (Giocomo et al., 2007). The BST SMPO was detected automatically, as described in Materials and Methods, but was always detected at the most depolarized level where spikes were observed occasionally.
To show that this trend is not due to a subpopulation of neurons that were not recorded in all three voltage ranges, we calculated the average SMPO frequency of cells in which frequency was measured in all three ranges (Fig. 2E). In this analysis, we calculated an average frequency for dorsal cells (<4.5 mm from the dorsal surface; n = 7; Fig. 2E, filled bars) and ventral cells (>4.5 mm from the surface; n = 7; open bars). The mean peak frequency was not different at the most hyperpolarized level, but at more depolarized levels it was higher in the population of cells recorded in dorsomedial entrohinal cortex than in those recorded in the ventral population. Within this group, dorsal cells showed an overall trend toward an increase in frequency with depolarization, whereas ventral cells showed a trend toward a decrease in frequency with depolarization.
Figure 2F shows the standard deviation of peak SMPO frequency at each membrane potential range in the same set of cells (n = 7 for both dorsal and ventral groups). This indicates a transition from more variable broad band fluctuations in membrane potential to less variable narrowband oscillations. The standard deviation was larger in the hyperpolarized range and decreased with depolarization because the FFT of SMPOs showed lower power at a wide range of frequencies at hyperpolarized levels and a peak of power at a single frequency at depolarized membrane potentials, both in dorsal and ventral cells.
The change in peak membrane potential frequency with depolarization for individual cells was quantified by computing the peak frequency with FFT and plotting this against the mean membrane potential for that time window, as shown in Figure 1, A6 and A7. The slope of the linear regression line for each neuron could then be plotted against the dorsal to ventral anatomical position of each cell (Fig. 2G,H). In Figure 2G, slopes of the linear regression lines fit to peak frequency from all traces (as in Fig. 1A6) are shown. The slope of peak frequency shows a systematic change along the dorsoventral axis. Neurons near the dorsal end of the medial entorhinal cortex show a positive slope of frequency to membrane potential, as shown on the left side of the plots, whereas neurons near the ventral end show a negative slope of frequency to membrane potential, indicating a reduction in peak frequency with depolarization. This corresponds well with the averaged data shown in Figure 2E, where frequency increased and decreased in dorsal and ventral cells, respectively, during depolarization from the most hyperpolarized level. In Figure 2H, slopes of the linear regression lines fit to peak frequency only from traces with frequency peaks with large power (as in Fig. 1A7) were used. In this and subsequent plots of large power peaks, cells that did not have frequency measurements over a membrane potential range of >1.5 mV were not used. This plot does not show a clear trend along the dorsoventral axis. These plots of the slopes of frequency change of individual cells agree well with the fact that the SMPO frequency did not show a change at the two depolarized levels (−54 and −50 mV) where SMPO amplitudes were relatively large.
Although we did not find a SMPO frequency change between the two depolarized levels, SMPO frequency might be modulated by SMPO amplitudes. Indeed, SMPO amplitude varies even at a constant mean membrane potential level (Alonso and Klink, 1993). To describe this issue, we first plotted the SMPO power versus frequency for all the windows where FFT was applied at the most depolarized level (Fig. 3A–C). In Figure 3A, each circle corresponds to one window from the same dorsal cell in Figure 1A1–A7, where the choice of windows was restricted to times after ∼57 s. The red circles correspond to windows with the five largest powers, and the blue circles correspond to windows with the next five largest powers. The frequency distribution is tighter in windows with larger SMPO amplitude. Additional examples of cells from intermediate levels of the dorsoventral axis (Fig. 3B) and ventral levels (Fig. 3C) show SMPOs with lower frequencies but with a similar distribution. We then compared the average frequency of the windows with the five largest (red) and the next five largest (blue) powers for all neurons. The SMPO frequency was not different, indicating that the power of the SMPOs does not modulate the average frequency (five largest, 5.69 ± 0.42 Hz; next five largest, 5.62 ± 0.43 Hz; paired t test, p = 0.5; n = 30). On the other hand, the distribution of the frequency measured as the SE was significantly sharper in SMPOs with larger power (five largest, 0.14 ± 0.02 Hz; next five largest, 0.22 ± 0.03 Hz; paired t test, p < 0.05; n = 30). The difference between the average of the five largest and the next largest frequencies was then plotted as a function of the dorsoventral axis for all cells (Fig. 3D). There was a slight trend toward ventral cells showing more increase in frequency, but this trend was not significant. These observations suggest that SMPO amplitudes do not modulate the average frequency, while larger SMPOs represent average frequency with better precision probably because of better signal-to-noise ratio.
Figure 3.
Effects of SMPO power on SMPO frequency. A, SMPO power versus frequency for all the windows where FFT was applied at the most depolarized level of the dorsal neuron shown in Figure 1A. Each circle corresponds to one window where choices of windows were restricted to the time after ∼57 s. The red circles correspond to windows with five largest powers, and the blue circles correspond to windows with the next five largest powers. B, C, Additional examples of cells from an intermediate level of the dorsoventral (DV) axis (B) and the ventral level (C). D, The difference between averages of the five largest and the next largest frequencies plotted as a function of the dorsoventral axis for all cells (linear regression, r = 0.15; p = 0.41; n = 30).
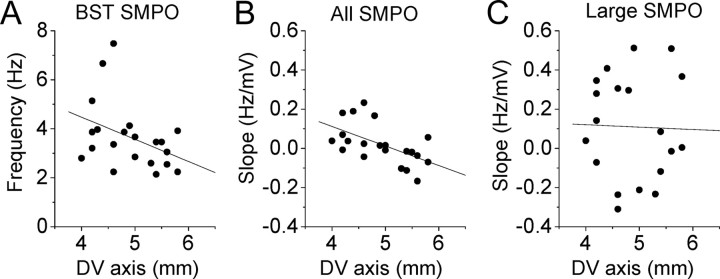
For comparison with these results, we conducted a similar analysis on an additional set of data (Fig. 4) in which recordings were done with identical experimental procedures apart from the use of slightly different ACSF. In this additional data set, ACSF included the following (in mm): 126.0 NaCl, 3 KCl, 1.25 NaH2PO4, 26.0 NaHCO3, 2 CaCl2. 2 MgSO4, and 10.0 dextrose. All recordings (n = 21) were from layer II of the medial entorhinal cortex, and the same selection criterion were used as described in Materials and Methods. The additional data set came from a study that was focused on comparing current-clamp analyses of oscillations with voltage-clamp analyses of h current time constants (Giocomo and Hasselmo, 2008a). The second data set was not analyzed previously in this manner, but the data include stepwise changes in current injection during current-clamp recording that could be analyzed in the same manner as the data presented in Figure 1. As shown in Figure 4, this separate data set shows a similar pattern of differences in slope along the dorsoventral axis to those shown in Figure 2, D, G, and H. For this separate data, Figure 4A shows the BST SMPO frequency. Figure 4B shows the slope measurement for all peaks, and C shows the slopes measured for traces with large SMPO amplitudes alone. Please note that the BST SMPO frequency is lower in the most dorsal locations in the second data set because data were collected in a narrower dorsal-to-ventral range compared to the range in the first data set.
Figure 4.
Trends of transition of SMPO frequency in additional set of cells. A, The BST SMPO frequency of individual cells in an additional data set along the dorsoventral (DV) axis (linear regression, r = −0.39; p = 0.083; n = 21). B, Slope of SMPO frequency versus membrane potential using all traces in the additional data set (linear regression, r = −0.56; p = 0.0078; n = 21). C, Slope of SMPO frequency versus membrane potential using only traces with large SMPO amplitudes (linear regression, r = −0.027; p = 0.91; n = 19).
To confirm that these results are not limited to the use of FFT analysis, we analyzed the above two data sets using autocorrelation measurements (Fig. 5, 6). Figure 5, A and B, shows the same cells as in Figure 1, A and B, respectively. Note that “lag” in Figure 5, A1 and B1, indicates the wavelength of oscillations (reciprocal of frequency), so larger lags correspond to lower frequency. The results were similar in both sets of data, as shown in Figure 6, A and B. The BST SMPO frequency (Fig. 6A1,B1) showed higher frequency in dorsal cells and lower frequency in ventral cells, similar to the FFT analysis (Figs. 2D, 4A). The slope trend using all traces (Fig. 6A2,B2) showed more positive values in dorsal cells and more negative values in ventral cells, as in the FFT analysis (Fig. 2G, 4B), and the slope trend using traces with large SMPO amplitudes alone (Fig. 6A3,B3) showed an almost flat distribution along the dorsoventral axis, also as in the FFT analysis (Fig. 2H, 4C). However, the slope trend with autocorrelation analysis was generally more negative compared to those from the FFT analysis. This could be because we detected the first local maximum in the autocorrelogram and not the largest peak. The first local maximum detection was effectively detecting the major frequency component at the depolarized levels where SMPO amplitudes were large (Fig. 5A1, white crosses). However, when SMPOs were smaller at more hyperpolarized levels (Fig. 5A1, black crosses), the second local maximum was often as large or larger but was not detected by this method, resulting in higher-frequency measurements at hyperpolarized levels. This means that the autocorrelation analysis did not include the lower frequencies detected by the FFT analysis at the hyperpolarized potentials, causing the slope of the same cell to be more negative than that in the FFT analysis. Therefore, although the autocorrelation analysis showed a similar trend toward a decreasing slope along the dorsoventral axis as in the FFT analysis, the absolute values of the slopes could be captured more accurately in the FFT analysis.
Figure 5.
Autocorrelation analysis of SMPO frequency change with depolarization. A1–A3, A dorsal neuron (same cell as in Fig. 1A). B1–B3, A ventral neuron (same cell as in Fig. 1B). A1, B1, Color plot of autocorrelogram and detected peak superposed as black (amplitude, <0.005 mV) and white crosses (amplitude, >0.005 mV), respectively. The autocorrelogram from each window was normalized to the range 0 to 1 for clarity of the color plot. The color bars show the scale after normalization. A2, B2, All the first local maxima (black and white crosses) of the autocorrelation converted to frequency and replotted as a function of the average membrane potential of the corresponding trace. A3, B3, Only large-amplitude first local maxima (white crosses in A2, B2) plotted as a function of average membrane potential of the corresponding trace.
As described in Materials and Methods, the change in peak frequency was also tested using slow ramps of increasing and decreasing current injection. Figure 7, A1 and B1, shows examples of the membrane potential oscillation response during an increasing ramp of current injection in dorsal (A1) and ventral (B1) neurons. The oscillation peak frequency was analyzed with FFT analysis at individual time points of the sliding window, which was moved across the ramp input. The data from the ramp current injection protocol give results consistent with the data from the stepwise shifts in current injection, both with increasing and decreasing ramps. The SMPO frequency at near spike threshold (Fig. 7C1,D1) was higher in dorsal cells than in ventral cells. The slope plot using all traces (Fig. 7C2,D2) showed a positive-to-negative trend along the dorsoventral axis. The slope plot using traces with large SMPO amplitudes (Fig. 7C3,D3) showed less of a trend than those with all traces. Please note that the dorsal-to-ventral range of cells recorded in this data set was slightly narrower, and the frequency of SMPOs at the most dorsal location was lower than that in Figure 2D.
Figure 7.
Frequency changes during ramp stimulation. A1–A7, A dorsal neuron. B1–B7, A ventral neuron. A1, B1, Example of membrane potential oscillation response during an increasing ramp of current injection. A2–A4, B2–B4, Magnified trace from A1 and B1, respectively. Each magnified trace corresponds to time indicated by the red lines in A1 and B1. A5, B5, Color map of power spectrum obtained by FFT using the traces shown in A1 and B1. A6, B6, All the peaks (black and white crosses in A5, B5) of the power spectrum replotted as a function of the average membrane potential of the corresponding trace. A7, B7, Only large-amplitude peaks of the power spectrum (white crosses in A5, B5) plotted as a function of the average membrane potential of the corresponding trace. C1, D1, The BST SMPO frequency of individual cells (see Materials and Methods) along the dorsoventral axis with decreasing and increasing ramp protocols, respectively (linear regression, C1, r = −0.53, p = 0.092, n = 11; D1, r = −0.34, p = 0.34, n = 10). C2, D2, Slope of peak frequency to membrane potential calculated from the ramp stimulus for neurons at different dorsal to ventral positions using the decreasing component of the ramp (C2, down) and the increasing ramp (D2, up; linear regression, C2, r = −0.35, p = 0.30, n = 11; D2, r = −0.32, p = 0.36, n = 10). C3, D3, Similar slope plots using only traces with large SMPOs with increasing and decreasing ramp protocols, respectively (linear regression, C3, r = −0.28, p = 0.40, n = 11; D3, r = −0.10, p = 0.80, n = 9).
Compartmental biophysical simulations of stellate cells were used to analyze the potential cellular mechanisms for the difference in peak frequency response to mean membrane potential. These simulations were based on previous models of membrane potential oscillations in stellate cells (Dickson et al., 2000; Fransén et al., 2004). Membrane potential oscillations in these simulations arise from interactions of the h current (IH) with the persistent sodium current (INaP). As shown in Figure 8, the simulated membrane potential shows transitions similar to the properties of the real membrane potential observed during an increasing ramp of current injection. At lower mean membrane potentials, the oscillations exhibit smaller amplitude fluctuations and a broad range of frequencies that depend on the noise component of the simulation. As the current injection amplitude increases and the mean membrane potential becomes more depolarized, the simulated membrane potential shows an increase in membrane potential oscillation amplitude around a single frequency band until making a transition into spiking activity. We did not find parameter values that would produce a significant linear change in frequency with mean membrane potential over a wide range of membrane potentials; instead, parameter values showed a transition from broadband frequencies to a narrow frequency band, similar to the experimental data.
Figure 8.
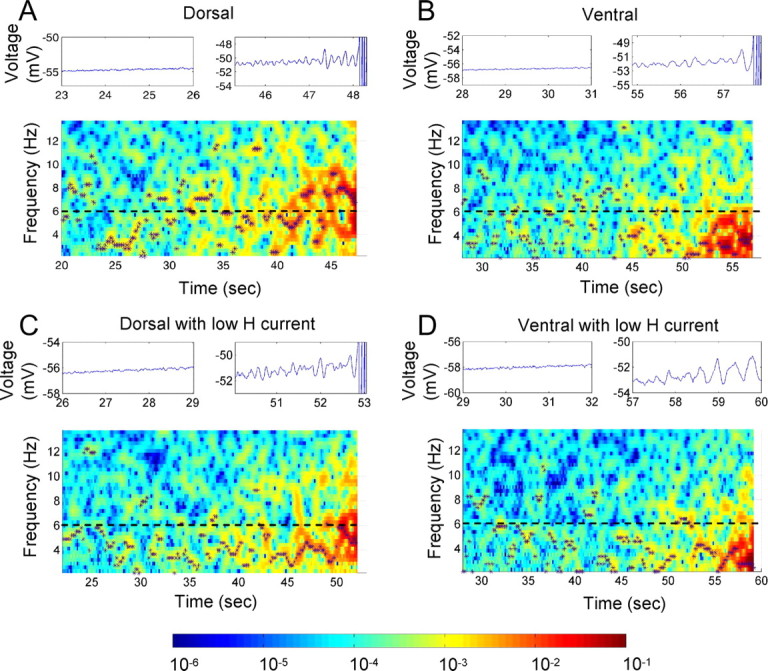
Ramp simulation results for the single-compartment model medial entorhinal cortex II stellate cell in four parameter configurations. A depolarizing direct current was applied, linearly increasing from rest potential until threshold was reached and spikes were observed, and the PSD (in square millivolts per hertz) of the resulting membrane potential was calculated over the simulation time before the first spike was observed. A–D, The four conditions were the h current fast time constant model for a typical dorsal cell (A) and for a typical ventral cell (B), using parameters from voltage-clamp data (Giocomo and Hasselmo, 2008), and (C) h channel density reduced by half for the dorsal fast time constant model and (D) for the ventral time constant model. For each ramp, the top left plot shows a segment of the voltage trace in the broadband region, and the top right plot shows a segment of the voltage trace for the same duration as the left plot but in the narrowband region of high depolarization up to and including the first spike events. In the PSD spectrograms, the local maximum PSD value at each analysis time interval is marked by an asterisk. The color bar shows the PSD scale in mV2/Hz. The h channel conductance density for A and B is 0.169 mS/cm2, and for C and D it is 0.0845 mS/cm2.
Simulations show that the narrowband membrane potential oscillation frequency that appears with depolarization can be altered by changes in a number of parameters. In particular, decreasing the time constant of the h current can increase oscillation frequency (Giocomo and Hasselmo, 2008; Heys et al., 2010). In Figure 8, the h current time constant has smaller values in the dorsal model (Fig. 8A,C) than in the ventral model (Fig. 8B,D) across the range of membrane potentials from rest to threshold. Consequently, we see that the frequency of high-amplitude, narrowband membrane potential oscillation is greater using the dorsal model (Fig. 8A) than the ventral model (Fig. 8B). The oscillation frequency can also be decreased by reducing h conductance density, that is, by reducing the h current magnitude (Fig. 8C,D). In both of these cases, the manipulations change the frequency of the oscillations when they appear, but once a narrowband oscillation is present, the frequency does not show systematic changes with further depolarization.
Discussion
Data from stellate-like cells at different positions along the dorsoventral axis of the medial entorhinal cortex show the peak frequencies of SMPOs at different mean membrane potentials. Neurons at different anatomical positions show different patterns of frequency change with depolarization. Dorsal cells show a transition from broadband, low-amplitude membrane potential fluctuations to narrowband, high-amplitude oscillations at high frequencies. Ventral cells show a transition from broadband fluctuations to narrowband, high-amplitude oscillations at lower frequencies.
These differences also appear as a difference in the slope of the peak frequency relative to mean membrane potential for dorsal versus ventral stellate cells. Dorsal cells tend to show a positive slope of peak frequency with depolarization, whereas ventral cells tend to show a negative slope of peak frequency with depolarization. However, it is important to note that these slope differences are all associated with a transition from broadband, low-amplitude fluctuations to narrowband, higher-amplitude oscillations. Thus, the slope does not reflect a systematic change in narrowband oscillations with depolarization, and we cannot neglect the contribution of noise to the broadband spectrum. When we focused on analyzing only the larger-amplitude peaks of oscillation frequency, the slope difference does not appear, indicating that once larger-amplitude narrowband frequencies appear, they tend to stay in the same frequency range—high frequencies in dorsal cells and low frequencies in ventral cells.
An early study by Alonso and Klink (1993) presented a plot showing a large increase of SMPO frequency with depolarization in layer II neurons from the entorhinal cortex. Following this study, other studies (Erchova et al., 2004; Engel et al., 2008) showed that the resonance frequency does not change with depolarization (range, −70 to −55 mV), while further studies (Nolan et al., 2007) showed a decrease of resonance frequency with depolarization (range, −80 to −60 mV). Similar inconsistent results were reported from the layer V neurons in the entorhinal cortex, which also show SMPOs (Schmitz et al., 1998; Gloveli et al., 2001). Since none of these studies kept track of the dorsoventral position of recorded cells, it remained unclear if neurons from different locations show different frequency changes with depolarization or not. Such hypothetical differences might have caused the inconsistent observations. Our previous studies showed a difference in frequency at different membrane potentials in different neurons (Giocomo and Hasselmo, 2008a) but did not explicitly analyze frequency differences with depolarization within single neurons. Our current results suggest that SMPO frequency does not change systematically with depolarization along the entire dorsoventral axis.
Our biophysical simulations further supported our experimental observations. Differences in the time constant or magnitude of h current in dorsal and ventral neurons in simulations caused frequency differences similar to the data. The transition from broadband to narrowband frequency was also reproduced by the simulations (Fig. 8). A more general mathematical model (E. Zilli and M. E. Hasselmo, unpublished data) shows that as the cell approaches the firing threshold, the impedance of the cell becomes taller and thinner, causing the Fourier transform of the SMPOs to do likewise. Over much of the range of membrane potentials, the broad peak may be obscured by noise until the peak is sufficiently large, consistent with the experimental data and conclusions presented in this paper.
Our focus in studying the change in peak frequency with depolarization was to test one version of the oscillatory interference model of grid cells (Burgess et al., 2005, 2007). In the SMPO version of the oscillatory interference model, depolarizing input from speed-modulated head direction cells coding velocity induces a direct linear shift in membrane potential oscillation frequency in single neurons (Hasselmo et al., 2007). However, the data and biophysical model presented here do not show the linear shift in narrowband frequency with membrane potential that would be necessary for frequency changes with velocity to cause phase shifts that code position in the environment in the SMPO version of the model (Hasselmo et al., 2007). This suggests that the coding of position by oscillatory interference would require suprathreshold or network mechanisms that shift frequency in response to velocity (Burgess et al., 2007; Blair et al., 2008; Hasselmo, 2008; Zilli and Hasselmo, 2010).
Another problem for the SMPO model concerns the transition of slopes from positive to negative along the dorsoventral axis shown here. The oscillatory interference model can work effectively with either increasing or decreasing slopes of frequency, but a zero slope would result in infinite spacing and would predict a transition in intermediate locations in entorhinal cortex where an increase in spatial scale would transition to a decrease in spatial scale, whereas the experimental data show a consistent increase in spatial scale (Hafting et al., 2005; Sargolini et al., 2006; Barry et al., 2007; Brun et al., 2008; Moser and Moser, 2008). The version of the oscillatory interference model using interaction of SMPOs within single cells also suffers from problems, including the tendency of oscillations to synchronize within single neurons (Remme et al., 2009, 2010) and the high variance in oscillation period that would degrade the representation of position by phase (Giocomo and Hasselmo, 2008a; Zilli et al., 2009).
Our results do not rule out other network mechanisms for frequency to have a linear relationship to velocity (Burgess et al., 2007; Blair et al., 2008; Zilli and Hasselmo, 2010). The prediction of the model that dorsal–ventral differences in grid cell firing field spacing and size arise from differences in the slope of frequency relative to running velocity could depend on other mechanisms. For example, it could depend on changes in the frequency of single-cell persistent spiking with velocity (Burgess, 2008; Hasselmo, 2008; Yoshida and Hasselmo, 2009) or on a change in network oscillation frequency with velocity (Zilli and Hasselmo, 2010) potentially due to resonance properties of individual neurons.
As an alternative to interaction of SMPOs within single neurons, the intrinsic frequency properties of neurons could contribute to the frequency of network oscillations. Modeling has shown that intrinsic currents underlying SMPOs can influence phase response characteristics and network oscillations (Acker et al., 2003; Netoff et al., 2005). Thus, intrinsic properties might underlie changes in frequency of network theta rhythm oscillations in association with running speed and head direction. Recent modeling showed how network oscillatory dynamics can overcome the problem of variance by decreasing the variance in phase (Zilli and Hasselmo, 2010). These network oscillations might change their frequency with different slopes dependent on temporal summation of excitatory recurrent synapses (Zilli and Hasselmo, 2010), suggesting that the h current might contribute to differences in the spacing of grid cell firing fields via the effect on differences in temporal summation along the dorsal-to-ventral axis of the medial entorhinal cortex (Garden et al., 2008). Another possibility is that the change in frequency with running speed may depend on network oscillations arising from the medial septum (Blair et al., 2008; Burgess, 2008). This is supported by data showing loss of spatial periodicity of grid cells during inactivation of the medial septum (Brandon et al., 2011; Koenig et al., 2011) and by the positive relationship between running speed and the frequency of both grid cell firing modulation and theta rhythm in the local field potential (LFP) (Jeewajee et al., 2008). Theta rhythm in the entorhinal LFP is lost during inactivation of the medial septum (Mitchell et al., 1982; Jeffery et al., 1995; Brandon et al., 2011; Koenig et al., 2011). The medial septum or other regions could provide input that changes frequency with velocity in a narrow range near ∼8 Hz and interacts with the broad range of intrinsic frequencies of entorhinal neurons at different positions along the dorsal-to-ventral axis to generate differences in grid cell size and spacing.
Even though we did not find a linear change in frequency with membrane potential, the experimental data presented here provide further replication of the difference in membrane potential oscillation frequency along the dorsal-to-ventral axis of medial entorhinal cortex shown previously (Giocomo et al., 2007; Giocomo and Hasselmo, 2008a,b, 2009; Boehlen et al., 2010; Heys et al., 2010). The biophysical simulations presented here support different potential mechanisms for this gradient of membrane potential oscillation frequency (Heys et al., 2010). The gradient could arise from differences in the activation time constant of the h current, as supported by experimental data (Giocomo and Hasselmo, 2008b), or the SMPO frequency differences could arise from differences in the magnitude of h current at different anatomical positions, as found in voltage-clamp data on h current (Garden et al., 2008; Giocomo and Hasselmo, 2008b). The differences could also arise from other factors such as the input resistance of cortical neurons (Garden et al., 2008). Finally, dendritic properties could contribute to an SMPO frequency change with depolarization. Somatic depolarization cannot control dendritic membrane potentials perfectly, leaving the effect of dendritic depolarization unclear. Additional studies will be necessary to fully understand the mechanism by which SMPO difference could potentially underlie the difference in spacing of grid cell firing fields.
Footnotes
This work was supported by NIMH Grants R01 MH61492 and MH60013, Office of Naval Research Multidisciplinary University Research Initiative Grant N00014-10-1-0936, and Japan Society for the Promotion of Science Postdoctoral Fellowship for Research Abroad.
References
- Acker CD, Kopell N, White JA. Synchronization of strongly coupled excitatory neurons: relating network behavior to biophysics. J Comput Neurosci. 2003;15:71–90. doi: 10.1023/a:1024474819512. [DOI] [PubMed] [Google Scholar]
- Alonso A, Klink R. Differential electroresponsiveness of stellate and pyramidal-like cells of medial entorhinal cortex layer II. J Neurophysiol. 1993;70:128–143. doi: 10.1152/jn.1993.70.1.128. [DOI] [PubMed] [Google Scholar]
- Alonso A, Llinas RR. Subthreshold Na-dependent theta-like rhythmicity in stellate cells of entorhinal cortex layer II. Nature. 1989;342:175–177. doi: 10.1038/342175a0. [DOI] [PubMed] [Google Scholar]
- Barry C, Hayman R, Burgess N, Jeffery KJ. Experience-dependent rescaling of entorhinal grids. Nat Neurosci. 2007;10:682–684. doi: 10.1038/nn1905. [DOI] [PubMed] [Google Scholar]
- Blair HT, Gupta K, Zhang K. Conversion of a phase- to a rate-coded position signal by a three-stage model of theta cells, grid cells, and place cells. Hippocampus. 2008;18:1239–1255. doi: 10.1002/hipo.20509. [DOI] [PMC free article] [PubMed] [Google Scholar]
- Boehlen A, Heinemann U, Erchova I. The range of intrinsic frequencies represented by medial entorhinal cortex stellate cells extends with age. J Neurosci. 2010;30:4585–4589. doi: 10.1523/JNEUROSCI.4939-09.2010. [DOI] [PMC free article] [PubMed] [Google Scholar]
- Brandon MP, Bogaard AR, Libby CP, Connerney MA, Gupta K, Hasselmo ME. Reduction of theta rhythm dissociates grid cell spatial periodicity from directional tuning. Science. 2011;332:595–599. doi: 10.1126/science.1201652. [DOI] [PMC free article] [PubMed] [Google Scholar]
- Brun VH, Solstad T, Kjelstrup KB, Fyhn M, Witter MP, Moser EI, Moser MB. Progressive increase in grid scale from dorsal to ventral medial entorhinal cortex. Hippocampus. 2008;18:1200–1212. doi: 10.1002/hipo.20504. [DOI] [PubMed] [Google Scholar]
- Burgess N. Grid cells and theta as oscillatory interference: theory and predictions. Hippocampus. 2008;18:1157–1174. doi: 10.1002/hipo.20518. [DOI] [PMC free article] [PubMed] [Google Scholar]
- Burgess N, Barry C, Jeffery KJ, O'Keefe J. A grid and place cell model of path integration utilizing phase precession versus theta. Computational Cognitive Neuroscience Meeting; March; Washington, DC. 2005. [Google Scholar]
- Burgess N, Barry C, O'Keefe J. An oscillatory interference model of grid cell firing. Hippocampus. 2007;17:801–812. doi: 10.1002/hipo.20327. [DOI] [PMC free article] [PubMed] [Google Scholar]
- Dickson CT, Magistretti J, Shalinsky MH, Fransén E, Hasselmo ME, Alonso A. Properties and role of I(h) in the pacing of subthreshold oscillations in entorhinal cortex layer II neurons. J Neurophysiol. 2000;83:2562–2579. doi: 10.1152/jn.2000.83.5.2562. [DOI] [PubMed] [Google Scholar]
- Engel TA, Schimansky-Geier L, Herz AV, Schreiber S, Erchova I. Subthreshold membrane-potential resonances shape spike-train patterns in the entorhinal cortex. J Neurophysiol. 2008;100:1576–1589. doi: 10.1152/jn.01282.2007. [DOI] [PMC free article] [PubMed] [Google Scholar]
- Erchova I, Kreck G, Heinemann U, Herz AV. Dynamics of rat entorhinal cortex layer II and III cells: characteristics of membrane potential resonance at rest predict oscillation properties near threshold. J Physiol. 2004;560:89–110. doi: 10.1113/jphysiol.2004.069930. [DOI] [PMC free article] [PubMed] [Google Scholar]
- Fransén E, Alonso AA, Dickson CT, Magistretti J, Hasselmo ME. Ionic mechanisms in the generation of subthreshold oscillations and action potential clustering in entorhinal layer II stellate neurons. Hippocampus. 2004;14:368–384. doi: 10.1002/hipo.10198. [DOI] [PubMed] [Google Scholar]
- Garden DL, Dodson PD, O'Donnell C, White MD, Nolan MF. Tuning of synaptic integration in the medial entorhinal cortex to the organization of grid cell firing fields. Neuron. 2008;60:875–889. doi: 10.1016/j.neuron.2008.10.044. [DOI] [PubMed] [Google Scholar]
- Giocomo LM, Hasselmo ME. Computation by oscillations: implications of experimental data for theoretical models of grid cells. Hippocampus. 2008a;18:1186–1199. doi: 10.1002/hipo.20501. [DOI] [PMC free article] [PubMed] [Google Scholar]
- Giocomo LM, Hasselmo ME. Time constants of h current in layer II stellate cells differ along the dorsal to ventral axis of medial entorhinal cortex. J Neurosci. 2008b;28:9414–9425. doi: 10.1523/JNEUROSCI.3196-08.2008. [DOI] [PMC free article] [PubMed] [Google Scholar]
- Giocomo LM, Hasselmo ME. Knock-out of HCN1 subunit flattens dorsal-ventral frequency gradient of medial entorhinal neurons in adult mice. J Neurosci. 2009;29:7625–7630. doi: 10.1523/JNEUROSCI.0609-09.2009. [DOI] [PMC free article] [PubMed] [Google Scholar]
- Giocomo LM, Zilli EA, Fransén E, Hasselmo ME. Temporal frequency of subthreshold oscillations scales with entorhinal grid cell field spacing. Science. 2007;315:1719–1722. doi: 10.1126/science.1139207. [DOI] [PMC free article] [PubMed] [Google Scholar]
- Gloveli T, Dugladze T, Schmitz D, Heinemann U. Properties of entorhinal cortex deep layer neurons projecting to the rat dentate gyrus. Eur J Neurosci. 2001;13:413–420. doi: 10.1046/j.0953-816x.2000.01405.x. [DOI] [PubMed] [Google Scholar]
- Hafting T, Fyhn M, Molden S, Moser MB, Moser EI. Microstructure of a spatial map in the entorhinal cortex. Nature. 2005;436:801–806. doi: 10.1038/nature03721. [DOI] [PubMed] [Google Scholar]
- Hasselmo ME. Grid cell mechanisms and function: contributions of entorhinal persistent spiking and phase resetting. Hippocampus. 2008;18:1213–1229. doi: 10.1002/hipo.20512. [DOI] [PMC free article] [PubMed] [Google Scholar]
- Hasselmo ME, Giocomo LM, Zilli EA. Grid cell firing may arise from interference of theta frequency membrane potential oscillations in single neurons. Hippocampus. 2007;17:1252–1271. doi: 10.1002/hipo.20374. [DOI] [PMC free article] [PubMed] [Google Scholar]
- Heys JG, Giocomo LM, Hasselmo ME. Cholinergic modulation of the resonance properties of stellate cells in layer II of medial entorhinal cortex. J Neurophysiol. 2010;104:258–270. doi: 10.1152/jn.00492.2009. [DOI] [PMC free article] [PubMed] [Google Scholar]
- Jeewajee A, Barry C, O'Keefe J, Burgess N. Grid cells and theta as oscillatory interference: electrophysiological data from freely moving rats. Hippocampus. 2008;18:1175–1185. doi: 10.1002/hipo.20510. [DOI] [PMC free article] [PubMed] [Google Scholar]
- Jeffery KJ, Donnett JG, O'Keefe J. Medial septal control of theta-correlated unit firing in the entorhinal cortex of awake rats. Neuroreport. 1995;6:2166–2170. doi: 10.1097/00001756-199511000-00017. [DOI] [PubMed] [Google Scholar]
- Koenig J, Linder AN, Leutgeb JK, Leutgeb S. The spatial periodicity of grid cells is not sustained during reduced theta oscillations. Science. 2011;332:592–595. doi: 10.1126/science.1201685. [DOI] [PubMed] [Google Scholar]
- Magistretti J, Alonso A. Biophysical properties and slow voltage-dependent inactivation of a sustained sodium current in entorhinal cortex layer-II principal neurons: a whole-cell and single-channel study. J Gen Physiol. 1999;114:491–509. doi: 10.1085/jgp.114.4.491. [DOI] [PMC free article] [PubMed] [Google Scholar]
- Mitchell SJ, Rawlins JN, Steward O, Olton DS. Medial septal area lesions disrupt theta rhythm and cholinergic staining in medial entorhinal cortex and produce impaired radial arm maze behavior in rats. J Neurosci. 1982;2:292–302. doi: 10.1523/JNEUROSCI.02-03-00292.1982. [DOI] [PMC free article] [PubMed] [Google Scholar]
- Moser EI, Moser MB. A metric for space. Hippocampus. 2008;18:1142–1156. doi: 10.1002/hipo.20483. [DOI] [PubMed] [Google Scholar]
- Netoff TI, Acker CD, Bettencourt JC, White JA. Beyond two-cell networks: experimental measurement of neuronal responses to multiple synaptic inputs. J Comput Neurosci. 2005;18:287–295. doi: 10.1007/s10827-005-0336-9. [DOI] [PubMed] [Google Scholar]
- Nolan MF, Dudman JT, Dodson PD, Santoro B. HCN1 channels control resting and active integrative properties of stellate cells from layer II of the entorhinal cortex. J Neurosci. 2007;27:12440–12451. doi: 10.1523/JNEUROSCI.2358-07.2007. [DOI] [PMC free article] [PubMed] [Google Scholar]
- O'Keefe J, Burgess N. Dual phase and rate coding in hippocampal place cells: theoretical significance and relationship to entorhinal grid cells. Hippocampus. 2005;15:853–866. doi: 10.1002/hipo.20115. [DOI] [PMC free article] [PubMed] [Google Scholar]
- Pape HC, Mager R. Nitric oxide controls oscillatory activity in thalamocortical neurons. Neuron. 1992;9:441–448. doi: 10.1016/0896-6273(92)90182-d. [DOI] [PubMed] [Google Scholar]
- Remme MW, Lengyel M, Gutkin BS. The role of ongoing dendritic oscillations in single-neuron dynamics. PLoS Comput Biol. 2009;5:e1000493. doi: 10.1371/journal.pcbi.1000493. [DOI] [PMC free article] [PubMed] [Google Scholar]
- Remme MW, Lengyel M, Gutkin BS. Democracy-independence trade-off in oscillating dendrites and its implications for grid cells. Neuron. 2010;66:429–437. doi: 10.1016/j.neuron.2010.04.027. [DOI] [PMC free article] [PubMed] [Google Scholar]
- Richter H, Klee R, Heinemann U, Eder C. Developmental changes of inward rectifier currents in neurons of the rat entorhinal cortex. Neurosci Lett. 1997;228:139–141. doi: 10.1016/s0304-3940(97)00376-5. [DOI] [PubMed] [Google Scholar]
- Richter H, Heinemann U, Eder C. Hyperpolarization-activated cation currents in stellate and pyramidal neurons of rat entorhinal cortex. Neurosci Lett. 2000;281:33–36. doi: 10.1016/s0304-3940(00)00794-1. [DOI] [PubMed] [Google Scholar]
- Sargolini F, Fyhn M, Hafting T, McNaughton BL, Witter MP, Moser MB, Moser EI. Conjunctive representation of position, direction, and velocity in entorhinal cortex. Science. 2006;312:758–762. doi: 10.1126/science.1125572. [DOI] [PubMed] [Google Scholar]
- Schmitz D, Gloveli T, Behr J, Dugladze T, Heinemann U. Subthreshold membrane potential oscillations in neurons of deep layers of the entorhinal cortex. Neuroscience. 1998;85:999–1004. doi: 10.1016/s0306-4522(98)00113-4. [DOI] [PubMed] [Google Scholar]
- Schreiber S, Erchova I, Heinemann U, Herz AV. Subthreshold resonance explains the frequency-dependent integration of periodic as well as random stimuli in the entorhinal cortex. J Neurophysiol. 2004;92:408–415. doi: 10.1152/jn.01116.2003. [DOI] [PubMed] [Google Scholar]
- Traub RD, Wong RK, Miles R, Michelson H. A model of a CA3 hippocampal pyramidal neuron incorporating voltage-clamp data on intrinsic conductances. J Neurophysiol. 1991;66:635–650. doi: 10.1152/jn.1991.66.2.635. [DOI] [PubMed] [Google Scholar]
- Yoshida M, Hasselmo ME. Persistent firing supported by an intrinsic cellular mechanism in a component of the head direction system. J Neurosci. 2009;29:4945–4952. doi: 10.1523/JNEUROSCI.5154-08.2009. [DOI] [PMC free article] [PubMed] [Google Scholar]
- Zilli EA, Hasselmo ME. Coupled noisy spiking neurons as velocity-controlled oscillators in a model of grid cell spatial firing. J Neurosci. 2010;30:13850–13860. doi: 10.1523/JNEUROSCI.0547-10.2010. [DOI] [PMC free article] [PubMed] [Google Scholar]
- Zilli EA, Yoshida M, Tahvildari B, Giocomo LM, Hasselmo ME. Evaluation of the oscillatory interference model of grid cell firing through analysis and measured period variance of some biological oscillators. PLoS Comput Biol. 2009;5:e1000573. doi: 10.1371/journal.pcbi.1000573. [DOI] [PMC free article] [PubMed] [Google Scholar]


