Abstract
Optical coherence tomography (OCT) is a high-resolution imaging technique that offers microscopic visualization of coronary plaques. The clear and detailed images of OCT generate an intense interest in adopting this technique for both clinical and research purposes. Recent studies have shown that OCT is useful for the assessment of coronary atherosclerotic plaques, in particular the assessment of plaque rupture, erosion, and intracoronary thrombus in patients with acute coronary syndrome. In addition, OCT may enable identifying thin-cap fibroatheroma, the proliferation of vasa vasorum, and the distribution of macrophages surrounding vulnerable plaques. With its ability to view atherosclerotic lesions in vivo with such high resolution, OCT provides cardiologists with the tool they need to better understand the thrombosis-prone vulnerable plaques and acute coronary syndromes. This paper reviews the possibility of OCT for identification of vulnerable plaques in vivo.
1. Introduction
Optical coherence tomography (OCT) is a recently developed intravascular imaging modality using near-infrared light to create images [1–3]. The greatest advantage of OCT is its high resolution (10 to 20 μm), which is 10 times higher than that of intravascular ultrasound (IVUS). OCT can discriminate three layers of the coronary artery wall demonstrating the intima as the signal rich layer nearest the lumen, the media as the signal poor middle layer, and the adventitia as the signal rich layer surrounding the signal poor layer of the media [4]. With regard to tissue characterization, OCT allows us to identify three types of coronary plaques, such as fibrous, fibrocalcific, and lipid. Fibrous plaque is characterized by signal rich, homogenous lesion, fibrocalcific plaque by signal poor, sharp border lesion, and lipid rich plaques as signal poor, diffuse border lesion [5]. A histology-controlled OCT study showed good intra- and interobserver reliabilities (κ = 0.83-0.84) and high sensitivity and specificity in each plaque demonstrating 71–79% and 97-98% for fibrous plaques, 95-96% and 97% for fibrocalcific plaques, and 90–94% and 90–92% for lipid-rich plaques, respectively [5, 6]. Furthermore, OCT can detect plaque rupture (Figure 1), erosion (Figure 2), intracoronary thrombus (Figure 3), thin-cap fibroatheroma (TCFA; Figure 4), and calcified nodule (Figure 5) [7–9]. Although there are some limitations including shallow penetration depth of the infra-red light and complex procedure of image acquisition, the high resolution of OCT provides more detailed structural information of the coronary artery wall compared with conventional imaging modalities [10, 11]. Thus, OCT has been applied for the assessment of culprit lesion morphologies in patients with acute coronary syndrome (ACS).
Figure 1.
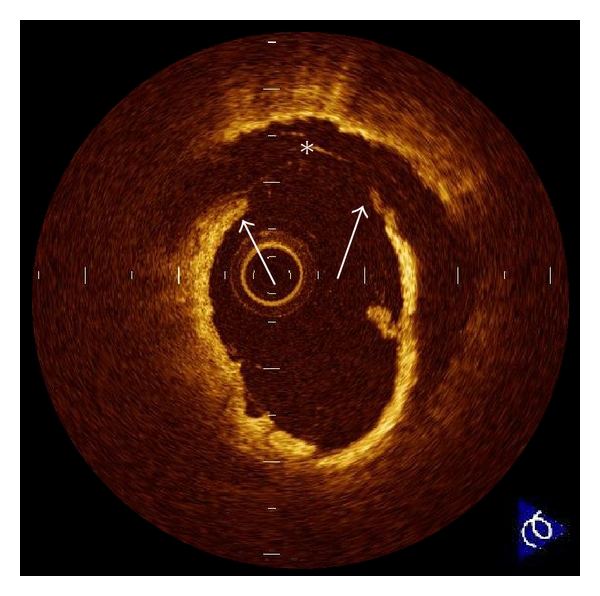
Plaque rupture. Plaque rupture is defined as a presence of fibrous-cap discontinuity (arrows) and a cavity formation (∗) in the plaque. Ruptured plaques usually have an extensive lipid core and a thin fibrous cap. The fibrous cap is the thinnest at the site of rupture, and the plaque cavity indicates loss of lipid core due to rupture.
Figure 2.
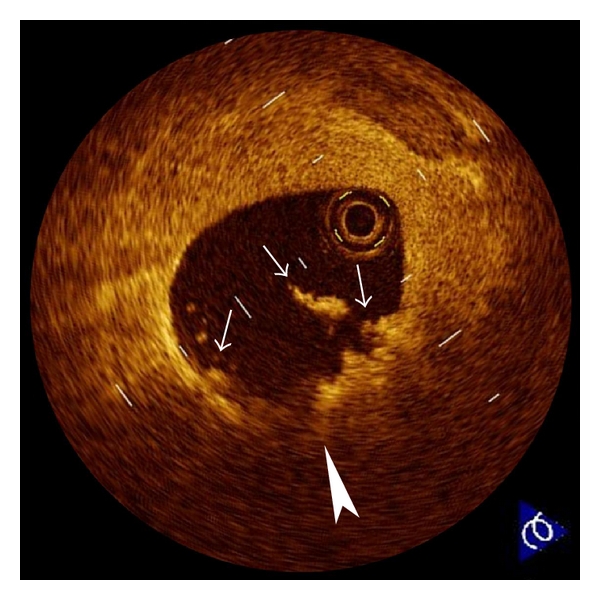
Plaque erosion. Erosion (arrowhead) is usually comprised of OCT evidence of thrombi (arrows), an irregular luminal surface, and no evidence of cap rupture evaluated in multiple adjacent frames. The characteristic of OCT features of erosions are a thick intima and a small or absent lipid core. If the lipid core is present, it does not communicate with luminal thrombi.
Figure 3.
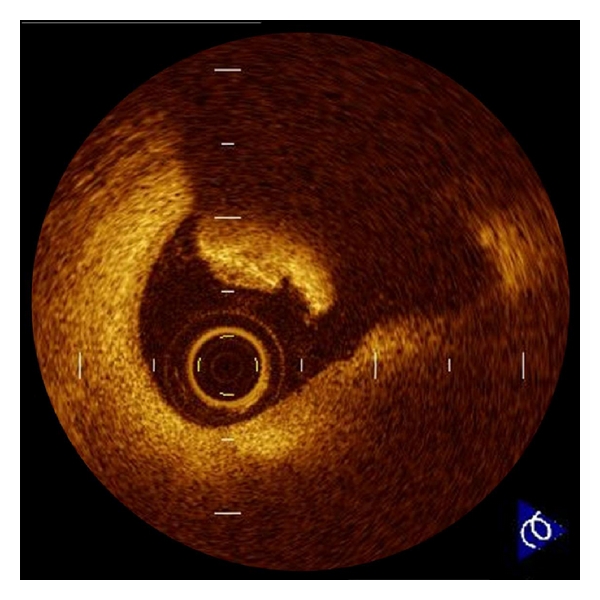
Intracoronary thrombus. Thrombus is defined as a protrusion inside the lumen of the artery with signal attenuation. White thrombus which consists mainly of platelets is identified as signal rich, low-backscattering protrusions in the OCT image, while red thrombus which consists mainly of red blood cells is identified as high-backscattering protrusions inside the lumen of the artery, with signal-free shadowing in the OCT image.
Figure 4.
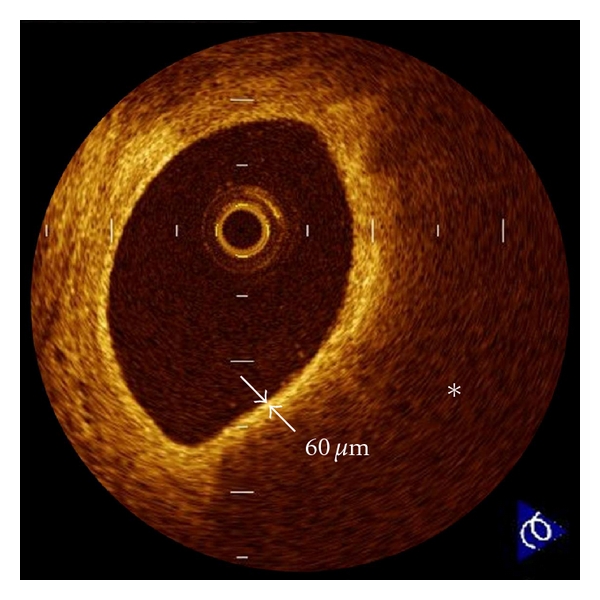
Thin-cap fibroatheroma (TCFA). A fibrous cap (arrows) is identified as a signal-rich homogenous region overlying a lipid core (∗), which is characterized by a signal-poor region. TCFA is defined as a plaque with a fibrous cap measuring <65 μm. OCT-detected TCFAs are often observed in the culprit lesions of acute coronary syndrome.
Figure 5.
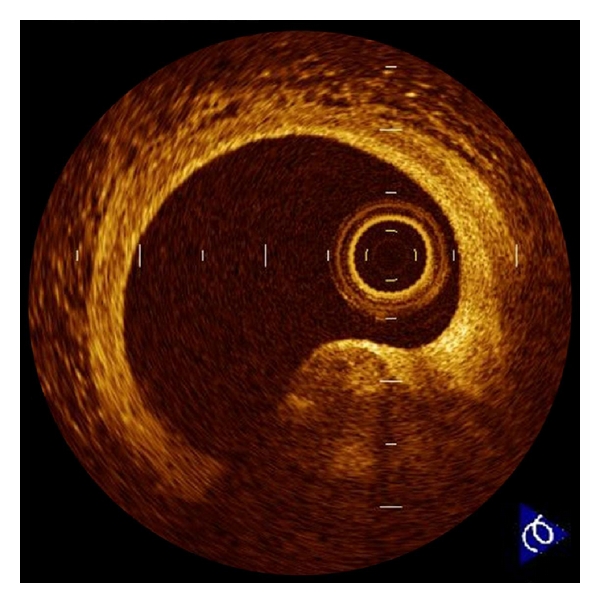
Calcified nodule. Calcified nodule is defined as a protrusion of a signal-poor or heterogeneous region with a sharply delineated border. The origin of this lesion is not precisely known, but it appears to be associated with healed plaques.
2. Pathology of Culprit Lesions in ACS
Autopsy studies have demonstrated that ACS results from sudden luminal narrowing caused by thrombosis based on plaque rupture, erosion, and superficial calcified nodule [12, 13]. In these coronary features, plaque rupture is the most frequent (55 to 60%), plaque erosion to be the second (30 to 35%), and superficial calcified nodule to be the least (2 to 7%) [12]. Plaque rupture is identified by a presence of fibrous cap discontinuity and a cavity formation within the plaque. Atheroma with thin-fibrous cap of <65 μm is thought to be precursor lesion of plaque rupture. Erosion has an area lacking surface endothelium and occurs over lesion with thick intima. Calcified nodule is a plaque with luminal thrombi showing calcific nodule protruding into the lumen through a disrupted thin fibrous cap. Based on these pathohistological findings, thrombosis-prone vulnerable plaques are characterized by 5 major and 5 minor features as listed in Table 1 [13]. Compared with conventional imaging modalities, OCT has an ability to identify these features more precisely in vivo.
Table 1.
Criteria for defining vulnerable plaques [13].
| Major criteria |
| (1) Active inflammation (monocyte/macrophage and sometimes |
| T-cell infiltration) |
| (2) Thin cap with large lipid core |
| (3) Endothelial denudation with superficial platelet aggregation |
| (4) Fissured plaque |
| (5) Stenosis > 90% |
| Minor criteria |
| (1) Superficial calcified nodule |
| (2) Glistening yellow |
| (3) Intraplaque hemorrhage |
| (4) Endothelial dysfunction |
| (5) Outward (positive) remodeling |
3. OCT Assessment of Culprit Lesions in ACS
The first OCT study to assess in vivo culprit lesion morphology in patients with ACS was conducted by Jang et al. [14]. They used a 3.2 Fr. proto-type OCT catheter and revealed higher frequency of TCFA in ACS compared with stable angina pectoris (SAP) (72% in acute myocardial infarction (AMI), 50% in unstable angina pectoris (UAP), and 20% in SAP; P = 0.012). However, this study showed lower frequency of thrombus and plaque rupture in AMI in comparison with previous pathological reports [12, 13]. The thick OCT catheter, the time delay between the symptom onset and imaging (4.6 ± 5.3 days), and the thrombolysis and/or antiplatelet therapy before the imaging might affect the results. Thereafter, Kubo et al. [10] used commercially available OCT system with a 0.014 inch optic fiber, IVUS, and angioscopy in AMI within 6 hours from symptom onset. This study showed superiorities of OCT for the detection of plaque rupture (73% versus 40% versus 43%, P = 0.021), erosion (23% versus 0% versus 3%, P = 0.003), and thrombus (100% versus 33% versus 100%, P < 0.001) compared with IVUS and angioscopy. The frequency of OCT-detected plaque rupture, erosion, and thrombus was similar to that of the pathological reports. The frequency of OCT-detected TCFA was 83%, and the thickness of fibrous cap was 49 ± 21 μm in AMI. Tanaka et al. [15] used OCT to compare the ruptured fibrous cap thickness and the rupture site between exertion-triggered and rest-onset ACS. In the results, rest-onset ACS had thinner ruptured fibrous-cap thickness (50 μm versus 90 μm, P < 0.010) and more frequent rupture near the shoulder of the plaque (57% versus 93%, P = 0.014) in comparison with exertion-triggered ACS. Interestingly, not only TCFAs but also thick cap (up to 150 μm) fibroatheromas were ruptured in exertion-triggered ACS, and the high-sensitive C-reactive protein level was negatively correlated with the thickness of the ruptured fibrous-cap. Exercise-induced high shear stress at the site of the plaque shoulder and fibrous-cap inflammation might be associated with the fibrous-cap disruption of >65 μm thick. By using OCT, Ino et al. [16] showed differences of ruptured plaque morphologies between ST-segment elevated AMI and non-ST-segment elevated ACS. Although the minimum lumen area was similar in both groups, the ruptured cavity size was significantly larger in ST-segment elevated AMI compared with non-ST-segment elevated ACS. Furthermore, the ruptured plaque of which aperture was open wide against the direction of coronary flow was more often seen in ST-segment elevated AMI compared with non-ST-segment elevated ACS (46% versus 17%, P = 0.036). The morphological feature of plaque rupture could relate to the clinical presentation in patients with ACS. Mizukoshi et al. [17] reported that the frequency of plaque rupture (43% versus 13% versus 71%, P < 0.001) and plaque erosion (32% versus 7% versus 8%, P = 0.003) was significantly different among the types of UAP; Braunwald class I, II, and III. The fibrous cap thickness (140 μm versus 150 μm versus 60 μm, P < 0.001), minimal lumen area (0.70 mm2 versus 1.80 mm2 versus 2.31 mm2, P < 0.001), and the frequency of thrombus (72% versus 30% versus 73%, P < 0.001) were also different among the types of UAP. This clinical OCT study disclosed that the culprit plaque in class III UAP might be more vulnerable than the other classes.
Unstable lesion morphologies before percutaneous coronary intervention (PCI) affect the outcome after the procedure. An observational OCT study [18] demonstrated that TCFA was often seen at target lesions of the patients with noreflow after PCI compared with good reflow (50% versus 16%, P = 0.005). The frequency of the noreflow phenomenon increased according to the size of the lipid arc as determined by OCT. A serial OCT study [19] showed markedly different vascular response up to 9 months after drug-eluting stent implantation between the patients with UAP and SAP. Acute stent malapposition (67% versus 32%, P = 0.038) and tissue protrusion after PCI (79% versus 42%, P = 0.005) were observed more frequently in the UAP patients. Plaque rupture was significantly increased after PCI in the UAP patients (42% to 75%, P = 0.018), and the persistence of core cavity after plaque rupture at 9-month' followup (28% versus 4%, P = 0.031) was observed more frequently in the UAP patients compared with the SAP patients. At 9 months' follow-up, the frequency of malapposed stent (33% versus 4%, P = 0.012) and partially uncovered stent by neointima (72% versus 37%, P = 0.019) was significantly greater in the UAP patients than that in the SAP patients.
Recent OCT studies have suggested the development of in-stent neoatherosclerosis after PCI. Kashiwagi et al. [20] and Nishiguchi et al. [21] investigated the lesions with very late stent thrombosis by using OCT and demonstrated lipidic plaque formation, TCFA, and plaque rupture within the neointima in the stented segments. Although late stent thrombosis is thought to be associated with delayed endothelialization, these reports highlight that it can occur despite full stent coverage. Atherosclerotic developments within the neointima might play an important role in very late stent thrombosis (Figure 6).
Figure 6.
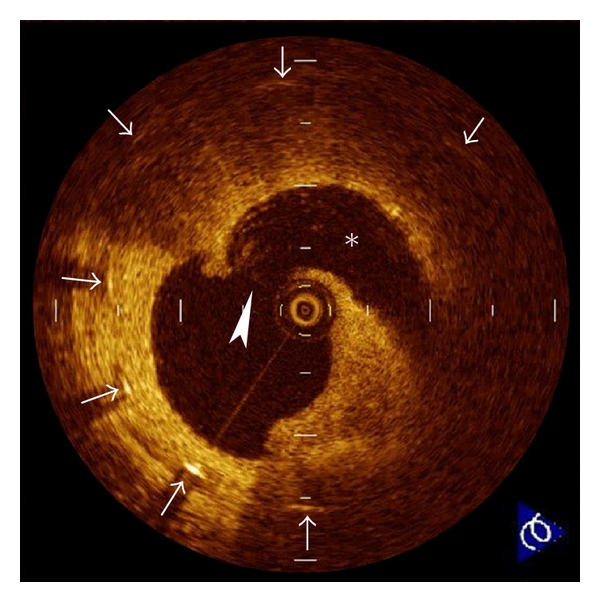
Neointimal plaque rupture. A 71-year-old male was admitted to our hospital with very late (>10 years) bare-metal stent thrombosis. OCT disclosed a plaque rupture (arrowhead) and cavity formation (∗) within neointima in the stented segment (arrows).
4. OCT-Detected Vulnerable Plaques
The term “vulnerable plaque” is used to describe thrombosis-prone plaques. The precursor lesion for plaque rupture is characterized by a thin fibrous cap heavily infiltrated macrophages and an underlying lipid core. Virmani et al. [12] defined plaque vulnerability based on the actual thickness of the histological section from measurements made of plaque ruptures. TCFA was defined as a lesion with a fibrous cap <65 μm thick. A thickness of 65 μm was chosen as a criterion of instability because in rupture the mean cap thickness was 23 ± 19 μm; 95% of caps measured less than 65 μm within a limit of only two standard deviations. At present, OCT might be the best tool to detect TCFA in vivo [22–25]. Kume et al. [7] examined 35 lipid-rich plaques from 38 human cadavers and demonstrated a good correlation of the fibrous cap thickness between OCT and histology (r = 0.90; P < 0.001). In the clinical setting, Fujii et al. [26] showed that OCT-detected TCFA was associated with high-sensitive C-reactive protein, and its distribution in the coronary artery tree was similar to that in the previous autopsy reports. Kashiwagi et al. [27] used multidetector computed tomography to compare lesion characteristics between OCT-detected TCFA and non-TCFA. Positive remodeling (76% versus 31%, P < 0.001) and ring-like enhancement (44% versus 4%, P < 0.001) as determined by multidetector computed tomography were observed more frequently in OCT-detected TCFAs than in non-TCFAs. Computed tomography attenuation value was significantly lower in OCT-detected TCFAs than that in the non-TCFAs (35.1 ± 32.3 HU versus 62.0 ± 33.6 HU, P < 0.001). Kubo et al. [28] assessed the relationship between plaque color evaluated by coronary angioscopy and fibrous cap thickness estimated by OCT in vivo. As a result, there was a significant negative correlation between yellow color intensity and fibrous cap thickness (P < 0.001). Furthermore, 80% of intensive yellow plaques were OCT-detected TCFAs with a cap thickness of <65 μm. Sawada et al. [29] compared the feasibility for detecting TCFA between OCT and virtual histology IVUS. Although the positive ratio of virtual histology IVUS for detecting TCFA was 45.9%, that of OCT was 77.8%. On top of its reliability as a tool to measure the fibrous-cap thickness in vivo, a recent OCT study conducted by Takarada et al. [30, 31] demonstrated that the lipid-lowering therapy with statin for 9 months significantly increased the fibrous-cap thickness in patients with hypercholesterolemia (151 ± 110 to 280 ± 120 μm, P < 0.001). As therapies to prevent or make regression of atherosclerosis are developed, OCT can help to assess the treatment efficacy for plaque stabilization.
Plaque neovascularization is a common feature of vulnerable plaque. Proliferation of microvessels is considered to be related to intraplaque hemorrhage and plaque destabilization. The high resolution of OCT provides an opportunity to detect plaque neovascularization in vivo (Figure 7). Kitabata et al. [32] demonstrated increase of microvessels density in OCT-detected TCFAs in vivo. The presence of microvessels in the plaques was also associated with positive vessel remodeling and elevated high-sensitive C-reactive protein levels. The OCT evaluation of microvessels density might be helpful to assess plaque vulnerability.
Figure 7.
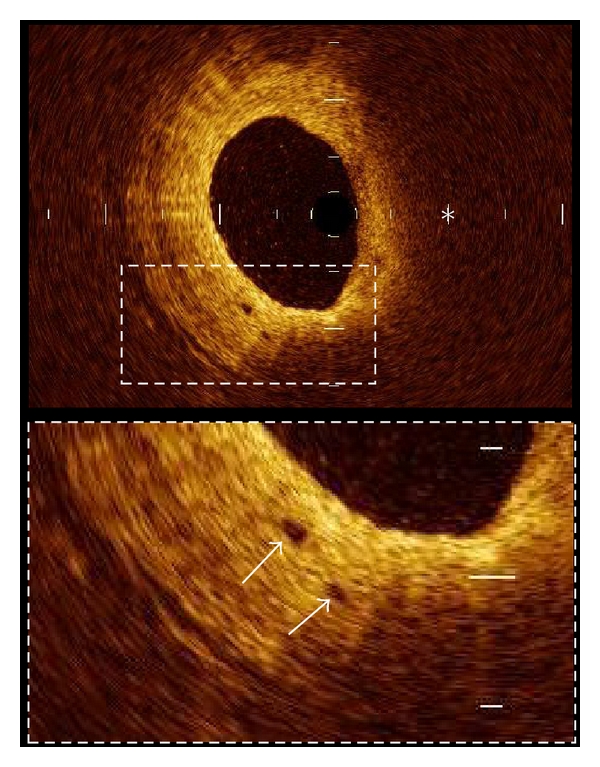
Plaque neovascularization. Microvessels within the intima (arrows) appear as signal poor voids that are sharply delineated. Two microvessels are located in thickened intima at 7 o'clock position. (∗ = lipid).
A unique aspect of OCT is its ability to visualize the macrophages (Figure 8). Tearney et al. [33] and MacNeill et al. [34] descried the potential of OCT to estimate macrophage accumulation within fibrous caps. There was a high degree of positive correlation between OCT and histological measurements of fibrous cap macrophage density (r < 0.84, P < 0.0001). A range of OCT signal standard deviation thresholds (6.15% to 6.35%) yielded 100% sensitivity and specificity for identifying caps containing >10% CD68 staining in their study.
Figure 8.
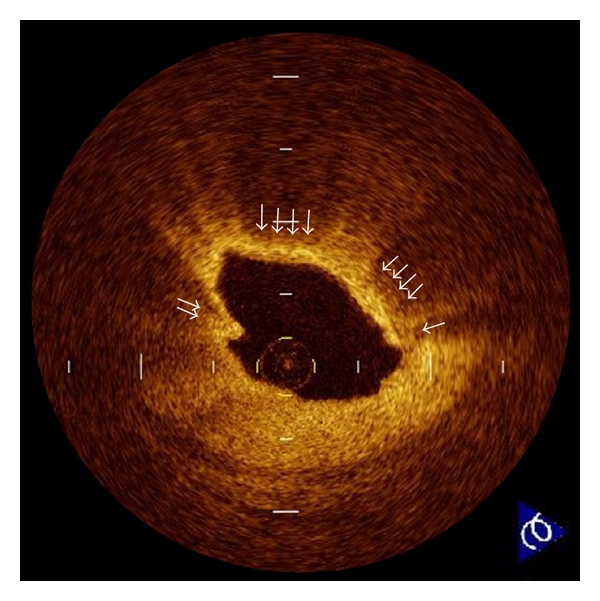
Macrophages. Macrophages (arrows) are seen as signal-rich, distinct, or confluent punctuate regions that exceed the intensity of background speckle noise. The high contrast and resolution of OCT enable the quantification of macrophages within fibrous caps of atherosclerotic plaques.
5. Limitations of OCT
The current commercially available time-domain OCT system requires vessel occlusion by means of gentle balloon inflation and vessel flushing with lactated Ringers' solution or saline infusion at the time of image acquisition because the near-infrared light signals are attenuated by red blood cells. Therefore, the assessment of long coronary segment and the observation of left main coronary artery might be limited. Inadequate displacement of blood can be a problem in vessels >3.5 mm in diameter, where large bifurcations are present and in the presence of competitive flow from collaterals or bypass grafts. In addition, there is concern about the local consequences of balloon inflation. To overcome this limitation, a simplified technique for coronary blood removal, which was achieved through continuous injection of contrast agents or dextran with lactate Ringers' solution, is recommended [35, 36]. This nonocclusive technique of OCT image acquisition is safe and useful and promises to reduce the procedural time. A further limitation of OCT is the relatively shallow axial penetration depth of 2 mm. The OCT signal does not reach the back wall of thick atherosclerotic lesions. The penetration depth of OCT depends on tissue characteristics. Lipid-rich plaque or coronary thrombus causes OCT signal attenuation, which interrupts to observe deep layers of coronary artery wall. OCT is not appropriate for the quantification of lipid-core size and the evaluation of arterial remodeling. This drawback may affect the role of OCT for assessment of lesion instability. The current OCT is well suited for the assessment of the plaque morphologies within 500 μm of the luminal surface.
6. Future Perspectives of OCT
Recently, a second-generation OCT technology, named frequency-domain OCT, has been developed. This new technology will solve the current time-domain OCT limitations by imaging at much higher frame rates with slightly deeper penetration depth and greater scan area [37–39]. In combination with a short, nonocclusive flush and rapid spiral pullback, the higher frame rates generated by frequency-domain OCT enable imaging of the 3-dimensional microstructure of longer segments of coronary arteries [40]. In addition, frequency-domain OCT facilitates the acquisition of spectroscopic and polarization data for tissue characterization [41]. The development of frequency-domain OCT would allow easy and precise identification of vulnerable plaque in daily clinical practice.
7. Conclusions
The high resolution of OCT provides histology-grade definition of the microstructures of coronary unstable plaques in vivo. OCT can visualize unstable lesion morphologies in vivo which have been demonstrated by histological examinations. Thus, OCT allows a greater understanding of the pathophysiology of ACS and may have a potential to propose guidance for the appropriate patient-specific therapeutic approach. Although more clinical research with greater number of subjects and development of the imaging technology are required, OCT will play an important role in the future cardiology.
Disclosure
All authors do not have a financial interest, arrangement or affiliation with one or more organizations that could be perceived as a real or apparent conflict of interest in the context of the subject of this paper.
Abbreviations and Acronyms
- ACS:
Acute coronary syndrome
- AMI:
Acute myocardial infarction
- IVUS:
Intravascular ultrasound
- OCT:
Optical coherence tomography
- PCI:
Percutaneous coronary intervention
- SAP:
Stable angina pectoris
- TCFA:
Thin cap fibroatheroma
- UAP:
Unstable angina pectoris.
References
- 1.Akasaka T, Kubo T, Mizukoshi M, et al. Pathophysiology of acute coronary syndrome assessed by optical coherence tomography. Journal of Cardiology. 2010;56(1):8–14. doi: 10.1016/j.jjcc.2010.05.005. [DOI] [PubMed] [Google Scholar]
- 2.Low AF, Tearney GJ, Bouma BE, Jang I-K. Technology insight: optical coherence tomography—current status and future development. Nature Clinical Practice Cardiovascular Medicine. 2006;3(3):154–162. doi: 10.1038/ncpcardio0482. [DOI] [PubMed] [Google Scholar]
- 3.Kubo T, Akasaka T. Recent advances in intracoronary imaging techniques: focus on optical coherence tomography. Expert Review of Medical Devices. 2008;5(6):691–697. doi: 10.1586/17434440.5.6.691. [DOI] [PubMed] [Google Scholar]
- 4.Kume T, Akasaka T, Kawamoto T, et al. Assessment of coronary intima—media thickness by optical coherence tomography: comparison with intravascular ultrasound. Circulation Journal. 2005;69(8):903–907. doi: 10.1253/circj.69.903. [DOI] [PubMed] [Google Scholar]
- 5.Yabushita H, Bouma BE, Houser SL, et al. Characterization of human atherosclerosis by optical coherence tomography. Circulation. 2002;106(13):1640–1645. doi: 10.1161/01.cir.0000029927.92825.f6. [DOI] [PubMed] [Google Scholar]
- 6.Kume T, Akasaka T, Kawamoto T, et al. Assessment of coronary arterial plaque by optical coherence tomography. American Journal of Cardiology. 2006;97(8):1172–1175. doi: 10.1016/j.amjcard.2005.11.035. [DOI] [PubMed] [Google Scholar]
- 7.Kume T, Akasaka T, Kawamoto T, et al. Measurement of the thickness of the fibrous cap by optical coherence tomography. American Heart Journal. 2006;152(4):755–e1. doi: 10.1016/j.ahj.2006.06.030. [DOI] [PubMed] [Google Scholar]
- 8.Kume T, Akasaka T, Kawamoto T, et al. Assessment of coronary arterial thrombus by optical coherence tomography. American Journal of Cardiology. 2006;97(12):1713–1717. doi: 10.1016/j.amjcard.2006.01.031. [DOI] [PubMed] [Google Scholar]
- 9.Kubo T, Xu C, Wang Z, van Ditzhuijzen NS, Bezerra HG. Plaque and thrombus evaluation by optical coherence tomography. International Journal of Cardiovascular Imaging. 2011;27(2):289–298. doi: 10.1007/s10554-010-9790-1. [DOI] [PubMed] [Google Scholar]
- 10.Kubo T, Imanishi T, Takarada S, et al. Assessment of culprit lesion morphology in acute myocardial infarction: ability of optical coherence tomography compared with intravascular ultrasound and coronary angioscopy. Journal of the American College of Cardiology. 2007;50(10):933–939. doi: 10.1016/j.jacc.2007.04.082. [DOI] [PubMed] [Google Scholar]
- 11.Kubo T, Nakamura N, Matsuo Y, et al. Virtual histology intravascular ultrasound compared with optical coherence tomography for identifcation of thin-cap fibroatheroma. International Heart Journal. 2011;52(3):175–179. doi: 10.1536/ihj.52.175. [DOI] [PubMed] [Google Scholar]
- 12.Virmani R, Kolodgie FD, Burke AP, Farb A, Schwartz SM. Lessons from sudden coronary death: a comprehensive morphological classification scheme for atherosclerotic lesions. Arteriosclerosis, Thrombosis, and Vascular Biology. 2000;20(5):1262–1275. doi: 10.1161/01.atv.20.5.1262. [DOI] [PubMed] [Google Scholar]
- 13.Naghavi M, Libby P, Falk E, et al. From vulnerable plaque to vulnerable patient: a call for new definitions and risk assessment strategies: part I. Circulation. 2003;108(14):1664–1672. doi: 10.1161/01.CIR.0000087480.94275.97. [DOI] [PubMed] [Google Scholar]
- 14.Jang IK, Tearney GJ, MacNeill B, et al. In vivo characterization of coronary atherosclerotic plaque by use of optical coherence tomography. Circulation. 2005;111(12):1551–1555. doi: 10.1161/01.CIR.0000159354.43778.69. [DOI] [PMC free article] [PubMed] [Google Scholar]
- 15.Tanaka A, Imanishi T, Kitabata H, et al. Morphology of exertion-triggered plaque rupture in patients with acute coronary syndrome: an optical coherence tomography study. Circulation. 2008;118(23):2368–2373. doi: 10.1161/CIRCULATIONAHA.108.782540. [DOI] [PubMed] [Google Scholar]
- 16.Ino Y, Kubo T, Tanaka A, Kuroi A, Tsujioka H. Difference of culprit lesion morphologies between ST-segment elevation myocardial infarction and non-ST-segment elevation acute coronary syndrome. JACC: Cardiovascular Interventions. 2011;4(1):76–82. doi: 10.1016/j.jcin.2010.09.022. [DOI] [PubMed] [Google Scholar]
- 17.Mizukoshi M, Imanishi T, Tanaka A, et al. Clinical classification and plaque morphology determined by optical coherence tomography in unstable angina pectoris. American Journal of Cardiology. 2010;106(3):323–328. doi: 10.1016/j.amjcard.2010.03.027. [DOI] [PubMed] [Google Scholar]
- 18.Tanaka A, Imanishi T, Kitabata H, et al. Lipid-rich plaque and myocardial perfusion after successful stenting in patients with non-ST-segment elevation acute coronary syndrome: an optical coherence tomography study. European Heart Journal. 2009;30(11):1348–1355. doi: 10.1093/eurheartj/ehp122. [DOI] [PubMed] [Google Scholar]
- 19.Kubo T, Imanishi T, Kitabata H, et al. Comparison of vascular response after sirolimus-eluting stent implantation between patients with unstable and stable angina pectoris: a serial optical coherence tomography study. JACC: Cardiovascular Imaging. 2008;1(4):475–484. doi: 10.1016/j.jcmg.2008.03.012. [DOI] [PubMed] [Google Scholar]
- 20.Kashiwagi M, Kitabata H, Tanaka A, et al. Very late clinical cardiac event after BMS implantation: in vivo optical coherence tomography examination. JACC: Cardiovascular Imaging. 2010;3(5):525–527. doi: 10.1016/j.jcmg.2010.01.005. [DOI] [PubMed] [Google Scholar]
- 21.Nishiguchi T, Kitabata H, Tanaka A, et al. Very late stent thrombosis after drug-eluting stent in segment with neointimal tissue coverage. JACC: Cardiovascular Imaging. 2010;3(4):445–446. doi: 10.1016/j.jcmg.2009.07.015. [DOI] [PubMed] [Google Scholar]
- 22.Tanaka A, Imanishi T, Kitabata H, et al. Distribution and frequency of thin-capped fibroatheromas and ruptured plaques in the entire culprit coronary artery in patients with acute coronary syndrome as determined by optical coherence tomography. American Journal of Cardiology. 2008;102(8):975–979. doi: 10.1016/j.amjcard.2008.05.062. [DOI] [PubMed] [Google Scholar]
- 23.Tanimoto T, Imanishi T, Tanaka A, et al. Various types of plaque disruption in culprit coronary artery visualized by optical coherence tomography in a patient with unstable angina. Circulation Journal. 2009;73(1):187–189. doi: 10.1253/circj.cj-07-0715. [DOI] [PubMed] [Google Scholar]
- 24.Kitabata H, Kubo T, Akasaka T. Identification of multiple plaque ruptures by optical coherence tomography in a patient with acute myocardial infarction: a three-vessel study. Heart. 2008;94(5):p. 544. doi: 10.1136/hrt.2007.124339. [DOI] [PubMed] [Google Scholar]
- 25.Kubo T, Imanishi T, Kashiwagi M, et al. Multiple coronary lesion instability in patients with acute myocardial infarction as determined by optical coherence tomography. American Journal of Cardiology. 2010;105(3):318–322. doi: 10.1016/j.amjcard.2009.09.032. [DOI] [PubMed] [Google Scholar]
- 26.Fujii K, Kawasaki D, Masutani M, et al. OCT assessment of thin-cap fibroatheroma distribution in native coronary arteries. JACC: Cardiovascular Imaging. 2010;3(2):168–175. doi: 10.1016/j.jcmg.2009.11.004. [DOI] [PubMed] [Google Scholar]
- 27.Kashiwagi M, Tanaka A, Kitabata H, et al. Feasibility of noninvasive assessment of thin-cap fibroatheroma by multidetector computed tomography. JACC: Cardiovascular Imaging. 2009;2(12):1412–1419. doi: 10.1016/j.jcmg.2009.09.012. [DOI] [PubMed] [Google Scholar]
- 28.Kubo T, Imanishi T, Takarada S, et al. Implication of plaque color classification for assessing plaque vulnerability: a coronary angioscopy and optical coherence tomography investigation. JACC: Cardiovascular Interventions. 2008;1(1):74–80. doi: 10.1016/j.jcin.2007.11.001. [DOI] [PubMed] [Google Scholar]
- 29.Sawada T, Shite J, Garcia-Garcia HM, et al. Feasibility of combined use of intravascular ultrasound radiofrequency data analysis and optical coherence tomography for detecting thin-cap fibroatheroma. European Heart Journal. 2008;29(9):1136–1146. doi: 10.1093/eurheartj/ehn132. [DOI] [PubMed] [Google Scholar]
- 30.Takarada S, Imanishi T, Kubo T, et al. Effect of statin therapy on coronary fibrous-cap thickness in patients with acute coronary syndrome: assessment by optical coherence tomography study. Atherosclerosis. 2009;202(2):491–497. doi: 10.1016/j.atherosclerosis.2008.05.014. [DOI] [PubMed] [Google Scholar]
- 31.Takarada S, Imanishi T, Ishibashi K, et al. The effect of lipid and inflammatory profiles on the morphological changes of lipid-rich plaques in patients with non-ST-segment elevated acute coronary syndrome: follow-up study by optical coherence tomography and intravascular ultrasound. JACC: Cardiovascular Interventions. 2010;3(7):766–772. doi: 10.1016/j.jcin.2010.05.001. [DOI] [PubMed] [Google Scholar]
- 32.Kitabata H, Tanaka A, Kubo T, et al. Relation of microchannel structure identified by optical coherence tomography to plaque vulnerability in patients with coronary artery disease. American Journal of Cardiology. 2010;105(12):1673–1678. doi: 10.1016/j.amjcard.2010.01.346. [DOI] [PubMed] [Google Scholar]
- 33.Tearney GJ, Yabushita H, Houser SL, et al. Quantification of macrophage content in atherosclerotic plaques by optical coherence tomography. Circulation. 2003;107(1):113–119. doi: 10.1161/01.cir.0000044384.41037.43. [DOI] [PubMed] [Google Scholar]
- 34.MacNeill BD, Jang IK, Bouma BE, et al. Focal and multi-focal plaque macrophage distributions in patients with acute and stable presentations of coronary artery disease. Journal of the American College of Cardiology. 2004;44(5):972–979. doi: 10.1016/j.jacc.2004.05.066. [DOI] [PubMed] [Google Scholar]
- 35.Prati F, Cera M, Ramazzotti V, et al. From bench to bedside—a novel technique of acquiring OCT images. Circulation Journal. 2008;72(5):839–843. doi: 10.1253/circj.72.839. [DOI] [PubMed] [Google Scholar]
- 36.Kataiwa H, Tanaka A, Kitabata H, Imanishi T, Akasaka T. Safety and usefulness of non-occlusion image acquisition technique for optical coherence tomography. Circulation Journal. 2008;72(9):1536–1537. doi: 10.1253/circj.cj-08-0406. [DOI] [PubMed] [Google Scholar]
- 37.Kubo T, Akasaka T. OCT-ready for prime time? Clinical applications of optical coherence tomography. Cardiac Interventions Today. 2009;4(1):35–37. [Google Scholar]
- 38.Takarada S, Imanishi T, Liu Y, et al. Advantage of next-generation frequency-domain optical coherence tomography compared with conventional time-domain system in the assessment of coronary lesion. Catheterization and Cardiovascular Interventions. 2010;75(2):202–206. doi: 10.1002/ccd.22273. [DOI] [PubMed] [Google Scholar]
- 39.Kubo T, Akasaka T. Optical coherence tomography imaging: current status and future perspectives—current and future developments in OCT. Cardiovascular Intervention and Therapeutics. 2009;25(1):2–10. doi: 10.1007/s12928-009-0006-3. [DOI] [PubMed] [Google Scholar]
- 40.Tearney GJ, Waxman S, Shishkov M, et al. Three-dimensional coronary artery microscopy by intracoronary optical frequency domain imaging. JACC: Cardiovascular Imaging. 2008;1(6):752–761. doi: 10.1016/j.jcmg.2008.06.007. [DOI] [PMC free article] [PubMed] [Google Scholar]
- 41.Tearney GJ, Jang IK, Bouma BE. Optical coherence tomography for imaging the vulnerable plaque. Journal of Biomedical Optics. 2006;11(2) doi: 10.1117/1.2192697. Article ID 021002. [DOI] [PMC free article] [PubMed] [Google Scholar]


