

Abstract
Immune responses mediated by cytotoxic T lymphocytes (CTLs) have often been found to be functionally impaired in persistent infections. It is assumed that this impairment contributes to persistence of the infection. In this study, we compare the killing efficacy of CD8+ T-cell responses in mice acutely and persistently infected with the lymphocytic choriomeningitis virus, using an in vivo CTL killing assay. To infer the killing efficacy of CTLs, we developed a new mathematical model describing the disappearance of peptide-pulsed cells from the blood of the mice over time. We estimate a lower half-life for peptide-pulsed cells in acute infection than in persistent infection, which indicates a higher killing efficacy of the CD8+ T-cell response in acute infection. However, by controlling for the different levels of CTLs in acutely and persistently infected mice, we find that CTLs in persistent infection are only two times less efficacious than CTLs in acute infections. These results strongly suggest that the in vivo cytotoxicity of CD8+ T-cell responses in persistent infection is modulated via the number of CTLs rather than their individual functionality.
Keywords: population biology, within host, cellular immune response, persistent infection, cytotoxic T lymphocyte efficacy, mathematical modelling
1. Introduction and approach
Persistent infections like e.g. HIV or Hepatitis C virus (HCV) are major causes of morbidity and mortality affecting millions of people. Although it is not completely understood what causes some pathogens to persist while others are cleared, immune responses during persistent infections appear to be, at least in part, dysfunctional. Molecular markers for immunological functions of CD8+ T cells, such as the production of cytokines or their proliferation capacity, are downregulated in many persistent infections, e.g. in HIV [1–3], HCV [4–6], Epstein–Barr virus (EBV) [7,8], Simian Immunodeficiency virus [9] and lymphocytic choriomeningitis virus (LCMV) [10,11]. By using more direct assays for the killing ability of CD8+ T cells, such as the 51Cr release assay, several groups also showed that the killing ability of CD8+ T cells is reduced during persistent infections [12,13]. This finding is not consistent as other groups reported on largely intact in vitro killing capacity of CD8+ T cells during chronic LCMV infection [11]. Experimental methods to measure the in vivo killing capacity of CD8+ T cells are available [14,15] and these methods have been used to describe the in vivo killing of CD8+ T cells in acute and persistent infections [11,16].
In this paper, we compare the in vivo killing ability of CD8+ T cells in persistent and acute LCMV infection. To this end, we generated experimental data using the in vivo cytotoxic T lymphocyte (CTL) killing assay in mice infected with a high or a low dose of LCMV Docile, which results in an acute or persistent infection, respectively ([11], fig. S6). The assay involves the injection of target cells, which are recognized by antiviral CD8+ cells, into mice. These CD8+ T cells have been generated by infecting mice with LCMV Docile 15 days before the transfer of the target cells. Target cells were pulsed with the LCMV-derived epitopes GP33 and NP396. These two immunodominant epitopes of LCMV were chosen as in persistent infection CD8+ T cells specific for GP33 show decreased cytokine production, while NP396-specific CD8+ T cells are reduced in numbers but still measurable 15 days after infection ([11], fig. S6). At several time points after the transfer of target cells, blood samples were taken and analysed for the different target cell populations (see figure 1 and the electronic supplementary material for a detailed description of the experiment). The disappearance of target cells from blood over time was used to infer the killing capacity of CD8+ T cells. The disappearance of target cells in the blood is the result of complex dynamical processes within the mice, such as the migration of target cells between various anatomical compartments and dependences of the killing on the densities of target cells and CD8+ T cells in these compartments. To disentangle all these processes and extract information about the efficacy of CTL killing from these data, mathematical modelling is needed. We analysed the data with a mathematical model that accounts for target cell migration and controls for differences in the level of CD8+ T cells between persistently and acutely infected mice. Our model allows for the estimation of killing rate constants from longitudinal measurements obtained from the blood, unlike previously published approaches that relied on a single terminal measurement in the spleen [17,18]. Because measurements from the blood are easier to obtain as they do not require sacrificing the mouse, our modelling approach will be useful for future studies on CTL efficacy.
Figure 1.

Design of the in vivo CTL killing assay. Labelled target cells were intravenously transferred into naive or acutely or chronically infected mice on day 15 post-infection. Blood samples are taken at the indicated time points and analysed for specific lysis of the target cells. Four hours after transfer of the target cells, the spleen was analysed for specific lysis of target cells and the amount of epitope-specific CTLs.
The main question we investigate is: does an individual CD8+ T cell have a lower killing efficacy during persistent infection than during an acute infection? Or is the reduced killing in persistent infections simply a result of lower levels of virus-specific CD8+ T cells? We concluded that after controlling for the differences in the individual CD8+ T-cell levels in our mathematical model, the killing efficacy of CTLs is not different in acute and persistent infection. Thus, the killing capacity of CD8+ T-cell responses is primarily modulated by the cell number, rather than the killing capacity of individual CD8+ T cells.
2. Results
(a). CD8+ T-cell responses in acutely and persistently infected mice
In each acutely or persistently infected mouse, as well as in naive mice of a control group, we measured the frequency of CD8+ T cells in the spleen 4 h after the transfer of the target cells. The levels of CD8+ T cells recognizing either the epitope GP33 or NP396 were determined using tetramer staining. We observe a significant difference in the level of GP33-specific CD8+ T cells between acutely and persistently infected mice (two-tailed t-test on log-transformed values, GP33: p = 0.039, NP396: p = 0.062), while the total CD8+ T-cell level does not differ between the two groups (p = 0.61) (figure 2). Measurements of CD8+ T cells specific for the NP396 epitope in the persistent infection are close to the limit of detection, consistent with previous observations [10,19,20].
Figure 2.

(a) Frequency of total and (b) tetramer-specific CD8+ T cells in the spleen of mice measured by tetramer staining 4 h after the transfer of target cells and separated by the type of infection. The frequency is always relative to the total number of splenocytes. Each symbol corresponds to a specific mouse in a group. Unfilled symbols, naive; filled grey symbols, acute; filled black symbols, persistent.
We additionally estimate the effector–target cell ratio in the spleen of each mouse (see the electronic supplementary material, figure S2). For the GP33 epitope, we estimate a fourfold higher CTL-target cell ratio in acutely infected mice than in persistently infected mice (11.866 versus 2.872, Wilcoxon–Mann–Whitney test p = 0.0015). There is a 10-fold difference in the corresponding CTL-target cell ratios for the NP396 epitope (0.408 versus 0.035, p = 5.6 × 10⁻⁵).
(b). Target cell frequencies in blood and spleen
Over time, the transferred cells decrease in the blood. Cells presenting viral peptides disappear faster from the blood than the control cells (except cells loaded with NP396 in persistently infected mice), indicating that a significant fraction of the pulsed cells are bound or killed by CTLs. The rate of disappearance is higher in acutely than in persistently infected mice (figure 3), which is most obvious in the specific killing of NP396-loaded target cells. In acutely infected mice, the frequency of NP396-pulsed target cells relative to all target cells decreases over time. By contrast, the frequency of NP396-pulsed target cells stays constant in persistently infected mice, similar to the dynamics observed in naive mice. At the end of the experiment, 4 h after the transfer of the target cells, the ratio of target to control cells highly correlate in blood and spleen (Pearson, GP33: r2 = 0.996, p = 1.3 × 10⁻⁸ and NP396: r2 = 0.976, p = 6.8 × 10⁻⁶).
Figure 3.

Composition of the target cell pool in the blood ([0, 240 min]) and in the spleen (4 h after transfer). (a) The frequency of the unpulsed, (b) GP33-pulsed and (c) NP396-pulsed target cells relative to the total number of cells transferred are shown for each mouse, separately for each infection group (naive (black solid lines), acutely (light grey lines) or persistently (dark grey lines) infected).
(c). Analysis of cell migration
To determine the migration of cells in mice, we performed an additional experiment, in which we measured the number of unloaded target cells in the blood, spleen, liver and lung at different time points after transfer (figure 4a–d). From these data, we determine a function μ(t) that describes the net flux of cells in and out of the spleen, which we assume to be the main compartment where killing of target cells occurs. The congruent dynamics in blood, lung and liver indicates that target cells are, if at all, only poorly able to home to lung and liver. We approximate the probability of a transferred cell to invade the splenic tissue until time t, 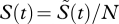 , based on the observed number of transferred cells in the spleen,
  , and the total number of cells transferred, N (figure 4d). We calculate μ(t) as μ(t) = (dS(t)/dt)/a(1 − S(t)). In this expression, a denotes the fraction of the blood that passes through the spleen per minute. A detailed explanation of this expression for μ(t) is given in the electronic supplementary material. At t0 = 105 min after the transfer of the cells, μ(t) becomes smaller than 0, indicating that more cells leave the splenic tissue than are able to enter (figure 4e).
Figure 4.

Analysis of the migration of target cells: unloaded target cells were transferred into naive mice and the number of transferred cells in lung, liver, spleen and 50 µl blood were determined at different time points (electronic supplementary material). The plots show the observed fraction of total cells transferred in (a) 1ml blood, (b) one liver lobe, (c) lung or (d) spleen for each mouse (circles). Squares denote the corresponding mean per time point. The black line in (d) denotes the approximating spline function for the probability of a cell to be in the spleen S(t). (e) Numerical approximation of the netflux rate μ(t), as defined by equation (S3) in the electronic supplementary material, with S(t) as determined in (d).
(d). Estimating cytotoxic T lymphocyte efficacy
From the data of the in vivo CTL killing assay, we can calculate the proportion of pulsed target cells killed by 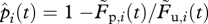 , with
  and
and  denoting the frequencies of pulsed and unpulsed cells in the blood, respectively. We assume that the killing of target cells solely occurs in the spleen (electronic supplementary material). To compare the efficacy of individual CTLs in acute and persistent infections, we estimate a rate constant k, which corrects for the quantity of the individual CTL response. Target cells that are susceptible to CTL-mediated killing can be killed at a rate f(k,C), which is a function of the killing rate constant k and the individual CTL frequency measured in the spleen, C. For the beginning, we assume f(k,C) = kC similar to a basic mass-action-dependent killing term. The probability of a target cell to be killed until time point t is then given by
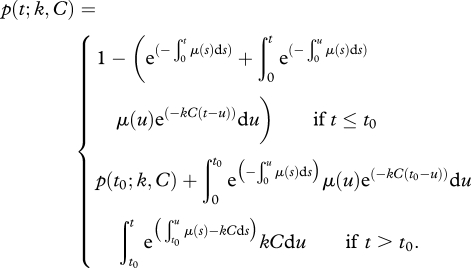 |
2.1 |
Here, t0 denotes the time point at which the net flux rate μ(t) becomes negative. We provide a detailed derivation of equation (2.1) in the electronic supplementary material.
We estimated a killing rate constant k for each epitope and mouse group by fitting equation (2.1) to the observed proportion of target cells killed in the blood. The estimated killing rate constant k for GP33-pulsed target cells in acutely infected mice (k = 11.85 min−1) is about two times higher than the corresponding one estimated in persistently infected animals (k = 5.11 min−1). This difference is not significant according to the 95% confidence intervals (CI) for the estimates (table 1). These values lead to an estimated half-life of the GP33-pulsed target cells of t1/2 = 5.53 min (95% CI: (3.54–7.52)) in the acutely and t1/2 = 26.38 min (22.43–30.32) in the persistently infected animals. The estimated killing rate constant k for the NP396-pulsed target cells in the acutely infected mice (k = 27.24 min−1) is around two times higher than that estimated for GP33 and around three times higher than the killing rate constant estimated for NP396 in the persistently infected animals (k = 8.61 min−1) (table 1). The corresponding 95% CI of k do not intersect, indicating a significant difference in the killing rate constants for this epitope. The corresponding half-lives of NP396-pulsed target cells in acutely and persistently infected mice differ more than 10-fold (acute: t1/2 = 36.03 min (5.84–66.21), persistent: t1/2 = 425.7 min (300.6–550.7)).
Table 1.
Estimated killing rate constants and half-lives for the basic, saturation and epitope decay/CTL-occupation model. (Numbers in brackets represent the 95% CI, which were calculated using the percentile method with 1000 bootstrap replicates.)
| basic |
saturation |
decay/occupation |
|||||
|---|---|---|---|---|---|---|---|
| epitope | k(min−1) | t1/2(min) | kmax(min−1) | C1/2 | k0(min−1) | ν(min−1) | |
| acute | GP33 | 11.845 (5.925,17.798) | 5.53 (3.54,7.52) | 0.111 (0.072,0.498) | 0.0 (0.0,0.046) | 18.196 (10.574,28.88) | 0.024 (0.013,0.042) |
| NP396 | 27.236 (16.919,43.667) | 36.03 (5.84,66.21) | 0.020 (0.016,0.995) | 0.0 (0.0,0.045) | 35.0 (25.5,67.879) | 0.01 (0.01,0.031) | |
| persistent | GP33 | 5.112 (4.173,6.412) | 26.38 (22.43,30.32) | 0.036 (0.022,0.1) | 0.002 (0.0,0.017) | 8.445 (6.937,11.811) | 0.012 (0.007,0.022) |
| NP396 | 8.61 (6.974,12.728) | 425.7 (300.6,550.7) | 0.192 (0.136,0.218) | 0.022 (0.015,0.03) | 18.48 (13.992,21.017) | 0.012 (0.007,0.015) | |
The best fits of our model to the observed proportion of cells killed are shown for each mouse separately in figure 5. The aberrant fit of the model in the NP396 epitope for the acutely infected mice is owing to the extremely high effector–target cell ratio of one mouse compared with the other two mice for this epitope (electronic supplementary material).
Figure 5.

Individual observations of the proportion of target cells killed: the proportion of target cells killed, p(t) , for each acutely (a–c) or persistently (d–f) infected mouse separated by the epitopes GP33 (black) and NP396 (grey). Predicted curves are plotted using either the basic (solid) or the CTL occupation/epitope decay model (dashed line).
By sampling from the blood, we are able to follow the target cell dynamics in one animal over time. Using these longitudinal data, we also fitted the model separately to each animal. Taking the average over the individually estimated killing rate constants leads to estimates for k that do not differ from those shown in table 1.
We additionally considered two alternative formulations of the killing term and analysed whether this would change our qualitative results.
(i). Saturation in the killing term
It has been established that a killing term which saturates in the CTL frequency C is more appropriate than a mass-action-dependent killing term to describe killing in a spatially confined compartment [21–23], especially at low effector to target ratios. Although the effector–target cell ratios in our experiments do not require describing killing by a saturating term, especially for the NP396 epitope, we include this possibility into our model by replacing kC in equation (2.1) with kmaxC/(C + C1/2). Here, C1/2 corresponds to the CTL frequency where the killing rate is half of the maximum kmax. This model extension changes the qualitative relationship of kmax between the two epitopes in the acutely infected animals but does not improve the fit to the data significantly (F-test, p > 0.05, table 2). For neither of the epitopes, a significant difference between the killing rates kmax nor the saturation constant C1/2 of acutely and persistently infected animals could be found (table 1).
Table 2.
p-values of an F-test comparing the different extensions to the basic model with a mass-action assumption in the killing term; p-values < 0.05 are considered as statistically significant.
| acute |
persistent |
|||
|---|---|---|---|---|
| model | GP33 | NP396 | GP33 | NP396 |
| (a) saturation | 0.0712 | 0.119 | 0.286 | 1 |
| (b) dec./occ. | 0.072 | 0.062 | 0.002 | 0.0006 |
(ii). Cytotoxic T lymphocyte occupation and epitope decay
The proportion of NP396-pulsed target cells killed saturates at a value below 1. Several explanations were proposed for this observation [18], including epitope decay and CTL occupation. The first explanation posits that the epitopes loaded to the target cells are progressively lost and therefore the killing rate k0 decreases exponentially with rate ν, 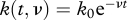 . The second explanation proposes that the frequency of effective CTLs in the spleen decreases exponentially over time,
 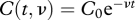 , either because CTLs are occupied while killing other target cells or because they transiently lose their cytotoxic capacity after having killed a cell. As both model extensions assume an exponential loss rate either in the killing rate constant k or in the CTL frequency C, they both lead to the same time-dependent function describing CTL-mediated killing,
 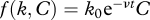 , in equation (2.1). We fitted this model to the data to estimate the parameters k0 and ν. Results are given in table 1 and the corresponding fitted curves for each mouse are shown in figure 5 (dashed line).
This model extension improves the fit to the data compared with the basic model (see table 2, significant in persistently infected animals, F-test, GP33: p = 0.002, NP396: p = 0.0006). Similar to the results of the basic model, we observe an approximately twofold difference in the killing rate k0 for the GP33 epitope between acutely and persistently infected animals (acute: k0 = 18.2 min−1, persistent: k0 = 8.45 min−1). This difference is again not significant (table 1). There is also no significant difference in the corresponding exhaustion rate or epitope decay rate ν in this epitope between the two types of infection. The estimates for the killing rate constant k0 in the NP396 epitope are higher than those estimated for GP33 (acute: k0 = 35.0 min−1, persistent: k0 = 18.48 min−1). We calculate an approximately twofold difference between acutely and persistently infected animals, similar to GP33, which is statistically significant. In general, the values of k0 and k are in the similar ranges.
3. Discussion
Persistent infections, such as HIV and HCV, are a major threat to public health [24]. There are various strategies by which a viral pathogen maintains persistence inside a host: some viruses establish latency associated with low and sporadic levels of viral antigen (e.g. EBV, cytomegalovirus), while others infect immunoprivileged sites (e.g. Herpes Simplex virus). Other viruses, such as HIV and HCV, are characterized by a high replicative capacity, which enables them to partly escape the immune response. CD8+ T-cell dysfunctionality, i.e. reduced cytokine production, is commonly observed among various highly replicating virus infections, and could be a cause for viral persistence. However, at least in some viral infections the cytotoxic activity of CD8+ T cells is considered of higher importance for the reduction of viral titres [25]. A comparison of the cytotoxic activity in acute and persistent infections is needed to determine whether impaired cytotoxicity of CD8+ T cells is responsible for viral persistence.
In this study, we compared the cytotoxic efficacy of CTLs in acute and persistent infections of mice with LCMV, a highly replicative virus. To this end, we performed an in vivo CTL killing assay using the LCMV Docile strain. In contrast to previous experimental designs [14–16], we sampled target cells from the blood at different time points, rather than sampling once from the spleen. Thus, we obtain longitudinal data of the target cell dynamics for each animal. Immediately after transfer, the ratio of target to control cells declines. This allowed us to use these data to quantify CTL efficacy. We assume that the probability of a cell to be susceptible to CTL-mediated killing changes over time as cells stay in circulation or migrate to different organs.
To investigate the dynamics of cell migration between different organs, we conducted experiments in naive mice. In these experiments, the number of target cells was tracked through time in the blood, the spleen, the lungs and the liver. These experiments revealed that the kinetics of transferred cells in the lung and liver follows the same dynamics as in the blood (figure 4). This indicates that target cells are, if at all, only poorly able to home to these organs. By contrast, transferred cells are able to invade splenic tissue, which we therefore assume to be the main compartment in which blood is surveyed for foreign antigen by CTLs. We developed mathematical models that determine the probability of a transferred cell to be susceptible to CTL-mediated killing rather than using two-compartment extensions of the deterministic models used previously [17,18] because fitting an explicit deterministic two-compartment model would require more information on the migration dynamics of cells transferred than we can extract from the migration experiments. Our function μ(t) is a simplified description of the net flux of target cells between the blood and the spleen. The mathematical models we present represent a compromise between a homogeneous model, in which each mouse is considered as one well-mixed compartment, and a two-compartment model that is able to reflect the migration dynamics of transferred cells in detail (see also the electronic supplementary material for a model comparison and discussion of the model assumption). Assuming that killing occurs in a compartment separate from the blood, our model fits the experimental data significantly better compared with a homogeneous model (F-test, acutely infected mice p-values < 0.04).
In our models, we estimate a killing rate constant k—a measure of CTL efficacy that corrects for differences in CTL levels. Our analysis yields a twofold difference in k between acutely and persistently infected animals for the GP33-pulsed target cells. This corresponds to a four- to fivefold higher half-life of GP33-pulsed cells in persistent infection (acute: t1/2 = 5.5 min; persistent: t1/2 = 26.4 min). These half-lives calculated in the acutely infected group are in line with those estimated previously [18,26]. For the NP396 epitope, we estimate a two- to threefold difference in the killing rate constants k between acutely and persistently infected animals. While the estimated difference in k between acutely and persistently infected mice was not found to be statistically significant for GP33, the difference in NP396 is statistically significant as judged from the 95% CI of the estimates. From this analysis, we conclude that the killing efficacy of an individual CTL against the GP33 epitope does not differ between acutely and persistently infected mice. By contrast, CTLs specific for the NP396 epitope seem to be slightly less efficacious in persistent infection than in acute infection. However, the killing rates in persistent infection are probably underestimated in our in vivo killing assay: unlike in acute LCMV infection, in which the pathogen is cleared days before the target cells are injected, in persistent infections pathogen is still present. Thus, in persistent infections, some CTLs may kill virus-infected cells rather than pulsed target cells. The killing efficacy derived from the in vivo killing data in persistent infection is therefore only a lower bound for the actual CTL efficacy. Additionally, secondary lymphoid organs, such as the spleen or lymph nodes, are observed to be functionally impaired during persistent LCMV infections. Owing to disruption of the supporting scaffold of fibroblastic reticular cells, lymphocyte migration and homing is disturbed [27]. For these two reasons, the difference between the killing efficacy of CTLs in acute and persistent infections may be even smaller than what we estimate.
We analysed several model variations and extensions to validate the robustness of our results. In addition to the basic model, in which we assume a constant rate of killing, kC, we considered model extensions, in which the killing term saturates in the CTL frequency C [23] or in which kC decreases exponentially [18]. We found no statistical evidence for the use of a saturating killing term in any of the epitopes analysed based on an F-test (table 2). This is owing to the rather low effector–target cell ratio in our experiment (electronic supplementary material, figure S2). The second model extension corroborated our results for k determined with the basic model (table 2). Additionally, various other definitions for the net flux rate μ(t) than the one we used did also not change our results (electronic supplementary material).
Based on our results, we conclude that the individual cytotoxic efficacy of CD8+ T cells in persistent LCMV infection is not severely impaired. Similar conclusions were drawn recently comparing the efficacy of CTLs in polyoma and LCM virus infections of mice [28], and it has also been shown for late stages in the persistent infection that CTLs keep their cytotoxic ability [11]. We compared the CTL killing efficacy in acute and persistent infections early in persistent infection (15 days post infection), when an impaired cytokine production by CD8+ T cells can already be observed [11]. Our study suggests that the persistence of LCMV Docile infection is not owing to a reduced cytotoxic capacity of LCMV-specific CD8+ T cells. Because the strength of the cytotoxic CD8+ T-cell response is modulated by the number of specific CD8+ T cells, an understanding of persistence will have to elucidate the mechanisms involved in regulating the population sizes during persistent infection rather than the molecular biology of the cytotoxicity on an individual cell level. The ultimate explanation for the downregulation of the specific immune response is probably the avoidance of immunopathology during chronic viral infections. Downmodulation of ‘systemic’ immune responses, such as the release of the cytokines IL-2, IFN-γ and TNF-α [11,12,29], and the decay of total cell numbers lead to decreased immunopathology. Therapeutic strategies, which increase the number of virus-specific T cells to enhance immune control of virus replication, have to carefully weight in the potential damage of such a strategy: if the number of antiviral T cells is elevated, e.g. by transfer of virus-specific transgenic T cells, mice develop increased immunopathology (K. Richter & A. Oxenius 2010, unpublished observations).
In our study, the estimates of the killing rate constant k, especially for the NP396 epitope, are around 2–10 times higher than those obtained previously, which estimated k ≈ 1 − 3 min−1 [17,18]. On the one hand, this could reflect a real difference in the killing ability of the cells in the two experiments. In this case, CTLs find and kill target cells even faster than previously appreciated. Indeed, by ignoring the efflux of target cells from the spleen, previous analyses [17,18] underestimate the true killing rate constant k as the time the target cells are exposed to CTL killing in the spleen is shorter in reality than those models assumed. By taking efflux of target cells from the spleen into account, the mathematical model presented here corrects for this bias (see also [26]). Alternatively, the difference between our and previously estimated killing rate constants may be owing to the difference in the compartments sampled. While, in the experiment by Barber et al. [15], cells were measured in the spleen of mice, we sampled the blood to determine cell levels in our experiment. The frequency of target cells observed in the blood may not be related to the killing dynamics in the spleen in the way we assumed in our mathematical analysis, namely through the direct in- and outflow of cells. Further compartments besides the spleen might contribute to CTL-mediated killing. In areas where T cells and target cells can interact with each other, which is most likely in smaller blood vessels, CTLs might be able to kill target cells. If the target cells have to cross a compartment in which killing occurs on their way from the spleen to the blood, our method will overestimate the killing efficacy of CTLs. By an analogous argument, previous killing rate constants [17,18] may have been overestimated if target cells are killed in a compartment that they have to traverse on their way from the blood to the spleen, for example the lungs.
Further studies combining cell migration and CTL killing are required to address the discrepancies in killing rate constants and the uncertainties in interpreting in vivo killing assay data.
Acknowledgements
This study was carried out in strict accordance to the guidelines of the animal experimentation law (SR 455.163; TVV) of the Swiss Federal Government. The protocol was approved by Cantonal Veterinary office of the canton of Zurich, Switzerland (permit no. 146/2008). All efforts were made to minimize suffering.
We thank Rustom Antia and Andrew Yates for helpful discussions. F.G. and R.R.R. gratefully acknowledge the financial support of the Swiss National Science Foundation (SNF-grant 315200-114148).
References
- 1.Lieberman J., Shankar P., Manjunath N., Andersson J. 2001. Dressed to kill? A review of why antiviral CD8 T lymphocytes fail to prevent progressive immunodeficiency in HIV-1 infection. Blood 98, 1667–1677 10.1182/blood.V98.6.1667 (doi:10.1182/blood.V98.6.1667) [DOI] [PubMed] [Google Scholar]
- 2.Betts M. R., et al. 2006. HIV nonprogressors preferentially maintain highly functional HIV-specific CD8+ T cells. Blood 107, 4781–4789 10.1182/blood-2005-12-4818 (doi:10.1182/blood-2005-12-4818) [DOI] [PMC free article] [PubMed] [Google Scholar]
- 3.Shin H., Wherry E. J. 2007. CD8 T cell dysfunction during chronic viral infection. Curr. Opin. Immunol. 19, 408–415 10.1016/j.coi.2007.06.004 (doi:10.1016/j.coi.2007.06.004) [DOI] [PubMed] [Google Scholar]
- 4.Lechner F., et al. 2000. Analysis of successful immune responses in persons infected with hepatitis C virus. J. Exp. Med. 191, 1499–1512 10.1084/jem.191.9.1499 (doi:10.1084/jem.191.9.1499) [DOI] [PMC free article] [PubMed] [Google Scholar]
- 5.Gruener N. H., et al. 2001. Sustained dysfunction of antiviral CD8+ T lymphocytes after infection with hepatitis C virus. J. Virol. 75, 5550–5558 10.1128/JVI.75.12.5550-5558.2001 (doi:10.1128/JVI.75.12.5550-5558.2001) [DOI] [PMC free article] [PubMed] [Google Scholar]
- 6.Urbani S., Boni C., Missale G., Elia G., Cavallo C., Massari M., Raimondo G., Ferrari C. 2002. Virus-specific CD8+ lymphocytes share the same effector-memory phenotype but exhibit functional differences in acute hepatitis B and C. J. Virol. 76, 12 423–12 434 10.1128/JVI.76.24.12423-12434.2002 (doi:10.1128/JVI.76.24.12423-12434.2002) [DOI] [PMC free article] [PubMed] [Google Scholar]
- 7.Hislop A. D., Gudgeon N. H., Callan M. F., Fazou C., Hasegawa H., Salmon M., Rickinson A. B. 2001. EBV-specific CD8+ T cell memory: relationships between epitope specificity, cell phenotype, and immediate effector function. J. Immunol. 167, 2019–2029 [DOI] [PubMed] [Google Scholar]
- 8.Van Baarle D., Kostense S., Van Oers M. H., Hamann D., Miedema F. 2002. Failing immune control as a result of impaired CD8+ T-cell maturation: CD27 might provide a clue. Trends Immunol. 23, 586–591 10.1016/S1471-4906(02)02326-8 (doi:10.1016/S1471-4906(02)02326-8) [DOI] [PubMed] [Google Scholar]
- 9.Vogel T. U., Allen T. M., Altman J. D., Watkins D. I. 2001. Functional impairment of simian immunodeficiency virus-specific CD8+ T cells during the chronic phase of infection. J. Virol. 75, 2458–2461 10.1128/JVI.75.5.2458-2461.2001 (doi:10.1128/JVI.75.5.2458-2461.2001) [DOI] [PMC free article] [PubMed] [Google Scholar]
- 10.Zajac A. J., Blattman J. N., Murali-Krishna K., Sourdive D. J. D., Suresh M., Altman J. D., Ahmed R. 1998. Viral immune evasion due to persistence of activated T cells without effector function. J. Exp. Med. 188, 2205–2213 10.1084/jem.188.12.2205 (doi:10.1084/jem.188.12.2205) [DOI] [PMC free article] [PubMed] [Google Scholar]
- 11.Agnellini P., Wolint P., Rehr M., Cahenzli J., Karrer U., Oxenius A. 2007. Impaired NFAT nuclear translocation results in split exhaustion of virus-specific CD8+ T cell functions during chronic viral infection. Proc. Natl Acad. Sci. USA 104, 4565–4570 10.1073/pnas.0610335104 (doi:10.1073/pnas.0610335104) [DOI] [PMC free article] [PubMed] [Google Scholar]
- 12.Wherry E. J., Blattman J. N., Murali-Krishna K., Van der Most R., Ahmed R. 2003. Viral persistence alters CD8 T-cell immunodominance and tissue distribution and results in distinct stages of functional impairment. J. Virol. 77, 4911–4927 10.1128/JVI.77.8.4911-4927.2003 (doi:10.1128/JVI.77.8.4911-4927.2003) [DOI] [PMC free article] [PubMed] [Google Scholar]
- 13.Zhou S., Ou R., Huang L., Price G. E., Moskophidis D. 2004. Differential tissue-specific regulation of antiviral CD8+ T-cell immune responses during chronic viral infection. J. Virol. 78, 3578–3600 10.1128/JVI.78.7.3578-3600.2004 (doi:10.1128/JVI.78.7.3578-3600.2004) [DOI] [PMC free article] [PubMed] [Google Scholar]
- 14.Barchet W., et al. 2000. Direct quantitation of rapid elimination of viral antigen-positive lymphocytes by antiviral CD8 T cells in vivo. Eur. J. Immunol. 30, 1356–1363 10.1002/(SICI)1521-4141(200005)30:5%3C;1356::AID-IMMU1356%3E;3.0.CO;2-K (doi:10.1002/(SICI)1521-4141(200005)30:5<1356::AID-IMMU1356>3.0.CO;2-K) [DOI] [PubMed] [Google Scholar]
- 15.Barber D. L., Wherry E. J., Ahmed R. 2003. Cutting edge: rapid in vivo killing by memory CD8 T cells. J. Immunol. 171, 27–31 [DOI] [PubMed] [Google Scholar]
- 16.Fuller M. J., Khanolkar A., Tebo A. E., Zajac A. J. 2004. Maintenance, loss, and resurgence of T cell responses during acute, protracted, and chronic viral infections. J. Immunol. 172, 4204–4214 [DOI] [PubMed] [Google Scholar]
- 17.Regoes R. R., Barber D. L., Ahmed R., Antia R. 2007. Estimation of the rate of killing by cytotoxic T lymphocytes in vivo. Proc. Natl Acad. Sci. USA 104, 1599–1603 10.1073/pnas.0508830104 (doi:10.1073/pnas.0508830104) [DOI] [PMC free article] [PubMed] [Google Scholar]
- 18.Yates A., Graw F., Barber D. L., Ahmed R., Regoes R. R., Antia R. 2007. Revisiting estimates of CTL killing rates in vivo. PLoS ONE 2, e1301. 10.1371/journal.pone.0001301 (doi:10.1371/journal.pone.0001301) [DOI] [PMC free article] [PubMed] [Google Scholar]
- 19.Ou R., Zhou S., Huang L., Moskophidis D. 2001. Critical role for alpha/beta and gamma interferons in persistence of lymphocytic choriomeningitis virus by clonal exhaustion of cytotoxic T cells. J. Virol. 75, 8407–8423 10.1128/JVI.75.18.8407-8423.2001 (doi:10.1128/JVI.75.18.8407-8423.2001) [DOI] [PMC free article] [PubMed] [Google Scholar]
- 20.Zhou S., Ou R., Huang L., Moskophidis D. 2002. Critical role for perforin-, Fas/FasL-, and TNFR1-mediated cytotoxic pathways in down-regulation of antigen-specific T cells during persistent viral infection. J. Virol. 76, 829–840 10.1128/JVI.76.2.829-840.2002 (doi:10.1128/JVI.76.2.829-840.2002) [DOI] [PMC free article] [PubMed] [Google Scholar]
- 21.Merrill S. J. 1982. Foundations of the use of an enzyme kinetic analogy in cell-mediated cytotoxicity. Math. Biosci. 62, 219–235 10.1016/0025-5564(82)90084-0 (doi:10.1016/0025-5564(82)90084-0) [DOI] [Google Scholar]
- 22.Pilyugin S. S., Antia R. 2000. Modeling immune responses with handling time. Bull. Math. Biol. 62, 869–890 10.1006/bulm.2000.0181 (doi:10.1006/bulm.2000.0181) [DOI] [PubMed] [Google Scholar]
- 23.Graw F., Regoes R. R. 2009. Investigating CTL mediated killing with a 3D cellular automaton. PLoS Comput. Biol. 5, e1000466. 10.1371/journal.pcbi.1000466 (doi:10.1371/journal.pcbi.1000466) [DOI] [PMC free article] [PubMed] [Google Scholar]
- 24.Morens D. M., Folkers G. K., Fauci A. S. 2004. The challenge of emerging and re-emerging infectious diseases. Nature 430, 242–249 10.1038/nature02759 (doi:10.1038/nature02759) [DOI] [PMC free article] [PubMed] [Google Scholar]
- 25.Harty J. T., Tvinnereim A. R., White D. W. 2000. CD8+ T cell effector mechanisms in resistance to infection. Annu. Rev. Immunol. 18, 275–308 10.1146/annurev.immunol.18.1.275 (doi:10.1146/annurev.immunol.18.1.275) [DOI] [PubMed] [Google Scholar]
- 26.Ganusov V. V., De Boer R. J. 2008. Estimating in vivo death rates of targets due to CD8 T-cell-mediated killing. J. Virol. 82, 11 749–11 757 10.1128/JVI.01128-08 (doi:10.1128/JVI.01128-08) [DOI] [PMC free article] [PubMed] [Google Scholar]
- 27.Mueller S. N., et al. 2007. Viral targeting of fibroblastic reticular cells contributes to immunosuppression and persistence during chronic infection. Proc. Natl Acad. Sci. USA 104, 15 430–15 435 10.1073/pnas.0702579104 (doi:10.1073/pnas.0702579104) [DOI] [PMC free article] [PubMed] [Google Scholar]
- 28.Ganusov V. V., Lukacher A. E., Byers A. M. 2010. Persistence of viral infection despite similar killing efficacy of antiviral CD8+ T cells during acute and chronic phases of infection. Virology 405, 193–200 10.1016/j.virol.2010.05.029 (doi:10.1016/j.virol.2010.05.029) [DOI] [PMC free article] [PubMed] [Google Scholar]
- 29.Wherry E. J., Ahmed R. 2004. Memory CD8 T-cell differentiation during viral infection. J. Virol. 78, 5535–5545 10.1128/JVI.78.11.5535-5545.2004 (doi:10.1128/JVI.78.11.5535-5545.2004) [DOI] [PMC free article] [PubMed] [Google Scholar]