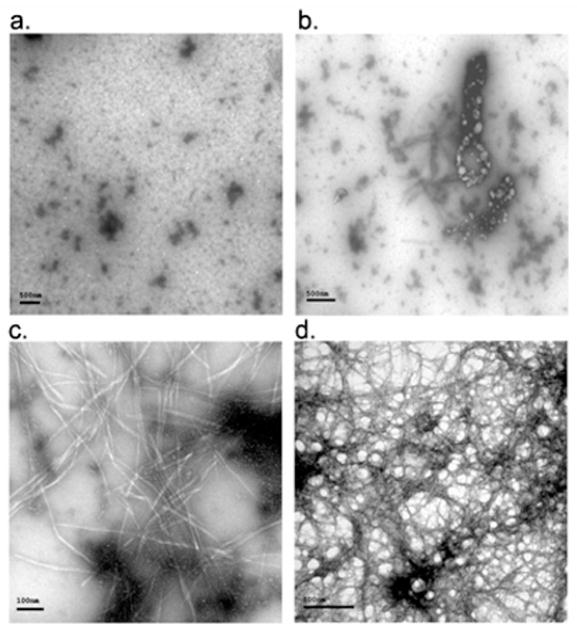
Figure 2.
TEM images from hAM aggregation assays in the presence Trp-bearing hairpin peptides. Panel a, b, c are representative panels from hAM plus 2 molar equivalents of WW2 at 2h (a), 5h (b) and 20 h (c). The scale bar for a, b and d represent 500nm; the scale bar for panel c = 100nm. Panel c was the grid displaying the greatest density of fibrils. Panel d was recorded after 40 min in the presence of 2 molar equivalents of μPro1; a denser fibrillar network is observed at an early time point.

