

Abstract
Background
There is growing interest in the influence of early-life development on clinical manifestations of late-life diseases.
Methods
Latent variable modeling was used to investigate how maximal brain volume (measured by intracranial volume (ICV)) and current brain volumes uniquely contribute to domain-specific cognitive performance in a group of 401 cognitively and ethnically diverse older adults. Individual effects of volumetric MRI measures including ICV were examined as predictors of episodic memory, semantic memory, spatial ability and executive function.
Results
Current brain volume related to all cognitive domains; hippocampal volume was associated primarily with episodic memory; white matter hyperintensity volume was related to executive function and episodic memory. Maximal brain size as measured by ICV was related to semantic memory, executive function, and spatial ability independent of current brain volumes (ps <.01). Relationships between MRI variables and cognition did not differ substantially across groups defined by ethnicity, gender, and with minor exceptions clinical diagnosis.
Conclusions
Results suggest maximal brain development and measures of brain injury/atrophy jointly contribute to cognitive function in older people.
Keywords: cognition, cognitive impairment, MRI, cognitive reserve
Introduction
Cognitive trajectories become increasingly heterogeneous with age (Wilson et al., 2002). A better understanding of the factors that are associated with retention of cognitive function in the context of brain aging is of great importance, particularly given that some factors are likely to be modifiable. Along these lines, there is growing interest in a life-course approach to late-life cognitive decline and disease (Whalley, 2006), the idea being that exposures throughout life may influence the development or clinical manifestations of disease in late-life.
The measurement of brain size is of interest from two perspectives when seeking to understand the heterogeneity of cognitive aging. Neurodegenerative diseases of aging result in loss of brain volume and, not surprisingly there is a substantial literature that demonstrates a correlation between structural brain change (or degree of atrophy) and reduced cognitive function in elderly populations. Most notably hippocampal atrophy has been associated with episodic memory deficits (Van Petten, 2004) as well as an increased risk of early Alzheimer’s disease (AD) (Jack et al., 2000). Other studies have shown that more widespread atrophy patterns including reduced global brain volume (Sluimer et al., 2008; Wolf et al., 2004), total gray matter volume (D. Mungas et al., 2005; Saykin et al., 2006), and total volume of white matter hyperintensities (WMH; (Yoshita et al., 2006)) are associated with a variety of worse cognitive outcomes. In these studies, brain volume, or its converse, brain atrophy, is generally viewed as indirect measures of pathological processes.
However, there is also a long, sometimes ignominious, history of investigating brain size as an indicator of cognitive ability. Recently it has been investigated as a measure of cognitive reserve. In this context there is evidence that maximal brain size, estimated by either head circumference or MRI-based intracranial volume (ICV), also exerts an influence on cognitive function in old age. While measures of brain atrophy (as indicated by current paranchemal volumes) incorporate the effects of disease on the brain, maximal brain size reflects early brain development. Because a) the size of the cranial vault is fixed by about the age of 7 and skull morphometry remains stable throughout the life span, and b) the size of the brain and the size of the cranial vault are closely linked early in life (Mori et al., 1997; Sgouros et al., 1999), ICV is an indicator of maximal brain volume. Intracranial capacity is thought to be influenced by both intrauterine and early life environmental factors including nutrition (Jeong et al., 2005), as well as genetic factors (Rushton, 2009).
Previous studies have suggested that smaller maximal brain size may increase vulnerability to the effects of later neurodegeneration. For example, smaller maximal brain size has been associated with increased prevalence (Kim et al., 2008; Mortimer et al., 2003; Scazufca et al., 2008; Schofield et al., 1997; Wolf et al., 2004; Wolf et al., 2003) and incidence of dementia (Borenstein Graves et al., 2001), and earlier age of dementia onset (Borenstein Graves et al., 2001; Schofield et al., 1995). Brain size has also been shown to correlate with continuous global measures of cognition (Graves et al., 1996; Kim et al., 2008; Reynolds et al., 1999; Tisserand et al., 2001; Wolf et al., 2003). Despite these positive findings, not all studies have found an association between maximal brain/head size and prevalent/incident dementia (Edland et al., 2002; Espinosa et al., 2006; Jenkins et al., 2000) or rate of cognitive change (Christensen et al., 2009). One study that did not find an association between ICV and cognitive function in old age adjusted for mental ability in childhood (Staff et al., 2004) suggesting that there may be substantial shared variance between maximal brain size and early mental abilities. However, measures of childhood mental abilities are rarely available and ICV is relatively easy to obtain.
The purpose of the present study was to better understand how these two brain measures – maximal brain size (as measured by ICV), and current brain volumes (i.e. total brain volume, hippocampal volume, and volume of white matter hyperintensities) – independently influence specific domains of cognitive function (i.e. psychometrically matched measures of episodic memory, semantic memory, spatial ability, and executive function). Few previous studies have examined the association between ICV and specific cognitive domains. Such an approach is likely important because factors related to early brain development may not exert the same effect on all areas of cognition and the relative contribution of maximal brain size and current measures of brain pathology may differ by cognitive domain. Additionally, few studies have simultaneously examined maximal brain size and brain atrophy patterns in association with cognition, leaving the relative importance of each variable unknown. Finally, existing studies examining the independent contributions of both intracranial capacity and brain atrophy across multiple cognitive domains (MacLullich et al., 2002; Shenkin et al., 2009) have examined this association only in cognitively normal older adults, limiting generalizability to the broader spectrum of cognitive function in aging.
Our study differs from previous research not only by representing a wide range of cognitive ability (including cognitively normal elderly and those with mild cognitive impairment (MCI) and dementia), but also represents diversity in race/ethnicity, education, socioeconomic status, and other background variables and life experiences that may be important in contributing to variance in maximal brain size and in disease-related changes in brain structure. We hypothesized that cognitive function across a variety of specific domains would be significantly dependent on both maximal brain size and current brain volumes – the former reflecting early developmental factors and the latter reflecting disease-associated loss of brain tissue. The unusual diversity of our sample further allowed us to evaluate the consistency of observed relationships across major subgroups defined by ethnicity, gender, and clinical diagnosis. Thus, we were able to examine the independent contributions of multiple brain measures to late life cognitive function and to test generalizability of these relationships across a broad spectrum of older individuals.
2. Methods
2.1. Participants
This study included 401 participants in an ongoing longitudinal study of cognitive impairment in an educationally and ethnically diverse sample of older adults. These individuals were evaluated and followed within the research program of the University of California at Davis Alzheimer’s Disease Center (UCD ADC). Participants were recruited into the study through two routes: 1) memory clinic referrals and 2) community outreach. Approximately 79% of participants were recruited through community based recruitment protocols designed to enhance racial and ethnic diversity and to widen the spectrum of cognitive dysfunction of the sample with an emphasis on normal cognition and MCI. Recruiters utilized various outreach methods such as soliciting in a community hospital lobby, a community survey, health fairs or word of mouth. The other 21% of the sample initially sought a clinical evaluation at the UCD ADC and subsequently was recruited for this study. The overall sample included 128 African Americans, 113 Hispanics, and 160 Caucasians. Community recruits were relatively equally distributed across ethnic groups (38% African Americans, 33% Hispanics, 29% Caucasians) but clinic recruits were predominantly Caucasian (79% Caucasian, 12% Hispanic, 9% African American).
Regardless of recruitment source, inclusion criteria were age greater than 60, and ability to speak English or Spanish. Exclusion criteria included unstable major medical illness, major primary psychiatric disorder (history of schizophrenia, bipolar disorder, or recurrent major depression), and substance abuse or dependence in the last five years. The sample was also diverse in terms of cognitive function; 52% of the sample was cognitively normal, 33% had MCI, and 15% were diagnosed with a dementia syndrome (predominantly AD). Syndromic and etiologic diagnoses were made based on a multidisciplinary diagnostic evaluations, which included physical and neurological exam, clinical neuropsychological testing, imaging, and lab work. Diagnoses were made blind to the neuropsychological tests used as outcome measures in this study. Dementia was diagnosed using DSM-III R (American Psychiatric Association, 1987) criteria for dementia modified such that dementia could be diagnosed in the absence of memory impairment if there was significant impairment of two or more other cognitive domains. MCI was diagnosed according to standard clinical criteria and was further subtyped according to current Alzheimer’s Disease Centers Uniform Data Set guidelines (Morris et al., 2006). All participants signed informed consent, and all human subject involvement was overseen by institutional review boards at University of California at Davis, the Veterans Administration Northern California Health Care System and San Joaquin General Hospital in Stockton, California.
2.2 Cognitive Measures
The primary cognitive outcome measures in this study were from the Spanish and English Neuropsychological Assessment Scales (SENAS). The SENAS has undergone extensive development as a battery of cognitive tests relevant to diseases of aging (Mungas et al., 2004; D Mungas et al., 2005; Mungas et al., 2000). Modern psychometric methods based on item response theory were used to create psychometrically matched measures across different scales and across English and Spanish versions. This study used a subset of SENAS tests to measure four cognitive domains: episodic memory, semantic memory, visuospatial abilities, and executive function. The Episodic Memory Index was a composite score derived from a multi-trial word list learning test (Word List Learning I). The Semantic Memory Index was a composite of highly correlated verbal (Object Naming) and nonverbal (Picture Association) tasks. The Spatial Ability Index was a composite that included two SENAS subtests Spatial Localization and Pattern Recognition. Finally, the Executive Function Index was a composite measure constructed from component tasks of Category Fluency, Phonemic (letter) Fluency, and Working Memory. Measure development and psychometric characteristics have been reported in previous publications (Crane et al., 2009; D Mungas et al., 2005; Muthen & Muthen, 2010). These measures do not have appreciable floor or ceiling effects for participants in this sample and have linear measurement properties across a broad ability range. They are near-normally distributed, which presents advantages for statistical analyses. Psychometrically matched measures of domain specific cognitive functions (i.e. measures with equivalent reliability and sensitivity to individual differences) were used to facilitate unambiguous interpretation of any potential differential effects of the imaging variables on cognitive trajectories. The use of psychometrically matched measures in the current study allows us to draw more confident conclusions about the influence of brain imaging variables on domain-specific cognitive performance.
2.3. Quantitative Structural Imaging
ICV, brain volume (BV), and white matter hyperintensity (WMH) volumes are obtained from FLAIR according to a previously-reported analysis protocol (C. DeCarli et al., 2005; C. E. DeCarli et al., 2005). First, non-brain elements were manually removed from the image by operator guided tracing of the dura mater within the cranial vault including the middle cranial fossa, but excluding the posterior fossa and cerebellum. The volume of the traced region was defined as the ICV. Tissues outside the traced cranial vault were removed from the image, and image segmentation methods then identified the brain matter, followed by WMHs. To identify brain matter, image intensity nonuniformities were removed from the image, and the corrected image was modeled as a mixture of two Gaussian probability functions corresponding to brain tissue and non-brain tissue respectively; the segmentation threshold between brain and non-brain image intensities was located at the minimum probability between these two distributions (DeCarli et al., 1992; DeCarli et al., 1996). Voxels on the non-brain side of the intensity threshold were removed from the image, and the volume of the remaining brain voxels was taken as our braiin volume variable. Morphometric erosion of two exterior image pixels was then applied to the BV image to remove the effects of partial volume CSF pixels on WMH detection. A single Gaussian distribution was then fitted to the intensity distribution of the remaining BV voxels, and all voxels with intensity greater than 3.5 standard deviations above the mean BV intensity were declared WMH (DeCarli et al., 1996).
The hippocampus (HC) was manually traced on T1-weighted scans to include the CA1 – CA4 fields, dentate gyrus, and the subicular complex. First, to guarantee reliability, all scans were resliced perpendicular to the long axis of the left HC. The borders of the HC were then manually traced on contiguous 1.5 mm coronal slices in the anterior to posterior direction. However, while borders were traced on coronal slices, the corresponding sagittal and axial views were presented simultaneously to the operator to verify HC boundaries. The rostral end of the HC was identified using the sagittal view to distinguish between amygdala and HC head. The axial view was used as a separate check. In anterior sections, the superior HC boundary was the amygdala. In sections in which the uncus was ventral to caudal amygdala, the uncus was included in the HC. In more posterior sections that did not contain amygdala, the choroid fissure and the superior portion of the inferior horn of the lateral ventricle formed the superior boundary. The fimbria were excluded from the superior boundary of the hippocampus. The inferior boundary of the hippocampus was the white matter of the parahippocampal gyrus. The lateral boundary was the temporal horn of the lateral ventricle, taking care in posterior sections to exclude the tail of the caudate nucleus. The posterior boundary of the HC was the first slice in which the fornices were completely distinct from any gray/white matter of the thalamus.
A rigorous protocol insured the validity of the MRI measures across differing scanners and analysts. Each analyst was required to produce ratings of training scans that agreed strongly with those of prior analysts as well as a neurologist skilled in neuroanatomy and neuroimaging; intra-class correlation coefficients (ICCs) between new analysts, all previously-trained analysts, and the neurologist were required to be above .95, .95, .95, and .9 for ICV, BV, WMH, and HC. A set of 7 cognitively-normal elderly individuals received one scan on a GE MRI system and another scan on a Philips MRI system within a 60-day interval; within-subject, between-scanner agreement in HC, TCV, and WMH was strong (ICCs = .87, .96, and .89). In addition, 20 subjects received two scans each in a 2-week interval on the GE scanner, and BV and ICV were measured on all scans; within-subject agreement in the measures was strong (ICCs = .97 and .99).
2.4. Data Analysis
A latent variable modeling framework was used to evaluate independent effects of brain components measured by MRI on SENAS measures of cognition. The basic model had two components: 1) a measurement model that established latent variables corresponding to total brain volume adjusted for intracranial volume, hippocampal volume adjusted for intracranial volume, white matter hyperintensity volume (unadjusted), and intracranial volume adjusted for gender and height, and 2) a structural model examining relationships of cognitive test scores with the MRI based latent variables. This model first was evaluated in the combined sample, and subsequently, multiple group analyses were used to directly test generalizability of results across subgroups defined by ethnicity, gender, and clinical diagnosis, variables that substantially contribute to the heterogeneity of this sample. Continuous variables were standardized based on the full sample to facilitate interpretation of results.
Figure 1 shows the general analytic model. The measurement model for MRI variables is presented in the upper half of Figure 1. Observed ICV was freely regressed on gender (Male) and Height to control for differences in head size associated with these variables. Gender was a dichotomous variable coded as 1 for males and 0 for females. Latent icv had a single indicator (ICV) and captured the residual variance in ICV after accounting for effects of Male and Height. The residual variance of ICV was fixed at 0.10 times the sample variance. This residual term formally models measurement error in the observed ICV measure and corresponds to a conservative estimate of reliability of 0.90, based upon empirical reliability estimates presented in the Quantitative Structural Imaging section. In an analogous manner, BM and HC were freely regressed on ICV to control for differences in these variables that would be explained by head size; bm and hc captured residual variance unexplained by ICV, and residual variances of BM and HC were fixed at 0.10 times the sample variances, corresponding to estimated reliability of 0.90. WMH was log transformed to normalize its distribution. WMH was not adjusted for other variables, but measurement error was modeled such that latent wmh corresponded to an error free estimate of this variable, analogous to bm, hc, and icv.
Figure 1. Analytic model.
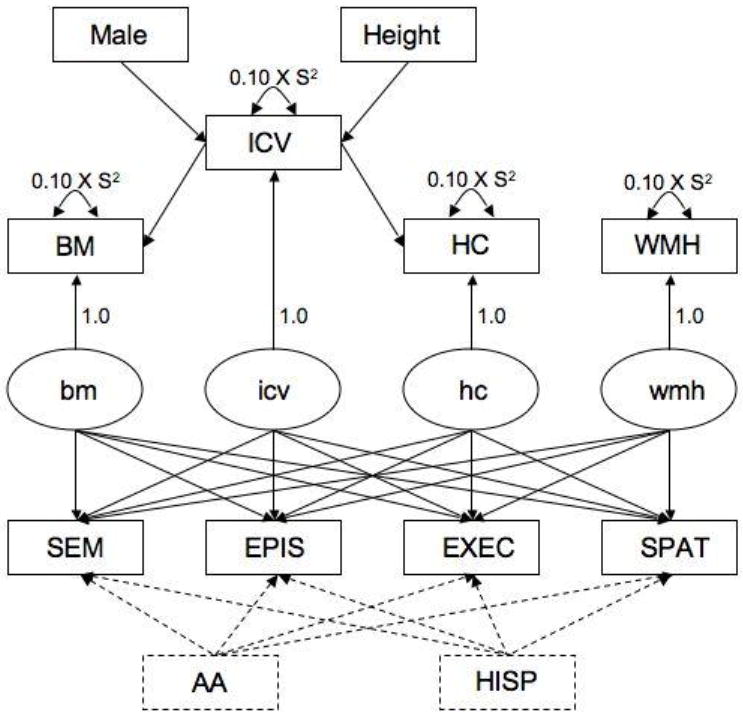
Rectangles refer to observed variables and ovals represent latent variables; observed variables are labeled with capital letters, latent variables with lower case. Latent variables models can be conceptualized as multiple, simultaneously estimated linear regressions; each path depicted by a line corresponds to a regression of the variable at the (arrow) end of the line on the variable at the (non-arrow) beginning of the line. Lines correspond to freely estimated model parameters and the values for fixed model parameters are presented.
The structural model is presented in the lower half of Figure 1. The four cognitive test scores were freely regressed on the four MRI latent variables. Ethnicity was added as a covariate in the primary analysis. AA was a dichotomous variable coded as 1 if African American, 0 otherwise, and HISP similarly was a dichotomous variable coding for Hispanic ethnicity. The Caucasian group in this parameterization is the reference group. Thus, the primary analysis used the four cognitive measures as dependent variables explained by independent variables including intracranial volume adjusted for gender and height, total brain volume adjusted for intracranial volume, hippocampal volume adjusted for intracranial volume, white matter hyperintensity, and the covariate ethnicity. Ethnicity was included as a covariate because a previous study from our group showed that relationships between MRI variables and cognition were stronger after controlling for confounding effects of ethnicity (Mungas et al., 2009). Education and age (not shown in Figure 1) were added as covariates along with ethnicity in a secondary analysis.
Several multiple group analyses were then conducted to evaluate whether relationships between cognitive and MRI variables identified in the preceding primary analysis differed across groups defined by ethnicity (African American, Caucasian, Hispanic), gender (male, female), and clinical diagnosis (Normal, Impaired comprised of MCI plus Dementia). A separate series of multiple group analyses were conducted for each of these three grouping variables. Multiple group analyses in a latent variable modeling framework enable formal, hypothesis driven tests of whether various model parameters are invariant across groups. That is, this approach evaluates whether the relationships among the observed indicators and latent variables in the different groups can be explained by a model that has the same parameters in the different groups. The regression coefficients that describe the relationships of the cognitive variables with the MRI variables were of particular interest. The multiple group analysis for ethnicity evaluated whether the solid part of the model in Figure 1 yielded the same cognition-MRI regression coefficients in the three ethnic groups. The analyses for gender and diagnosis included ethnicity as a covariate (dashed lines in Figure 1) and tested the invariance of the regression coefficients across gender or diagnostic groups.
Two models were compared to determine if model fit was better when cognition-MRI regression coefficients were allowed to differ across groups. Model 1 freely estimated regression coefficients in each group; Model 2 constrained regression coefficients to be equal in the different groups. When significant differences between Model 1 and Model 2 were found, follow-up analyses identified the specific cognitive and MRI variable combinations that significantly differed across groups. Parameters defining the MRI latent variables were constrained to be equal across groups in both models with the exception that means and variances of the MRI latent variables were freely estimated in the different groups to account for naturally occurring group differences in distributions of these brain components. Intercepts and residual variances of the cognitive variables also were allowed to differ across groups. Analyses were performed with Mplus version 6.0 (Muthen & Muthen, 2010). Statistical significance of individual parameters was tested by dividing the parameter by its standard error and comparing the result to the standard normal distribution, using p<.05 as the standard for statistical significance. A maximum likelihood estimator was applied to a mean and variance-covariance data structure. Latent variable modeling traditionally uses an overall Chi-square test of model fit, often supplemented by a number of fit indices to better characterize model fit. Commonly used fit indices include the comparative fit index (CFI; (Bentler, 1990), the Tucker-Lewis index (TLI; (Tucker & Lewis, 1973), the root mean square error of approximation (RMSEA; (Browne & Cudeck, 1993), and the standardized root mean squared residual (SRMR; (Bentler, 1995). These indices have been recommended on the basis of simulation studies because they are relatively unaffected by sample size, are sensitive to model mis-specification, and are robust to violation of distributional assumptions (Hu & Bentler, 1998). Fit indices in covariance structure modeling: Sensitivity to underparameterized model misspecification. The Chi-square difference test was used to evaluate differences in model fit associated with multiple group analyses. These were nested models and the difference between the Chi-square values from nested models has a Chi-square distribution with degrees of freedom equal to the difference in degrees of freedom from the two models. Continuous variables (including log white matter hyperintensity) were reasonable normally distributed and met assumptions of multivariate normality underlying maximum likelihood estimation.
3. Results
3.1. Sample Characteristics
Table 1 shows demographic characteristics of the whole sample and specific ethnic subgroups, and in addition, shows breakdown of clinical diagnosis (Normal, MCI, Dementia). Analysis of variance showed that mean education markedly differed across ethnic groups (F[2,398]=74.3, p<0.001). Hispanics had about 8 years of education on average, compared with 13 to 14 years for the other groups. Standard deviations were also larger for Hispanics reflecting broader variability of education in Hispanics. Range of education was zero years to doctoral degrees in Hispanics, three years to doctoral in African Americans, and six years to doctoral in Caucasians. Age differences were also significant but less substantial (F[2,398]=6.7, p=0.001); mean age was 2.6 to 3.1 years lower in Hispanics than the other groups. A chi-square test showed that group differences in gender were marginally significant (χ2[3]=6.7, p=0.04); the percentage of females were somewhat lower in the Caucasians (55%) than in the other groups (66-69%). About one half of the sample was cognitively normal, about one third had a diagnosis of MCI, and 15% were demented. The distribution of diagnoses did not differ across racial/ethnic groups (χ2[4]=6.9, p=0.14). Forty four of 62 cases (71.0%) with dementia at baseline had an etiologic diagnosis of Alzheimer’s disease, five had vascular dementia, seven had mixed Alzheimer’s and vascular disease, one had Lewy body dementia, three had frontotemporal dementia, and the etiology for two was undetermined.
Table 1.
Demographic and clinical characteristics.
| African American (n=128) | Hispanic (n=113) | Caucasian(n=160) | All (n=401) | |
|---|---|---|---|---|
| Gender | ||||
| N (%) Female | 88 (68.8) | 75 (66.4) | 88 (55.0) | 251 (62.6) |
| Education (years) | ||||
| Mean (S.D.) | 13.0 (3.2) | 8.3 (5.6) | 14.3 (3.5) | 12.2 (4.8) |
| Age (years) | ||||
| Mean (S.D.) | 75.5 (6.9) | 72.9 (7.2) | 76.0 (7.3) | 75.0 (7.3) |
| Clinical Diagnosis | ||||
| N (%) Normal | 72 (56.2) | 62 (54.9) | 73 (45.6) | 207 (51.6) |
| N (%) MCI | 43 (33.6) | 31 (27.4) | 58 (36.3) | 132 (32.9) |
| N (%) Dementia | 13 (10.2) | 20 (17.7) | 29 (18.1) | 62 (15.5) |
3.2. Cognitive and MRI Relationships
The model depicted in Figure 1 applied to the full sample yielded good overall model fit (χ2[9]= 10.6, p =0.30; CFI=0.999, TLI=0.995, RMSEA=0.021 (95% confidence interval = 0.000-0.062), SRMR=0.010). ICV was significantly related to Gender (standardized regression coefficient=0.437 (S.E.=0.046), p<0.001), Height (0.239 (0.049), p<.001), BM (0.865 (0.012), p<0.001), and HC (0.392 (0.042), p<0.001).
The primary results of interest from this analysis were relationships among the observed cognitive variables and MRI latent variables defining icv and brain components. Standardized regression coefficients for these effects are presented in Table 2 along with associated standard errors and p values. These results represent effects of the MRI variables on the cognitive variables independent of other MRI variables, ethnicity, gender, and height. The standardized regression coefficients can be interpreted as correlations independent of the other effects in the model, and alternately, these coefficients describe the amount of change in the dependent variable (in standard deviation units) associated with a one standard deviation change in the independent variable.
Table 2.
Associations of cognitive dependent variables with MRI independent variables for the entire sample.
| Cognitive Dependent Variable | Independent Variable | Standardized Coefficient (S.E.) | p |
|---|---|---|---|
| Semantic Memory | icv | 0.204 (0.048) | 0.001 |
| bm | 0.161 (0.065) | 0.013 | |
| hc | 0.127 (0.047) | 0.007 | |
| wmh | -0.040 (0.045) | ns | |
| Episodic Memory | icv | 0.079 (0.054) | ns |
| bm | 0.310 (0.069) | 0.001 | |
| hc | 0.236 (0.051) | 0.001 | |
| wmh | -0.136 (0.049) | 0.006 | |
| Executive Function | icv | 0.272 (0.050) | 0.001 |
| bm | 0.354 (0.067) | 0.001 | |
| hc | 0.030 (0.050) | ns | |
| wmh | -0.160 (0.048) | 0.001 | |
| Spatial Ability | icv | 0.160 (0.053) | 0.002 |
| bm | 0.328 (0.070) | 0.001 | |
| hc | 0.016 (0.052) | ns | |
| wmh | -0.093 (0.050) | ns |
ICV, adjusted for gender and height (icv), was related to Semantic Memory, Executive Function, and Spatial Ability, but not to episodic Memory (see Table 2). The icv effect on Semantic Memory was stronger than the effects of all other brain components. BM adjusted for ICV (bm) was related to all four variables and had the strongest effect for all except Semantic Memory. HC adjusted for ICV (hc) was related to Episodic Memory and was weakly related to Semantic Memory. The wmh component was related to Executive Function and episodic memory, albeit relatively weakly. Results in Table 2 show that the magnitude of independent effects of icv and bm were similar for Semantic Memory and Executive Function, though icv had a slightly stronger effect on Semantic Memory (1.0 s.d. differences in icv and bm were associated with 0.20 and 0.16 s.d. differences in Semantic Memory) and bm had a stronger effect on Executive Function (1.0 s.d. differences in icv and bm were associated with 0.27 and 0.35 s.d. differences in Executive Function).
These results show that icv is an important correlate of cognition, even after controlling for total brain volume, hippocampal volume and white matter hyperintensity burden. Importantly, there was a dissociation of icv effects such that there was no relationship with Episodic Memory in contrast to clear relationships with the other cognitive variables. Relationships of MRI variables with cognition were substantially the same in a model that included education and age as covariates. Model fit was good (χ2[9]= 10.6, p =0.30; CFI=0.999, TLI=0.994, RMSEA=0.021 (90% confidence interval = 0.000-0.062), SRMR=0.011). Education was significantly related to all four cognitive variables with standardized regression coefficients ranging from 0.26 for Episodic Memory to 0.44 for Spatial Ability. Age was independently related only to Spatial Ability (Standardized coefficient = 0.18) independent of other independent variables in the model. The pattern of significant relationships between MRI and cognitive variables and the strength of these relationships did not change from the results of the previous analyses, with the exception that the relationships of bm with cognitive variables tended to be somewhat stronger when age and education were included as covariates (standardized coefficients were: Semantic Memory = 0.19, Episodic Memory = 0.40, Executive Function = 0.45, Spatial Ability = 0.45).
Multiple group analyses evaluated the consistency of results across the three ethnic subgroups, males versus females, and cognitively normal versus impaired (MCI plus Dementia) subgroups. These analyses tested whether regression coefficients significantly differed across the groups defined by these three variables. For ethnicity, the difference in fit between Model 1 (regression coefficients freely estimated) and Model 2 (regression coefficients constrained to be equal across groups) was not statistically significant using the chi-square difference test: (χ2[32]= 23.2, p =0.87). Model fit similarly was not improved by allowing regression coefficients to differ for males and females (χ2[16]= 19.1, p =0.26). Model 1 did show better fit compared to Model 2 when clinical diagnosis was the grouping variable (χ2[16]= 32.8, p =0.008). Follow-up analyses showed that the magnitude of the relationship of Executive Function with icv differed across groups (χ2[1]= 8.0, p =0.004; standardized regression coefficient for Normal =0 .16, p=.01, for Impaired = 0.37, p=.001) as did the relationship of Semantic Memory with bm (χ2[1]= 7.5, p =0.006; standardized regression coefficient for Normal = -0.06, p=.51, for Impaired = 0.20, p=.009). Thus, Executive Function was more strongly related to icv in impaired individuals, but was significantly related in both groups, and Semantic Memory was weakly related to bm in impaired individuals but was not related in normals. Regression coefficients for other cognitive-MRI variable combinations did not significantly differ across groups.
4. Discussion
Structural MRI-based measures of atrophy and markers of cerebrovascular disease have frequently been used to study how cognitive impairment relates to brain changes associated with diseases of aging. In fact, there is an enormous amount of research currently attempting to use MRI volumes as ‘biomarkers’ for degenerative disease, particularly Alzheimer’s disease. In these studies intracranial volume is often treated as a nuisance variable; other brain measures are adjusted for the effect of ICV, but ICV itself has been of limited interest as an explanatory variable to account for cognitive performance. This study adds to the current knowledge by directly examining the independent effects of intracranial volume after accounting for current brain volume and hippocampal size and amount of white matter hyperintensity abnormalities. Findings show that intracranial volume has an important relationship to cognition in older adults. This suggests that cognitive function in old age is partially dependent on maximal brain development, even after controlling for brain structure variables that are sensitive to the presence of current brain pathology (i.e. current total brain and hippocampal size and degree of white matter pathology).
The present study also demonstrates that the relative contribution of maximal brain volume and current brain volumes differ by cognitive domain – an issue that had not previously been well studied. Maximal brain size as estimated by ICV was related to semantic memory, executive functioning, and spatial ability, but not to episodic memory. In fact, ICV had the strongest association with semantic memory than any of the other brain variables. Traditionally, semantic memory, executive functioning, and spatial ability have all been associated with neocortical functioning (i.e. grossly reflecting functions of the temporal, frontal and parietal cortices, respectively). As such, ICV appears to be most closely linked with neocortical functions. The particularly strong relationship between ICV and semantic memory may also be a function of the fact that semantic memory reflects general concept-based knowledge and is itself an indicator, to some degree, of premorbid/baseline cognitive function. As a consequence, early life factors may influence the capacity to acquire knowledge. The present results are generally consistent with other studies (Gale et al., 2003; MacLullich et al., 2002; Mori et al., 1997; Tisserand et al., 2001) that show intracranial volume relates to various measures of global intelligence but not memory. The present study extends previous findings by examining a broader range of neuropsychological domains and by utilizing measures of different cognitive abilities that have comparable psychometric properties, enabling a more accurate comparison of differential relationships across domains.
The findings regarding differential relationships between the other brain measures and cognitive domains are not specific to this study, but support previous research results. Specifically, hippocampal volume was most strongly associated with episodic memory, and more weakly related to semantic memory. WMH was related to executive function and episodic memory. And finally, total current brain volume was related to all four cognitive domains. Very few studies, however, have examined the independent relationship between multiple brain regions and ICV on cognitive function. One previous study failed to find that whole brain volume contributed substantial variance to a general cognitive factor once ICV was included in the model (Shenkin et al., 2009). However, the sample in that study was limited to cognitively normal elderly volunteers, suggesting that it is important to include the full spectrum of cognitive function in studies examining the effects of maximal and current brain volumes on cognitive function. In the present study using the entire sample representing a wider range of cognitive function, current brain volume was independently related to all four cognitive domains even after accounting for the effect of ICV. Because current brain volume have been adjusted for ICV, it can be take as an estimate of brain atrophy
It has been proposed that the sheer number of neurons available to process information may explain the relationship between brain size and cognitive function (Rushton, 2009), with more neurons leading to better cognitive function. Several studies have shown that larger brains do indeed have a higher number of cortical neurons (Haug, 1987; Pakkenberg & Gundersen, 1997). Total brain mass increases rapidly from birth to about age 6 and growth then slows and peaks in the mid to early 20’s, although there are differences in critical developmental periods for gray and white matter. Cortical gray matter volume peaks at around the age of 4 years old, whereas white matter volume increases steadily until in the 20’s (Pfefferbaum et al., 1994). Given that cranial vault growth is complete by about age 7, ICV likely primarily reflects maximal cortical development. The current study shows that maximal cortical development, as measured by ICV, is related to multiple cortically-mediated cognitive domains into old age, even in the face of atrophy. One hypothesis to explain this relationship is that the advantage conferred by having a larger brain prior to the presence of neurodegenerative diseases of aging, may provide neural redundancy that helps the brain to compensate for effects of disease (neural or brain reserve).
Previous work suggests that brain development during infancy and early childhood may play a more important role in late life cognitive function than brain growth during fetal development (Gale et al., 2003). This was suggested by the finding that adult head size was associated with late life cognitive function but head size recorded at the time of birth was not. Since head size increases rapidly within the first few years postnatally and is then fixed by about age 7, a critical period for the influence of brain development on late life cognition appears to occur between birth and early to middle childhood. As such, factors that promote brain growth particularly during this period may help protect against late life cognitive decline. Influences on brain development during this and other periods are likely to include a variety of inter-related factors. Malnutrition is known to alter brain development and intelligence (Ivanovic et al., 2000). Other related factors likely include socioeconomic condition, early educational or enriching experiences, childhood adversity, traumatic events and the presence of other stressors (Lee et al., 2010; Salum et al., 2010; Tomalski & Johnson, In Press; Whalley, 2006). Early exposures may also increase susceptibility to a variety of diseases which can have their own independent effects on late life cognition. For example, low birth weight (which clusters with small head size (MacLullich et al., 2002)) increases risk of impaired glucose tolerance, non-insulin-dependent diabetes mellitus (Hales et al., 1991; Phipps et al., 1993; Rich-Edwards et al., 1999) and hypertension (Huxley et al., 2000) in late life; small head size has also been associated with increased risk of cardiovascular mortality (Barker et al., 1993).
There is disagreement about whether brain size should be corrected for body size in some way (Rushton, 2009). Brain volume is known to correlate with other body measurements including height (Rushton, 1992) and body mass (Ho et al., 1980). Some of the same factors that affect brain development also affect other morphometric measurements. Previous work has shown that both head size and height are related to nutrition and other factors during fetal and childhood development (Oyedeji et al., 1997). Co-varying ICV by other body measurements likely removes some of the variance of interest. However, in the present study we found that a model that did not correct ICV for height produced essentially the same results as our initial model (results not shown).
The present study has a number of strengths. It utilized a cognitively, educationally and ethnically diverse sample that has a wide range of life experiences and socioeconomic backgrounds. For example, educational attainment ranged from no formal education to doctoral degrees. The diversity in our sample is important, first, to ensure sufficient variance to detect associations, if present, between brain size and cognition and, second, to increase the generalizabilty of results. Some previous studies that have not found associations between head size/intracranial volume and cognition or the development of dementia, but were based primarily on well educated Caucasian samples where reduced variability may have limited the ability to detect relationships.
Another important advantage of the heterogeneity of our sample was that we were able to evaluate whether relationships between MRI variables and cognition were similar in three ethnic groups, African Americans, Hispanics, and Caucasians, that presumably had very different life experiences. These results address an important question about whether relationships observed in the combined sample also hold within ethnic subgroups, or alternately, might reflect confounding effects of ethnicity whereby observed relationships between MRI variables and cognition are entirely explained by relationships with ethnicity. Results showed that MRI – cognition relationships did not differ substantially across ethnic group. These results suggests that there are important mechanisms accounting for brain and cognitive development that are common across groups of individuals who have come from very different backgrounds with different life experiences and exposures.
Heterogeneity in terms of dementia type was, however, was limited in our sample. That is, those participants with a dementia syndrome were predominantly diagnosed with Alzheimer’s disease. As such, it is possible that results would differ in samples that had a much different distribution of dementia type (i.e. a sample with predominantly vascular dementia or Frontotemporal dementia).
We also examined whether results differed in males and females and in normal and cognitively impaired individuals. Relationships of brain structure and cognition did not differ according to gender, and this is important because brain volume and general body size clearly differ in these groups. Results were substantially the same when clinical diagnosis was considered. Minor differences were noted for two variables. Executive Function was more strongly related to intracranial volume in cognitive impaired individuals than in normals, but was related in both groups. Semantic Memory was weakly related to total brain matter in Impaired but not Normal individuals. Overall, these results indicate that the relationships of cognition with brain structure are robust across different groups included in our sample. Similarly, results did not change after controlling for age and education level in this diverse sample, further arguing that the obtained findings are robust with respect to the influences of potential confounding variables.
There is mounting evidence that early life environment and experiences play a role in the susceptibility to disease later in life, including modifying one’s risk of Alzheimer’s disease. The present study demonstrates that cognitive abilities in late life are a function of both baseline brain size and the impact of current pathological processes impinging on it. Additionally, ICV appears to be most relevant to neocortically-mediated cognitive abilities and not to memory, a finding that had not been explicitly delineated previously. An important implication of these results is that late many life cognitive functions are not simply a result of brain injury associated with age related diseases, but are also influenced by early in life factors. The current findings suggest that studies examining the effects of brain volumes on cognitive function in aging need to take into account both maximal and current brain volumes. The common practice of “normalizing” volumes to ICV results in overlooking the effects of ICV itself. While this study directly examined associations between ICV and cross sectional measures of cognition, further research on ICV as a predictor of longitudinal change in cognition is needed to clarify the significance of these findings. In particular, ICV is a readily available variable that could be useful to help quantify and study brain reserve and evaluation of its relationship to future cognitive decline will be critical to better defining its clinical significance and role in measuring brain reserve.
Supplementary Material
Acknowledgments
This work was supported by grants AG021511, AG10220, AG031563, AG10129 from the National Institute on Aging, Bethesda, MD and the California Department of Public Health Alzheimer’s Disease Program Contracts 09-11406 and 09-11407. This material is the result of work supported with resources and the use of facilities at the Northern California VA Medical Center).
Footnotes
None of the authors of this paper have any actual or potential conflicts of interest.
Publisher's Disclaimer: This is a PDF file of an unedited manuscript that has been accepted for publication. As a service to our customers we are providing this early version of the manuscript. The manuscript will undergo copyediting, typesetting, and review of the resulting proof before it is published in its final citable form. Please note that during the production process errors may be discovered which could affect the content, and all legal disclaimers that apply to the journal pertain.
References
- American Psychiatric Association. Diagnostic and statistical manual of mental disorders. 3. Washington DC: American Psychiatric Association; 1987. [Google Scholar]
- Barker DJP, Osmond C, Simmonds SJ, Wield GA. The relation of small head circumference and thinness at birth to death from cardiovascular disease in adult life. BMJ. 1993;306:422–426. doi: 10.1136/bmj.306.6875.422. [DOI] [PMC free article] [PubMed] [Google Scholar]
- Bentler PM. Comparative fit indices in structural models. Psychol Bul. 1990;107:238–246. doi: 10.1037/0033-2909.107.2.238. [DOI] [PubMed] [Google Scholar]
- Bentler PM. EQS for Windows User’s Guide. Encino, CA: Multivariate Software; 1995. [Google Scholar]
- Borenstein Graves A, Mortimer JA, Bowen JD, McCormick WC, McCurry SM, Schellenberg GD, Larson EB. Head circumference and incident Alzheimer’s disease: modification by apolipoprotein E. Neurology. 2001;57:1453–1460. doi: 10.1212/wnl.57.8.1453. [DOI] [PubMed] [Google Scholar]
- Browne MW, Cudeck R. Alternative ways of assessing model fit. In: Bollen KA, Long JS, editors. Testing Structural Equation Models. Beverly Hills: Sage; 1993. [Google Scholar]
- Christensen H, Batterham PJ, MacKinnon AJ, Anstey KJ, Wen W, Sachdev PS. Education, atrophy, and cognitive change in an epidemiological sample in early old age. Am J Geriatr Psychiatry. 2009;17:218–226. doi: 10.1097/JGP.0b013e3181961a84. [DOI] [PubMed] [Google Scholar]
- Crane P, Narasimhalu K, Gibbons LE, Pedraza O, Mehta KM, Tang Y, Manly JJ, Reed B, Mungas D. Composite scores for executive function items: demographic heterogeneity and relationships with quantitative magnetic resonance imaging. J Int Neuropsychol Soc. 2009;14:746–759. doi: 10.1017/S1355617708081162. [DOI] [PMC free article] [PubMed] [Google Scholar]
- DeCarli C, Massaro J, Harvey D, Hald J, Tullberg M, Au R. Measures of brain morphology and infarction in the Framingham Heart Study: Establishing what is normal. Neurobiol Aging. 2005;26:491–510. doi: 10.1016/j.neurobiolaging.2004.05.004. [DOI] [PubMed] [Google Scholar]
- DeCarli CE, Fletcher E, Rameny V, Harvey D, Jagust W. Anatomical mapping of white matter hyperintensities (WMH): exploring the relationships between periventricular WMH, deep WMH, and total WMH burden. Stroke. 2005;36:50–55. doi: 10.1161/01.STR.0000150668.58689.f2. [DOI] [PMC free article] [PubMed] [Google Scholar]
- DeCarli CE, Maisog J, Murphy G, Teichberg D, Rapoport SI, Horwitz B. Method for quantification of brain, ventricular, and subarachoid CSF volumes for MR images. J Comput Assist Tomogr. 1992;16:274–284. doi: 10.1097/00004728-199203000-00018. [DOI] [PubMed] [Google Scholar]
- DeCarli CE, Murphy G, Teichberg D, Campbell G, Sobering GS. Local histogram correction of MRI spatially dependent image pixel intensity nonuniformity. J Magn Reson Imaging. 1996;6:519–528. doi: 10.1002/jmri.1880060316. [DOI] [PubMed] [Google Scholar]
- Edland S, Xu Y, Plevak M, O’Brien P, YTangalos EG, Petersen RC, Jack CR. Total intracranial volume: normative values and lack of association with Alzheimer’s disease. Neurology. 2002;59:272–274. doi: 10.1212/wnl.59.2.272. [DOI] [PubMed] [Google Scholar]
- Espinosa PS, Kryscio RJ, Mendiondo MS, Schmitt FA, Wekstein DR, Markesbery WR, Smith CD. Alzheimer’s disease and head size. J Alzheimers Dis. 2006;9:77–80. doi: 10.3233/jad-2006-9108. [DOI] [PubMed] [Google Scholar]
- Gale CR, Walton S, Martyn CN. Foetal and postnatal head growth and risk of cognitive decline in old age. 2003;126:1–6. doi: 10.1093/brain/awg225. [DOI] [PubMed] [Google Scholar]
- Graves AB, Mortimer JA, Larson EB, Wenzlow A, Bowen JD, McCormick WC. Head circumference as a measure of cognitive reserve, association with severity of impairment in Alzheimer’s disease. Br J Psychiatry. 1996;169:86–92. doi: 10.1192/bjp.169.1.86. [DOI] [PubMed] [Google Scholar]
- Hales CN, Barker DJP, Clark PM, Cox LJ, Fall CH, Osmond C, Winter PD. Fetal and infant growth and impaired glucose tolerance at age 64. BMJ. 1991;303:1019–1022. doi: 10.1136/bmj.303.6809.1019. [DOI] [PMC free article] [PubMed] [Google Scholar]
- Haug H. Brain size, surfaces, and neuronal size of the cortex cerebri. Am J Anatomy. 1987;180:126–142. doi: 10.1002/aja.1001800203. [DOI] [PubMed] [Google Scholar]
- Ho K, Roessmann U, Straumfjord JV, Monroe G. Analysis of brain weight: I & II. Archives of Pathology and Laboratory Medicine. 1980;104:635–645. [PubMed] [Google Scholar]
- Hu L, Bentler PM. Fit indices in covariance structure modeling: sensitivity to under parameterized model misspecification. Psychol Methods. 1998;3:424–453. [Google Scholar]
- Huxley RR, Shiell AW, Law CM. The role of size at birth and postnatal catch-up growth in determining systolic blood pressure: a systematic review of the literature. J Hypertens. 2000;18:815–831. doi: 10.1097/00004872-200018070-00002. [DOI] [PubMed] [Google Scholar]
- Ivanovic DM, Leiva BP, Inzunza NB, Almagia AF, Toro TD, Urrutia MS, Cervilla JO, Bosch EO. Long-term effects of severe undernutrition during the first year of life on brain development and learning in Chilean high-school graduates. Nutrition. 2000;16:1056–1063. doi: 10.1016/s0899-9007(00)00431-7. [DOI] [PubMed] [Google Scholar]
- Jack CR, Petersen RC, Xu Y, O’Brien PC, Smith GE, Ivnik R, Boeve BF, Tangalos EG, Kokmen E. Rates of hippocampal atrophy correlate with change in clinical status in aging and AD. Neurology. 2000;22:484–489. doi: 10.1212/wnl.55.4.484. [DOI] [PMC free article] [PubMed] [Google Scholar]
- Jenkins R, Fox NC, Rossor AM, Harvey RJ, Rosser MN. Intracranial volume and Alzheimer’s disease: evidence against the cerebral reserve hypothesis. Arch Neurol. 2000;57:220–224. doi: 10.1001/archneur.57.2.220. [DOI] [PubMed] [Google Scholar]
- Jeong SK, Kim JM, Shin MH, Seo MW, Kim YH. Does arm length indicate cognitive and functional reserve. Int J Geriatr Psychiatry. 2005;20:406–412. doi: 10.1002/gps.1295. [DOI] [PubMed] [Google Scholar]
- Kim JM, Stewart R, Shin IS, Kim SW, Yang SJ. Associations between head circumference, leg length and dementia in a Korean population. Int J Geriatr Psychiatry. 2008;23:41–48. doi: 10.1002/gps.1833. [DOI] [PubMed] [Google Scholar]
- Lee KS, Cheong H, Eom J, Jung HS, Oh BH, Hong CH. Cognitive decline is associated with nutritional risk in subjects with small head circumference (HC) Arch Gerontol Geriatr. 2010;51:105–109. doi: 10.1016/j.archger.2009.09.002. [DOI] [PubMed] [Google Scholar]
- MacLullich AMJ, Ferguson KJ, Deary IJ, Seckle JR, Starr JM, Wardlaw JM. Intracranial capacity and brain volumes are associated with cognition in health elderly men. Neurology. 2002;59:169–174. doi: 10.1212/wnl.59.2.169. [DOI] [PubMed] [Google Scholar]
- Mori E, Hirono N, Yamashita H. Premorbid brain size as a determinant of reserve capacity against intellectual decline in Alzheimer’s disease. Am J Psychiatry. 1997;154:18–24. doi: 10.1176/ajp.154.1.18. [DOI] [PubMed] [Google Scholar]
- Morris JC, Weintraub S, Chui HC, Cummings JL, DeCari C, Ferris S, Foster N, Galasko D, Graff-Radford N, Peskind ER, Beekley D, Ramos EM, Kukull WA. The Uniform Data Set (UDS): clinical and cognitive variables and descriptive data from the Alzheimer Disease Centers. Alzheimer Dis Assoc Disord. 2006;20:210–216. doi: 10.1097/01.wad.0000213865.09806.92. [DOI] [PubMed] [Google Scholar]
- Mortimer JA, Snowdon DA, Markesbery WR. Head circumference, education and risk of dementia: findings from the nun study. J Clin Experiment Neuropsychol. 2003;25:671–679. doi: 10.1076/jcen.25.5.671.14584. [DOI] [PubMed] [Google Scholar]
- Mungas D, Harvey D, Reed B, Jagust W, DeCari C, Beckett L, Mack WJ, Kramer JH, Weiner MW, Schupf N, Chui H. Longitudinal volumetric MRI change and rate of cognitive decline. Neurology. 2005;65:565–571. doi: 10.1212/01.wnl.0000172913.88973.0d. [DOI] [PMC free article] [PubMed] [Google Scholar]
- Mungas D, Reed B, Crane P, Haan M, Gonzales H. Spanish and English Neuropsychological Assessment Scales (SENAS): Further development and psychometric characteristics. Psychol Assess. 2004;16:347–359. doi: 10.1037/1040-3590.16.4.347. [DOI] [PubMed] [Google Scholar]
- Mungas D, Reed B, Farias S, DeCari C. Age and education effects on relationships of cognitive test scores with brain structure in demographically diverse older persons. Psychol Aging. 2009;24:116–128. doi: 10.1037/a0013421. [DOI] [PMC free article] [PubMed] [Google Scholar]
- Mungas D, Reed B, Farias S, DeCarli C. Criterion-referenced validity of a neuropsychological test battery: Equivalent performance in elderly Hispanic and Non-Hispanic Whites. J Int Neuropsychol Soc. 2005;11:620–630. doi: 10.1017/S1355617705050745. [DOI] [PMC free article] [PubMed] [Google Scholar]
- Mungas D, Reed B, Marshall S, Gonzales H. Development of psychometrically matched English and Spanish neuropsychological tests for older persons. Neuropsychol. 2000;14:209–223. doi: 10.1037//0894-4105.14.2.209. [DOI] [PubMed] [Google Scholar]
- Muthen LK, Muthen BO. MPlus: User’s guide. sixth edition. Los Angeles: Muthen & Muthen; 2010. [Google Scholar]
- Oyedeji GA, Olamijulo SK, Osinaike AL, Esimai VC, Aladekomo TA. Head circumference of rural Nigerian children- the effects of malnutrition on brain growth. Cen Afr J Med. 1997;43:264–268. [PubMed] [Google Scholar]
- Pakkenberg B, Gundersen HJG. Neocortical neuron number in humans: Effects of sex and age. Journal of Comparative Neurology. 1997;384:312–320. [PubMed] [Google Scholar]
- Pfefferbaum A, Mathalon DH, Sullican EV, Rawles JM, Zipurskey RB, Lim KO. A quantitative magnetic resonance imaging study of chnages in brain morphology from infancy to late adulthood. Arch Neurol. 1994;51:874–887. doi: 10.1001/archneur.1994.00540210046012. [DOI] [PubMed] [Google Scholar]
- Phipps K, Barker DJP, Hales CN, Fall CH, Osmond C, Clark PM. Fetal growth and impaired glucose tolerance in men and women. Diabetologia. 1993;36:225–228. doi: 10.1007/BF00399954. [DOI] [PubMed] [Google Scholar]
- Reynolds MD, Johnston JM, Dodge HH, DeKosky ST, Ganguli M. Small head size is related to low Mini-Mental State Examination scores in a community sample of nondemented older adults. Neurology. 1999;53:228–229. doi: 10.1212/wnl.53.1.228. [DOI] [PubMed] [Google Scholar]
- Rich-Edwards JW, Colditz GA, Stampfer MJ, Willett WC, Gillman MW, Hennekens CH, Speizer FE, Manson JE. Birthweight and the risk for type 2 diabetes mellitus in adult women. Ann Intern Med. 1999;130:278–284. doi: 10.7326/0003-4819-130-4_part_1-199902160-00005. [DOI] [PubMed] [Google Scholar]
- Rushton JPA, C D. Cranial capacity related to sex, rank, and race in a stratified random sample of 6,325 U.S. military personnel. Intelligence. 1992;16:401–413. [Google Scholar]
- Rushton JPA, C D. Whole Brain size and general mental ability: A Review. International Journal of Neuroscience. 2009;119:692–732. doi: 10.1080/00207450802325843. [DOI] [PMC free article] [PubMed] [Google Scholar]
- Salum GA, Polanczyk GV, Miguel EC, Rohde LA. Effects of childhood development on late-life mental disorders. Curr Opin Psychiatry. 2010;23:498–503. doi: 10.1097/YCO.0b013e32833ead33. [DOI] [PubMed] [Google Scholar]
- Saykin AJ, Wishart HA, Rabin LA, Santulli RB, Flashman LA, Waest JD, McHugh TL, Mamourian AC. Older adults with cognitive complaints show brain atrophy similar to that of amnestic MCI. Neurology. 2006;67:834–842. doi: 10.1212/01.wnl.0000234032.77541.a2. [DOI] [PMC free article] [PubMed] [Google Scholar]
- Scazufca M, Menezes PR, Araya R, DiRienzo V, Almeida OP, Gunnell D, Lawlor DA. Risk factors across the life course and dementia in a Brazilian population: results from the Sao Paulo Ageing & Health Study (SPAH) Int J Epidemiol. 2008 doi: 10.1093/ije/dyn125. [DOI] [PubMed] [Google Scholar]
- Schofield PW, Logroscino G, Andrews H, Albert S, Stern Y. An association between head circumference and Alzheimer’s disease in a population-based study of aging and dementia. Neurology. 1997;49:30–37. doi: 10.1212/wnl.49.1.30. [DOI] [PubMed] [Google Scholar]
- Schofield PW, Mosesson RE, Stern Y. The age at onset of Alzheimer’s disease and an intracranial area measurement. A relationship. Arch Neurol. 1995;52:95–98. doi: 10.1001/archneur.1995.00540250103019. [DOI] [PubMed] [Google Scholar]
- Sgouros S, Goldin JH, Hockley AD, Wake MJC, Natarajan K. Intracranial volume change in childhood. J Neurosurg. 1999;91:610–616. doi: 10.3171/jns.1999.91.4.0610. [DOI] [PubMed] [Google Scholar]
- Shenkin SD, Rivers CS, Deary IJ, Starr JM, Wardlaw JM. Maximum (prior) brain size, not atrophy, correlates with cognition in community-dwelling older people: a cross-sectional neuroimaging study. BMC Geriatrics. 2009:9. doi: 10.1186/1471-2318-9-12. [DOI] [PMC free article] [PubMed] [Google Scholar]
- Sluimer JD, cvan der Flier WM, Karas GB, Fox NC, Scheltens P, Barkhof F, Vrenken H. Whole-brain atrophy rate and cognitive decline: longitudinal MR study of memory clinic patients. Radiology. 2008;248:590–598. doi: 10.1148/radiol.2482070938. [DOI] [PubMed] [Google Scholar]
- Staff RT, Murray AD, D IJ, Whalley LJ. What provides cerebral reserve? Brain. 2004;127:1191–1199. doi: 10.1093/brain/awh144. [DOI] [PubMed] [Google Scholar]
- Tisserand DJ, NBosma H, Van Boxtel MP, Jolles J. Head size and cognitive ability in nondemented older adults are related. Neurology. 2001;56:969–971. doi: 10.1212/wnl.56.7.969. [DOI] [PubMed] [Google Scholar]
- Tomalski P, Johnson MH. The effects of early adversity on the adult and developing brain. Curr Opin Psychiatry. doi: 10.1097/YCO.0b013e3283387a8c. In Press. [DOI] [PubMed] [Google Scholar]
- Tucker LR, Lewis C. A reliability coefficient for maximum likelihood factor analysis. Psychmetrika. 1973;38:1–10. [Google Scholar]
- Van Petten C. Relationship between hippocampal volume and memory ability in healthy individuals across the lifespan: review and meta-analysis. Neuropsychologia. 2004;42:1394–1413. doi: 10.1016/j.neuropsychologia.2004.04.006. [DOI] [PubMed] [Google Scholar]
- Whalley LJ. A life-course approach to the aetiology of late-onset dementias. Lancet Neurol. 2006;5:87–96. doi: 10.1016/S1474-4422(05)70286-6. [DOI] [PubMed] [Google Scholar]
- Wilson R, Beckett L, Barnes L, Schneider JA, Bach J, Evans DA, Bennett DA. Individual differences in rates of change in cognitive abilities of older adults. Psychol Aging. 2002;17:179–193. [PubMed] [Google Scholar]
- Wolf H, Hensel A, Kruggel F, Riedel-Heller SG, Arendt T, Wahlund L, Gertz H. Structural correlates of mild cognitive impairment. Neurobiol Aging. 2004;25:913–924. doi: 10.1016/j.neurobiolaging.2003.08.006. [DOI] [PubMed] [Google Scholar]
- Wolf H, Kruggel F, Hensel A, Wahlund L, Arendt T, Gertz H. The relationship between head size and intracranial volume in elderly subjects. Brain Res. 2003;973:74–80. doi: 10.1016/s0006-8993(03)02552-6. [DOI] [PubMed] [Google Scholar]
- Yoshita M, Fletcher E, Harvey D, Ortega M, Martinez O, Mungas D, Reed B, DeCari C. Extent and distribution of white matter hyperintensities in normal aging, MCI, and AD. Neurology. 2006;67:2192–2198. doi: 10.1212/01.wnl.0000249119.95747.1f. [DOI] [PMC free article] [PubMed] [Google Scholar]
Associated Data
This section collects any data citations, data availability statements, or supplementary materials included in this article.