Abstract
Objective
The development of a cytokine detection assay suitable for detection of multiple biomarkers for improved diagnosis of mycobacterial diseases.
Design and Methods
A lateral flow (LF) assay to detect IL-10 was developed utilizing the up-converting phosphor (UCP) reporter-technology. The assay was evaluated using blood samples of leprosy patients. Multiplex applications were explored targeting: 1) IL-10 and IFN-γ in assay buffer; 2) IL-10 and anti-phenolic glycolipid (PGL-I) antibodies in serum from leprosy patients.
Results
Detection of IL-10 below the targeted level of 100 pg/mL in serum was shown. Comparison with ELISA showed a quantitative correlation with R2 value of 0.92. Multiplexing of cytokines and simultaneous detection of cytokine and antibody was demonstrated.
Conclusions
The UCP-LF IL-10 assay is a user-friendly, rapid alternative for IL-10 ELISAs, suitable for multiplex detection of different cytokines and can be merged with antibody-detection assays to simultaneously detect cellular- and humoral immunity.
Keywords: cytokine, diagnostic test, IL-10, IFN-γ, lateral flow, leprosy, multiplex analysis, mycobacteria, anti-PGL-I, up-converting phosphor
INTRODUCTION
In human infectious diseases the quality and quantity of the innate and adaptive immune response, determine the outcome of infection. In this process cellular mediated immunity (CMI) and humoral mediated immunity (HMI) play pivotal roles in orchestrating the immune response towards protection against disease. T cells, the major adaptive components of CMI, exist in multiple, functionally different lineages each with distinct effector functions. Activated CD4+ Th (T helper) cells have been functionally divided into at least four major subsets, designated Th1, Th2, Th17 and Treg (regulatory) cells. These cells are distinguished by their specific cytokine production or functions. Th1 cells produce IFN-γ, IL-2, TNF-α and lymphotoxin and participate in cell-mediated responses to intracellular pathogens. They are considered essential, though not sufficient, for protection against mycobacterial disease [1]. Th2 cells produce IL-4, IL-5, IL-6, IL-9, IL-10 and IL-13 and are involved in responses to large extracellular pathogens, such as parasites. Th17 cells produce IL-17, often IL-22 and TNF-α, and participate in host defense against extracellular bacterial and fungal pathogens. Treg cells can produce the anti-inflammatory cytokine IL-10, and are involved in regulating and balancing T cell and immune reactivity in general [2]. Simultaneous measurement of different types of cytokine biomarkers of the immune response could be used to indicate pathogenic processes and responses to therapeutic interventions [3].
Previously, we reported the development of a user-friendly assay to detect IFN-γ secretion by T cells with high analytical sensitivity [4]. Since IFN-γ is the hallmark effector molecule of Th1 cells, and a critical component of the pro-inflammatory immune response, it is often used as a biomarker to detect protective immune responses against mycobacterial diseases such as leprosy and tuberculosis. IFN-γ levels down to 2 pg/mL were detected applying a lateral flow (LF) immuno-sandwich assay utilizing highly sensitive up-converting phosphor (UCP) reporter particles. UCP reporter technology was applied as it has shown to improve the performance of LF assays and allowed quantitative detection of a variety of analytes, e.g. drugs of abuse [5], protein antigens from various pathogens [6–8], nucleic acids [9;10], humoral immune responses [11;12], and hormones [13]. The assay was developed as a low-tech robust assay for applications in remote and/or resource poor environments, and was evaluated with clinical samples from leprosy patients.
Besides IFN-γ, additional secreted cytokines have recently been identified as useful markers [14]. For example, in the diagnosis of tuberculosis, the ratio between IFN-γ and IL-10 can be used to predict disease severity [3]. Currently, field-friendly assays that combine the detection of multiple biomarkers are not readily available. The previously developed high sensitivity UCP-LF assay format for IFN-γ detection was therefore adapted aiming at a format that would allow cytokine multiplexing. In this study we describe a modified format and applied this to IL-10 detection using clinical samples from leprosy patients. Whereas the pro-inflammatory cytokine IFN-γ contributes to protection against mycobacteria, the anti-inflammatory cytokine IL-10 has been shown to be associated with dampening down the function of the Th1 cells and exerts a suppressive role by inducing an inhibitory effect on cell-mediated immune responses towards mycobacteria [15–17]; IL-10 is preferentially expressed in lepromatous lesions and abundantly produced by type 2 macrophages [17;18]. Moreover, the IL-10 locus contributes to the outcome of leprosy allowing IL-10 promoter-genotypes of five single-nucleotide polymorphisms (SNPs) to be used as markers for leprosy susceptibility and severity [19;20].
After tuberculosis, leprosy is the second most common mycobacterial infection in humans [21]. Leprosy is a spectral disease [22], ranging from strong cellular immunity in tuberculoid (TT) patients to predominantly humoral responses in lepromatous leprosy (LL) with unstable borderline states positioned in between. This characteristic spectrum renders leprosy very useful as a model to study immune responses in relation to disease outcome. The multiplex approach has significant advantages for classification of leprosy status, prediction of disease outcome at early stages and, measuring/monitoring the effects of intervention (therapeutic drugs, vaccines). It may allow simultaneous detection of both cellular and humoral immune responses, thereby covering the complete immunological leprosy spectrum. In this study we have explored how our UCP-LF assay for human IL-10 detection can be applied not only for cytokine multiplexing but also for simultaneous detection of cytokines and human anti-PGL-I IgM antibodies.
METHODS
Whole blood and peripheral blood mononuclear cells (PBMC) samples
Samples used for development and validation of IL-10, IFN-γ and anti-PGL-I assays included: 1) recombinant human IL-10 and IFN-γ standard (U-CyTech, Utrecht, The Netherlands) in LF buffer; 2) sera of leprosy patients and healthy controls; 3) supernatant of in vitro PBMC in culture medium (AIM-V, Invitrogen, Carlsbad, CA) containing M. leprae whole cell sonicate (10 μg/ml) or phytohemagglutinin (PHA; 1μg/ ml) [4;23]; and 4) whole blood samples, 450 μL of undiluted heparinized blood from leprosy patients, within 2 h after venepuncture incubated (for 20–24 h) at 37 ºC, 5% CO2 and 70% relative humidity in 48-well cluster plates (Costar, Corning Inc.) with 50 μL of M. leprae whole cell sonicate at a final concentration of 10 μg/mL. Pooled normal human serum (NHS) was obtained from Dunn Labortechnik GmbH (Asbach, Germany).
Anti-PGL-I antibody, synthetic PGL-I epitope and M. leprae whole cell sonicate
Anti-PGL-I mAb (CS-48), synthetic PGL-I (ND-O-HSA), and M. leprae whole cell sonicate were generated with support from the NIH/NIAID Leprosy Contract N01-AI-25469. The disaccharide epitope (3,6-di-O-methyl-β-D-glucopyranosyl(1→4)2,3-di-O-methylrhamnopyranoside) of M. leprae specific native PGL-I glycolipid was synthesized and coupled to human serum albumin (ND-O-HSA) as previously described by Cho et al. [24]. Inactivated (irradiated) armadillo-derived M. leprae whole cells were probe sonicated with a Sanyo sonicator to > 95% breakage. All materials were kindly provided by Dr. Patrick J. Brennan, Colorado State University, Fort Collins, CO, USA).
ELISA for detection of IL-10, IFN-γ and anti-PGL-I IgM
IL-10 levels were determined in 96 well Nunc MaxiSorp® microtiterplates coated with anti-IL-10 mAb mO-13-10-12 and detection was carried out with biotinylated anti-IL-10 pAb mB-15-10-26. IL-10 antibodies and IL-10 standard were obtained from U-CyTech Biosciences (Utrecht, the Netherlands). The presence of biotinylated antibody was detected enzymatically using streptavidin-HRP (horse-radish peroxidase). The threshold value to define positive responses was set beforehand at 100 pg/mL, similar to the level maintained for IFN-γ [4]. Concentration values for unstimulated whole blood and PBMC cultures were typically ≤10 pg/ml. Anti-PGL-I IgM antibody levels were determined by ELISA as previously described [25].
UCP conjugates and LF strips
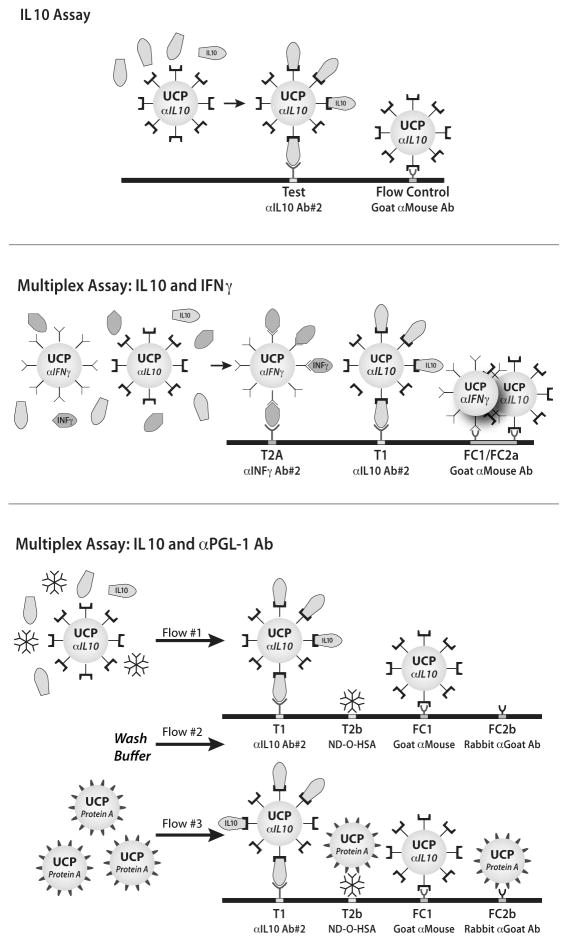
IL-10 specific UCP reporter conjugate was prepared by conjugating 25 μg anti-IL-10 mAb mO-13-10-12 (coating mAb in ELISA) per 1 mg of carboxylated UCP particles [4;9]. LF strips were prepared with a test (T) line at 2.0 cm comprised of anti-IL-10 mAb mO-10-10-28 (U-CyTech Biosciences; 200 ng per strip; 4 mm width) and goat anti-mouse pAb (Sigma-Aldrich Co., Saint Louis, MO, USA) flow-control (FC) line of 80 ng per strip at 2.5 cm (Fig. 1A).
Fig. 1. Schematic illustration of the IL-10 and multiplex assay formats.
Panel A: the developed rapid one-step solution phase assay format to detect cytokine IL-10; panel B: simultaneous detection of IL-10 and IFN-γ; panel C: simultaneous detection of IL-10 and human anti-PGL-I antibody. In the figure anti- is indicate by α; Ab indicates antibody.
UCP-conjugates with IFN-γ and protein-A were prepared using respectively 25 μg anti-IFN-γ mAb (mO-15-43-09; U-CyTech Biosciences) or protein A (Repligen Corp., Waltham, MA, USA). LF strips for cytokine multiplex assays were prepared by providing IL-10 LF strips with a second Test (T2a) line at 1.5 cm (5 mm up-stream of the IL-10 Test line), comprised of anti-IFN-γ mAb mO-13-32-18 (U-CyTech) at a concentration of 200 ng per strip (Fig. 1B). Simultaneous detection of cytokine and antibody required LF strips with four capture lines (Fig. 1C). Test lines were located as follows: IL-10 (T1) at 1.5 cm, anti-PGL-1 (T2b) at 1.9 cm. The T2b line was comprised of ND-O-HSA conjugate at 50 ng per strip. Two Flow-Control lines (FC) were required: a goat anti-mouse pAb (80 ng per strip; FC1) located at 2.3 cm and a rabbit anti-goat pAb (100 ng per strip; FC2) located at 2.7 cm. The rabbit anti-goat pAb is the Flow-Control line for protein-A UCP conjugate.
The position of the capture lines is relative to beginning of the strip, comprised of a sample pad (1 cm), a nitrocellulose membrane (2.5 cm) and absorbent pad (2 cm); the total length of the strip is 5 cm, and different components overlap by 0.25 cm [9]. Batch to batch variations did not play a role when using Ratio calculations (Test signal divided by its Flow-Control signal) unless the amount of immobilized capture molecule and/or its localization were changed.
UCP-LF assay for detection of IL-10
The UCP-LF assays for cytokine detection comprise two steps (Fig. 1B). Step 1 is the solution phase: undiluted sample (generally 10 μL) is mixed with 90 μL LF buffer (100 mM Hepes pH 7.2, 270 mM NaCl, 1% BSA (w/v), 0.5% Tween-20 (v/v)) containing 100 ng UCP reporter conjugate and incubated for 30 min in a thermoshaker (37 ºC, 1200 rpm). Step 2 is the solid phase: the mixture from the solution phase is applied to a LF strip and allowed to run for at least 10 min. LF strips are then scanned in a Packard FluoroCountTM microtiterplate reader adapted with an infrared laser [26]. Upon IR excitation (980 nm) UCP reporter particles emit green light detectable using a 550 nm band pass filter. Results were displayed in histograms in relative fluorescence units (RFUs) measured at Test and Flow-Control lines, or as the Ratio value between Test and Flow-Control RFUs.
UCP-LF multiplex assays
Step 1 (solution phase) in the UCP-LF assay for simultaneous detection of IL-10 and IFN-γ was similar to the ‘IL-10 only’ assay but required a blend of two different UCP conjugates: 50 ng of anti-IL-10 UCP-conjugate and 50 ng anti-IFN-γ UCP-conjugate. Step 2 (solid phase) required appropriate multiplex LF strips (Fig. 1B).
For simultaneous detection of IL-10 cytokine and anti-PGL-I antibody, step 1 was identical to the ‘IL-10 only’ assay but utilized only half of the volume: 5 μL sample was mixed with 45 μL LF buffer containing 50 ng anti-IL-10-UCP conjugate and incubated (30 min, 37 ºC, 1200 rpm). Step 2 followed the protocol described previously for rapid detection of human antibodies [11]: 50 μL liquid phase mixture was applied to the appropriate multiplex LF strip, immediately followed by 20 μL LF buffer (wash) and 50 μL LF buffer containing 50 ng of UCP-protein-A conjugate (Fig. 1C).
RESULTS
Development of the UCP-LF IL-10 assay
Antibody configuration
For development of the UCP-LF IL-10 assay a monoclonal antibody pair used in IL-10 ELISAs was tested, using either ELISA coating-antibody conjugated to the UCP reporter and detection-antibody immobilized on the LF strip, or vice versa. Both configurations proved to be successful (results not shown). The configuration with the ELISA coating-antibody conjugated to the UCP reporter was used for further experiments as it showed slightly higher assay values.
Variation of solution phase incubation time
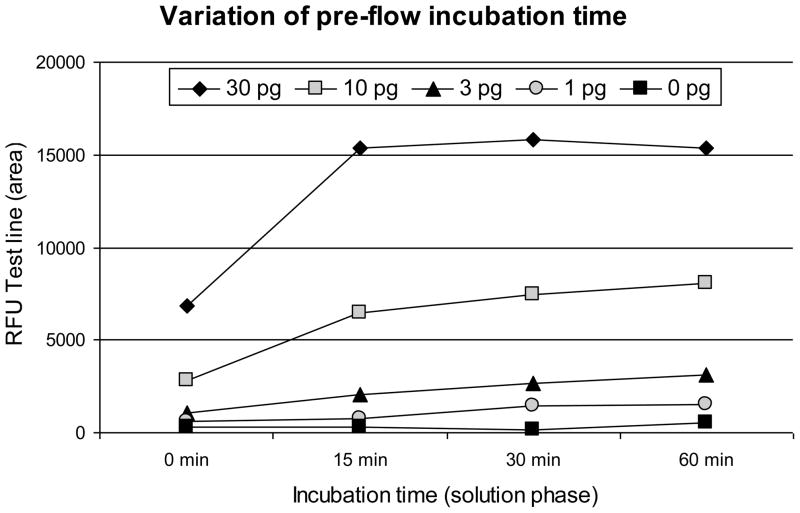
The solution phase of the IL-10 UCP-LF assay includes an incubation step. Since the duration of incubation may affect the signals measured at the Test and Flow-Control lines [10], serial dilutions of IL-10 (1 to 30 pg/strip) in assay buffer were analyzed after incubations of 0, 15, 30 and 60 minutes. A typical result is presented in Fig. 2. Analysis of the Test line signal indicated that the signal reaches a plateau value after 15 min when using ≥30 pg IL-10 per strip (100 μL assay volume).
Fig. 2. Effect of the duration of the liquid phase pre-flow incubation time.
The effect of the duration of the pre-flow solution phase incubation time of the IL-10 UCP-LF assay. The Test line signal was plotted against the incubation time; IL-10 in pg/strip. The average signal of a duplicate experiment is shown.
Analytical sensitivity
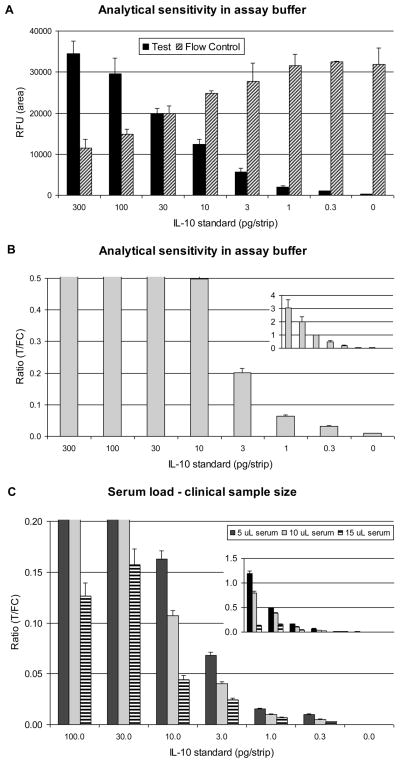
Serial dilutions of IL-10 in assay buffer demonstrated reproducible detection below 1 pg per strip. Assay results were evaluated by plotting RFUs measured at the Test and Flow-Control lines (Fig. 3A). More frequently, Test and Flow-Control signals are divided and presented as Ratio values (Fig. 3B) allowing better inter-assay comparison. The lowest amount of IL-10 used in this analysis, 0.3 pg generated values 3-fold higher than the no-target value. Assuming an input of 10 μL of clinical sample, the expected limit of detection is around 30 pg/mL.
Fig. 3. Analytical sensitivity of the UCP-LF assay for IL-10 detection.
Analysis of dilution series of IL-10 standard (in pg per 100 μL final assay volume, or pg/strip) analyzed with the UCP-LF IL-10 assay. Panel A: An assay without human serum (buffer only); histogram with the signal (RFU) measured at the Test line (T) and Flow-Control line (FC). Panel B: Ratio (R=T/FC) values calculated from panel A signals. Panel C: Assay with 5, 10 or 20% human serum; histogram with the Ratio value. Error bars indicate the standard deviation of the triplicates.
Effect of the amount of sample matrix on the LOD
The amount of sample allowed was determined utilizing normal human serum (NHS). IL-10 dilution series with variable concentrations of NHS (0–40% (v/v)) were analyzed. Fig. 3C shows results with 5, 10 and 15%, respectively; 10% serum load implies 10 μL serum in 100 μL final assay volume. As compared to a buffer-only assay (Fig. 3B), addition of serum decreased Ratio values but did not affect analytical sensitivity. The 10% serum load was chosen as the standard concentration for our assays. Use of significantly lower serum loads (e.g. 1% μL) led to lower sensitivity due to sample size limitation. Serum loads of 20% or higher led to large decreases in signal at the Test and Flow-Control lines, leading to unreliable T/FC Ratio values (not shown).
Evaluation of the IL-10 UCP-LF assay and the IL-10 ELISA
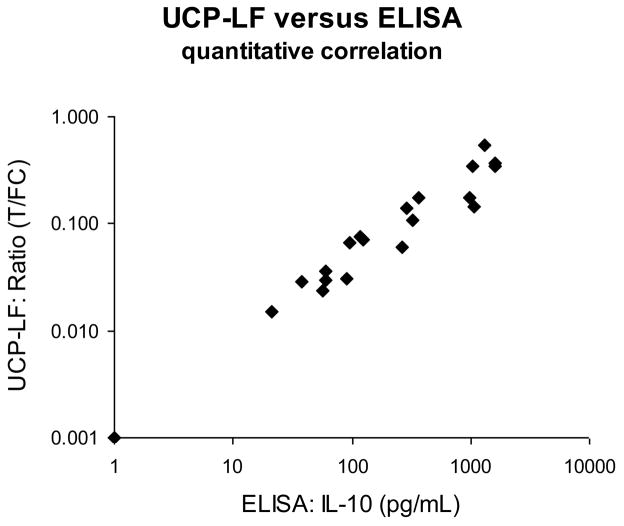
The IL-10 UCP-LF assay was evaluated with frozen supernatants of stimulated whole blood samples to analyze the correlation with our standard IL-10 ELISA. A set of 120 samples was analyzed qualitatively in a single blinded test. All samples were tested in duplicates and results were compared to ELISA values determined in earlier experiments. The analysis showed a 95% qualitative correlation. Some discrepancies between ELISA and UCP-LF results were noted mostly in the lower range around the maintained threshold of 100 pg/mL. Storage issues may have influenced the results, as ELISA values were determined at an earlier time point. To further analyze this, a subset of 24 samples (including these discrepant samples) was tested in duplicate simultaneously with the ELISA. The quantitative correlation between ELISA and UCP-LF test results was excellent (Fig. 4) also for samples with IL-10 concentrations below 100 pg/mL threshold; the few discrepancies observed initially could have been caused by sample storage conditions. For samples below 250 pg/mL the coefficient of determination (R2) was 0.92. At higher concentrations a minor high-dose hook effect was observed (UCP-LF values did not increase anymore at the same rate as the ELISA) leading to an overall R2 value of 0.86. This indicates excess of antigen with respect to the number of antigen bindingsites on the LF strip and UCP reporter resulting in somewhat lower Ratio values obtained with the UCP-LF assay.
Fig. 4. Comparison of ELISA and UCP-LF assays: evaluation of clinical samples.
ELISA and UCP-LF IL-10 assays were performed in parallel on 24 samples of stimulated whole blood or PBMC from leprosy patients and healthy non-endemic controls. The average UCP-LF Ratio (n=2) value is plotted on the y-axis against the ELISA-determined IL-10 concentrations on the x-axis (double log). Coefficient of determination for all samples R2 = 0.86, for samples below 250 IL-10 pg/mL R2 = 0.92.
Cytokine multiplexing: simultaneous detection of IL-10 and IFN-γ
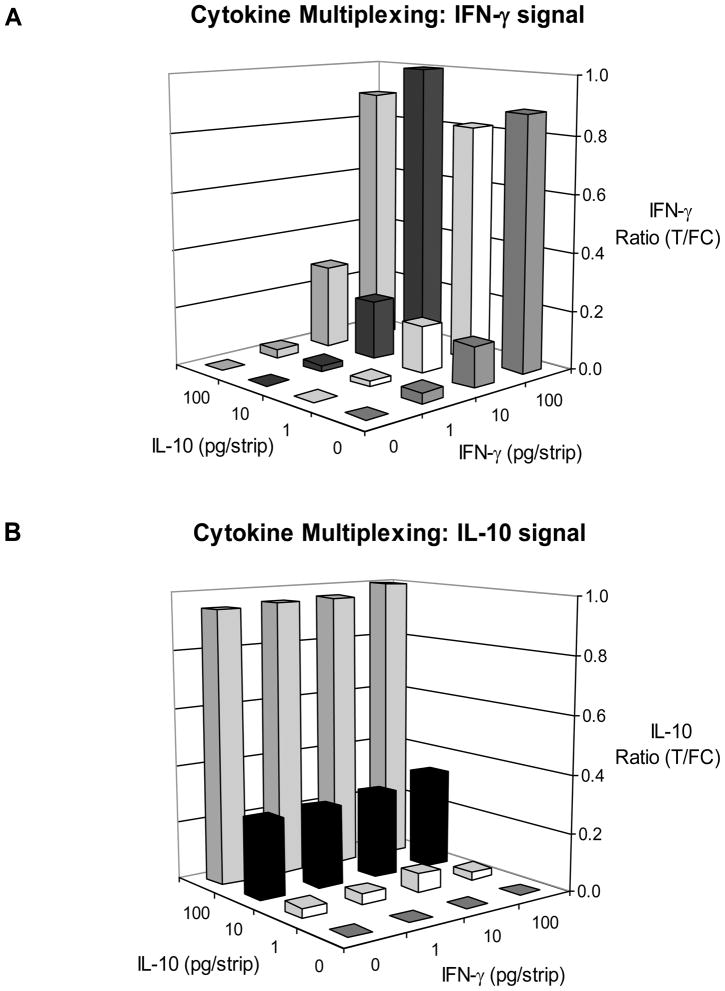
To investigate cytokine multiplexing dilution series of IL-10 and IFN-γ in assay buffer were mixed in different combinations, following a checkerboard matrix approach. Combinations were tested using a blend of IL-10- and IFN-γ-specific UCP reporter conjugates on three types of strips: 1) LF strips with a single Test line of anti-IL-10 (Fig. 1A); 2) LF strips with a single Test line of anti-IFN-γ; and 3) LF strips with two Test lines spatially separated (Fig. 1B). The strips with a single Test line specific for either cytokine did not indicate non-specific binding or cross-reactivity of any of the assay components. Fig. 5 shows the results from a typical experiment obtained with IFN-γ/IL-10 multiplex strips. Ratio values for IL-10 and for IFN-γ were calculated by dividing the individual Test signal by the joint Flow-Control (FC) signal. For both cytokines 1 pg per strip was detectable without the need for further modifications in the assay-format. The amount of 1 pg cytokine per strip is equivalent to 100 pg/mL in blood when the UCP-LF assay is performed with 10 μL serum.
Fig. 5. Cytokine multiplexing – simultaneous detection of IL-10 and IFN-γ.
Dilution series of IL-10 and IFN-γ mixtures in assay buffer were analyzed with the UCP-LF assay to investigate potential non-specific interactions. Panel A: Ratio values at the IL-10 Test line (T1 in Fig. 2B). Panel B: Ratio values at the IFN-γ Test line (T2a in Fig 2B). Ratio values were normalized by setting the highest determined Ratio value to 1.
Simultaneous detection of IL-10 and anti-PGL-I IgM
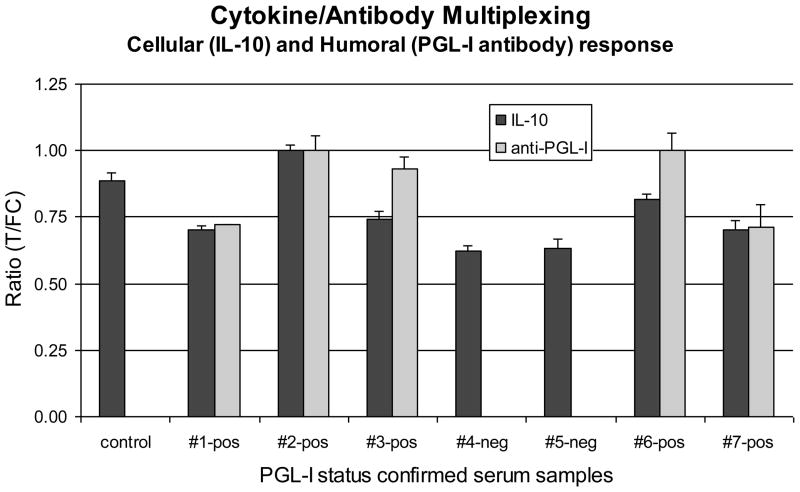
Seven leprosy patients’ sera with known anti-PGL-I titers (two negative and five positive for anti-PGL-I IgM) were spiked with 1000 pg/mL IL-10 and tested (blind) for the presence of both biomarkers. For this purpose the IL-10 assay format was merged with the previously developed Consecutive Flow (CF) format [11]. Merging implied standard 30 min incubation of IL-10 specific UCP reporter with serum, followed by addition of the mixture to the appropriate multiplex LF strip, a buffer wash-flow and, finally the flow of protein-A coated UCP reporters. The total volume flowed over the LF strips was 120 μL; respectively 50, 20 and 50 μL. The first 50 μL contained 5 μL serum (10% serum load) implying an absolute amount of 5 pg IL-10 per strip. Ratios were calculated by dividing appropriate Test and Flow-Control signals (T1/FC1 for IL-10 and T2b/FC2 for anti-PGL-I, see Fig. 1C); signals were normalized, the highest Ratio value for each of the two targets was set to one (Fig. 6). The five sero-positives were easily identified and the negatives did not show a PGL-I signal. Although the amount of IL-10 was identical in each sample, variation in signal between different samples was observed which may be caused by the presence of unidentified IL-10 complexing biomolecules in sera. Binding of the UCP reporter coated with protein-A to monoclonal antibodies on the IFN-γ and IL-10 specific Test lines was not observed when the amount of antibody immobilized on the Test line was kept at 200 ng per strip or lower. Also, protein-A binding to the UCP reporter coated with anti-IL-10 antibodies sitting at the IL-10 Test lines was not observed.
Fig. 6. Simultaneous detection of cytokine (IL-10) and antibody (anti-PGL-I IgM).
Seven serum samples from leprosy patients spiked with IL-10 (1000 pg/mL). The five multibacillary leprosy patient’s sera, positive in ELISA for anti-PGL-I IgM antibodies, also showed positive signals in the UCP-LF for anti-PGL-I. Two paucibacillary leprosy patients’ sera that were negative for anti-PGL-I IgM antibodies in ELISA as well as a healthy control serum sample, did not show a relevant signal with the UCP-LF assay. UCP-LF IL-10 signals were detected in all spiked samples; the variability in signal can be partly attributed to unidentified IL-10-complexing components in the individual sera.
DISCUSSION
In a previous study we reported the development of a user-friendly UCP-LF assay for the detection of cytokines in supernatants from in vitro cultured peripheral blood mononuclear cells [4]. The assay was optimized for sensitivity and allowed detection of IFN-γ down to 2 pg/mL culture supernatant. This study describes a distinct UCP-LF format for cytokine detection, in particular IL-10. The current format is focused on assay time and multiplex capability, rather than ultimate sensitivity. Detection of the cellular response (i.e. cytokine secretion by T cells) upon stimulation with M. leprae antigens in leprosy patients’ clinical samples was used as a model.
The assay volume of the UCP-LF IL-10 test is 100 μL, it allows detection of 0.3 pg IL-10 per LF strip under ideal conditions (e.g. ‘buffer-only’) including a 30 min pre-flow incubation. This allowed quantitative detection of IL-10 levels below the targeted 100 pg/mL cutoff threshold within one hour timeframe. As the viscosity of the clinical matrix determines the amount of sample that can be applied to the assay, it directly affects assay sensitivity. For cytokine testing the clinical matrix is mostly composed of serum. Spiking of IL-10 in serum showed that the UCP-LF format could be detect 30 pg/mL reproducibly when using 10 μL of spiked serum (a 10% serum concentration/load in a final assay volume of 100 μL). Relevantly higher levels of serum resulted in significant decrease of the signals measured at Test- and Flow-Control lines. In addition, we observed that spiking of a fixed amount of IL-10 in individual sera showed quite some variability when IL-10 values were measured. This variability was also observed with the IL-10 ELISA and thus is not inherent to the UCP-LF assay. In the current study UCP-LF Ratio values were compared to the concentrations determined by ELISA. The validation of the assay through analysis of a set of banked clinical samples showed excellent quantitative correlation of UCP-LF IL-10 Ratio values with IL-10 concentration as determined by ELISA.
For leprosy, stimulation of PBMC or whole blood with M. leprae-derived antigens induces a ‘fingerprint’ of cytokines that may be used to specify the disease status. The current UCP-LF IL-10 assay is suited for cytokine multiplexing and different cytokines can be detected simultaneously on the same LF strip after addition of extra cytokine-specific Test lines. The UCP reporter then requires additional antibodies specific for the extra cytokines: one can opt to use a single UCP conjugate containing a mixture of the required cytokine antibodies, or (this study) one can use a mixture UCP conjugates each specific for one type cytokine. In the formulation of multiplex assays, the main issues are specificity (e.g. cross reactivity) of the antibody pairs and unexpected non-specific interactions. Proof of principle that our UCP-LF IL-10 assay is suitable for multiplexing was demonstrated by addition of IFN-γ as a second target. With a checkerboard experiment we showed that IL-10 and IFN-γ detection did not interfere with each other. Further optimization and integration of other cytokines is part of future research.
Accurate diagnosis of leprosy requires testing for cellular and humoral response markers to cover the complete immunological leprosy spectrum. To integrate cellular and humoral response testing in one assay, we have merged the UCP-LF IL-10 assay to a previously described antibody-generic UCP-LF test [27]. Merging comprised execution of the UCP-LF IL-10 assay with reduced volume, immediately followed by a wash step with assay buffer and a flow with an antibody generic protein-A coated UCP reporter to detect the human anti-PGL-I IgM antibodies. Theoretically binding of the protein-A label to mouse monoclonal IgGs on other assay components is possible but it was not observed in this assay format. RFU signals obtained with protein-A coated UCP particles were specific but relatively low; potentially a consequence of weak interaction of protein-A with human IgM antibodies. In future developments we will investigate UCP reporters coated with anti-IgM antibodies as more specific alternatives for protein-A. With the combined assay format, simultaneous detection of cytokine and antibody was successful.
In summary, we describe a robust, user-friendly and quantitative UCP-LF based assay for IL-10 detection in blood products with a lower complexity and significantly reduced assay time compared to our previous UCP-LF assay for IFN-γ detection. The assay format demonstrated its potential for simultaneous detection of multiple cytokines, as well as combination of cytokines and antibodies in a single sample on a single LF strip. These results permit further development of multiplex UCP-LF assays that can be applied to various (infectious) diseases where outcome of disease versus protection is determined by the (ratio of) production of cytokines by distinct T cell populations, or where the clinical disease spectrum is characterized by either high cellular- or humoral immune responses.
Acknowledgments
OraSure Technologies Inc. (Bethlehem, PA, US) is acknowledged for providing the up-converting phosphor reporter particles (400 nm UCP reporter particles). Dr. W.R Abrams (New York University College of Dentistry, New York, NY, US) is acknowledged for the art work of Fig. 1. Part of this work was funded by the U.S. National Institute of Health (NIH) grant UO1DE017855, the Netherlands Leprosy Relief Foundation (NLR; ILEP 702.02.65) and the Q.M. Gastmann-Wichers Foundation. LUMC and CSU are part of the IDEAL (Initiative for Diagnostic and Epidemiological Assays for Leprosy) Consortium.
ABBREVIATIONS
- CMI
cell mediated immunity
- HMI
humoral mediated immunity
- Ig
immunoglobulin
- IL
interleukin
- LF
lateral flow
- mAb
mouse monoclonal antibody
- pAb
polyclonal antibody
- PBMC
peripheral blood mononuclear cells
- PGL-I
phenolic glycolipid
- UCP
up-converting phosphor
Footnotes
Publisher's Disclaimer: This is a PDF file of an unedited manuscript that has been accepted for publication. As a service to our customers we are providing this early version of the manuscript. The manuscript will undergo copyediting, typesetting, and review of the resulting proof before it is published in its final citable form. Please note that during the production process errors may be discovered which could affect the content, and all legal disclaimers that apply to the journal pertain.
References
- 1.Ottenhoff TH, Verreck FA, Lichtenauer-Kaligis EG, et al. Genetics, cytokines and human infectious disease: lessons from weakly pathogenic mycobacteria and salmonellae. Nat Genet. 2002;32:97–105. doi: 10.1038/ng0902-97. [DOI] [PubMed] [Google Scholar]
- 2.Joosten SA, Ottenhoff TH. Human CD4 and CD8 regulatory T cells in infectious diseases and vaccination. Hum Immunol. 2008;69:760–70. doi: 10.1016/j.humimm.2008.07.017. [DOI] [PubMed] [Google Scholar]
- 3.Hasan Z, Jamil B, Khan J, et al. Relationship between circulating levels of IFN-gamma, IL-10, CXCL9 and CCL2 in pulmonary and extrapulmonary tuberculosis is dependent on disease severity. Scand J Immunol. 2009;69:259–67. doi: 10.1111/j.1365-3083.2008.02217.x. [DOI] [PubMed] [Google Scholar]
- 4.Corstjens PL, Zuiderwijk M, Tanke HJ, et al. A user-friendly, highly sensitive assay to detect the IFN-gamma secretion by T cells. Clin Biochem. 2008;41:440–4. doi: 10.1016/j.clinbiochem.2007.12.015. [DOI] [PMC free article] [PubMed] [Google Scholar]
- 5.Niedbala RS, Feindt H, Kardos K, et al. Detection of analytes by immunoassay using up-converting phosphor technology. Anal Biochem. 2001;293:22–30. doi: 10.1006/abio.2001.5105. [DOI] [PubMed] [Google Scholar]
- 6.Corstjens PL, van LL, Zuiderwijk M, et al. Up-converting phosphor technology-based lateral flow assay for detection of Schistosoma circulating anodic antigen in serum. J Clin Microbiol. 2008;46:171–6. doi: 10.1128/JCM.00877-07. [DOI] [PMC free article] [PubMed] [Google Scholar]
- 7.Mokkapati VK, Niedbala RS, Kardos K, et al. Evaluation of UPlink-RSV: Prototype rapid antigen assay for detection of respiratory syncytial virus infection. Ann N Y Acad Sci. 2007;1098:476–85. doi: 10.1196/annals.1384.021. [DOI] [PubMed] [Google Scholar]
- 8.Yan ZQ, Zhou L, Zhao YK, et al. Rapid quantitative detection of Yersinia pestis by lateral-flow immunoassay and up-converting phosphor technology-based biosensor. Sensors and Actuators B-Chemical. 2006;119:656–63. doi: 10.1016/j.snb.2006.01.029. [DOI] [PMC free article] [PubMed] [Google Scholar]
- 9.Corstjens P, Zuiderwijk M, Brink A, et al. Use of up-converting phosphor reporters in lateral-flow assays to detect specific nucleic acid sequences: a rapid, sensitive dna test to identify human papillomavirus type 16 infection. Clin Chem. 2001;47:1885–93. [PubMed] [Google Scholar]
- 10.Zuiderwijk M, Tanke HJ, Sam NR, Corstjens PL. An amplification-free hybridization-based DNA assay to detect Streptococcus pneumoniae utilizing the up-converting phosphor technology. Clin Biochem. 2003;36:401–3. doi: 10.1016/s0009-9120(03)00057-2. [DOI] [PubMed] [Google Scholar]
- 11.Corstjens PL, Chen Z, Zuiderwijk M, et al. Rapid assay format for multiplex detection of humoral immune responses to infectious disease pathogens (HIV, HCV, and TB) Ann N Y Acad Sci. 2007;1098:437–45. doi: 10.1196/annals.1384.016. [DOI] [PubMed] [Google Scholar]
- 12.Li L, Zhou L, Yu Y, et al. Development of up-converting phosphor technology-based lateral-flow assay for rapidly quantitative detection of hepatitis B surface antibody. Diagn Microbiol Infect Dis. 2009;63:165–72. doi: 10.1016/j.diagmicrobio.2008.10.020. [DOI] [PubMed] [Google Scholar]
- 13.Hampl J, Hall M, Mufti NA, et al. Upconverting phosphor reporters in immunochromatographic assays. Anal Biochem. 2001;288:176–87. doi: 10.1006/abio.2000.4902. [DOI] [PubMed] [Google Scholar]
- 14.Chegou NN, Black GF, Kidd M, van Helden PD, Walzl G. Host markers in QuantiFERON supernatants differentiate active TB from latent TB infection: preliminary report. BMC Pulm Med. 2009;9:21. doi: 10.1186/1471-2466-9-21. [DOI] [PMC free article] [PubMed] [Google Scholar]
- 15.Misra N, Selvakumar M, Singh S, et al. Monocyte derived IL 10 and PGE2 are associated with the absence of Th 1 cells and in vitro T cell suppression in lepromatous leprosy. Immunol Lett. 1995;48:123–8. doi: 10.1016/0165-2478(95)02455-7. [DOI] [PubMed] [Google Scholar]
- 16.Lima MC, Pereira GM, Rumjanek FD, et al. Immunological cytokine correlates of protective immunity and pathogenesis in leprosy. Scand J Immunol. 2000;51:419–28. doi: 10.1046/j.1365-3083.2000.00703.x. [DOI] [PubMed] [Google Scholar]
- 17.Jamil B, Shahid F, Hasan Z, et al. Interferon gamma/IL10 ratio defines the disease severity in pulmonary and extra pulmonary tuberculosis. Tuberculosis (Edinb ) 2007;87:279–87. doi: 10.1016/j.tube.2007.03.004. [DOI] [PubMed] [Google Scholar]
- 18.Verreck FA, de BT, Langenberg DM, van der ZL, Ottenhoff TH. Phenotypic and functional profiling of human proinflammatory type-1 and anti-inflammatory type-2 macrophages in response to microbial antigens and IFN-gamma- and CD40L-mediated costimulation. J Leukoc Biol. 2006;79:285–93. doi: 10.1189/jlb.0105015. [DOI] [PubMed] [Google Scholar]
- 19.Moraes MO, Pacheco AG, Schonkeren JJ, et al. Interleukin-10 promoter single-nucleotide polymorphisms as markers for disease susceptibility and disease severity in leprosy. Genes Immun. 2004;5:592–5. doi: 10.1038/sj.gene.6364122. [DOI] [PubMed] [Google Scholar]
- 20.Pereira AC, Brito-de-Souza VN, Cardoso CC, et al. Genetic, epidemiological and biological analysis of interleukin-10 promoter single-nucleotide polymorphisms suggests a definitive role for -819C/T in leprosy susceptibility. Genes Immun. 2009;10:174–80. doi: 10.1038/gene.2008.97. [DOI] [PubMed] [Google Scholar]
- 21.Britton WJ, Lockwood DN. Leprosy. Lancet. 2004;363:1209–19. doi: 10.1016/S0140-6736(04)15952-7. [DOI] [PubMed] [Google Scholar]
- 22.Ridley DS, Jopling WH. Classification of leprosy according to immunity. A five-group system. Int J Lepr Other Mycobact Dis. 1966;34:255–73. [PubMed] [Google Scholar]
- 23.Geluk A, Klein MR, Franken KL, et al. Postgenomic approach to identify novel Mycobacterium leprae antigens with potential to improve immunodiagnosis of infection. Infect Immun. 2005;73:5636–44. doi: 10.1128/IAI.73.9.5636-5644.2005. [DOI] [PMC free article] [PubMed] [Google Scholar]
- 24.Cho SN, Yanagihara DL, Hunter SW, Gelber RH, Brennan PJ. Serological specificity of phenolic glycolipid I from Mycobacterium leprae and use in serodiagnosis of leprosy. Infect Immun. 1983;41:1077–83. doi: 10.1128/iai.41.3.1077-1083.1983. [DOI] [PMC free article] [PubMed] [Google Scholar]
- 25.Groathouse NA, Amin A, Marques MA, et al. Use of protein microarrays to define the humoral immune response in leprosy patients and identification of disease-state-specific antigenic profiles. Infect Immun. 2006;74:6458–66. doi: 10.1128/IAI.00041-06. [DOI] [PMC free article] [PubMed] [Google Scholar]
- 26.Corstjens PLAM, Li S, Zuiderwijk M, et al. Infrared up-converting phophors for bioassays. IEE Proc Nanobiotechnol. 2005;152:62–72. doi: 10.1049/ip-nbt:20045014. [DOI] [PubMed] [Google Scholar]
- 27.Corstjens PL, van LL, Zuiderwijk M, et al. Up-converting phosphor technology-based lateral flow assay for detection of Schistosoma circulating anodic antigen in serum. J Clin Microbiol. 2008;46:171–6. doi: 10.1128/JCM.00877-07. [DOI] [PMC free article] [PubMed] [Google Scholar]


