

Abstract
The classification of synaptic inputs is an essential part of understanding brain circuitry. In the present study, we examined the synaptic properties of thalamic inputs to pyramidal neurons in layers 5a, 5b, and 6 of primary somatosensory (S1) and auditory (A1) cortices in mouse thalamocortical slices. Stimulation of the ventral posterior medial nucleus and the ventral division of the medial geniculate body resulted in three distinct response classes, two of which have never been described before in thalamocortical projections. Class 1A responses included synaptic depression and all-or-none responses, while Class 1B responses exhibited synaptic depression and graded responses. Class 1C responses are characterized by mixed facilitation and depression as well as graded responses. Activation of metabotropic glutamate receptors was not observed in any of the response classes. We conclude that Class 1 responses can be broken up into three distinct subclasses, and that thalamic inputs to the subgranular layers of cortex may combine with other, intracortical inputs to drive their postsynaptic target cells. We also integrate these results with our recent, analogous study of thalamocortical inputs to granular and supragranular layers (Viaene et al., 2011).
Introduction
Classification systems play an integral role in our understanding of the brain. In the thalamus, a classification of glutamatergic inputs has helped to expand our understanding of thalamic circuitry (for review, see Sherman and Guillery, 1998, 2006; Guillery and Sherman, 2002). Recently, the classification of glutamatergic inputs has been extended to thalamocortical (Lee and Sherman, 2008; Viaene et al., 2011) and corticocortical (Covic and Sherman, 2011) pathways.
In the case of thalamocortical pathways, previous work has shown that thalamic input to layer 4 of S1 and A1 is functionally distinct from that to layers 2/3 (Viaene et al., 2011). Specifically, the input to layer 4 of cortex strongly resembles driver (or Class 1) input seen in the thalamus, indicating that these projections are likely to be transmitting receptive field-defining information from thalamus to cortical layer 4. On the other hand, the majority of thalamic input to layers 2/3 resembles modulator (or Class 2) input in the thalamus. This suggests that thalamus is doing more than simply relaying sensory information because some thalamocortical inputs may be modulatory in nature.
Though the thalamic inputs to layers 4 and 2/3 have been classified, previous studies that examined thalamic projections to the subgranular layers of cortex have not provided a systematic classification of these inputs (Ahissar et al., 2000; Porter et al., 2001; Beierlein and Connors, 2002; Swadlow et al., 2002; Bureau et al., 2006; Tan et al., 2008; Zhou et al., 2010). In the present study, we aimed to extend the classification of thalamocortical projections to layers 5a, 5b, and 6 of both S1 and A1. We found three distinct classes of thalamic input to the subgranular layers of cortex, all of which appear to be subtypes of previously described Class 1 projections (Covic and Sherman, 2011; Viaene et al., 2011).
Materials and Methods
Slice preparation.
All procedures were approved by the Institutional Animal Care and Use Committee of the University of Chicago. BALB/c mice of either sex (age 9–20 d postnatal) were anesthetized with isoflurane and decapitated. Brains were rapidly removed and placed in a chilled (0–4°C), oxygenated (95% O2, 5% CO2) solution containing the following (in mm): 2.5 KCl, 1.25 NaH2PO4, 10 MgCl2, 0.5 CaCl2, 26 NaHCO3, 11 glucose, and 206 sucrose. Thalamocortical slices (500 μm thick) were prepared as previously described (Agmon and Connors, 1991; Cruikshank et al., 2002). Briefly, somatosensory slices were prepared by blocking the brain at a 55° angle from the midsagittal plane and then gluing the blocked side onto a vibratome platform (Leica) and against a block of agar for slicing. The auditory slices were prepared by blocking the brain at a 25° angle rostrocaudally from the dorsal surface. The blocked side was placed facing down and a 15° off-horizontal cut was made along the mediolateral plane. This blocked surface was glued onto the vibratome platform, next to a block of agar, for sectioning. Following sectioning, slices were placed in warm (32°C), oxygenated artificial CSF containing (in nm) 125 NaCl, 3 KCl, 1.25 NaH2PO4, 1 MgCl2, 2 CaCl2, 25 NaHCO3, and 25 glucose, for a minimum of 30 min before being used. While in the recording chamber, slices were continuously perfused with oxygenated ACSF at room temperature.
Flavoprotein autofluorescence imaging.
For some experiments, we used flavoprotein autofluorescence (FA) imaging (Llano et al., 2009) to confirm and assess the connectivity of the slices. When blue light (472–488 nm) is shined on a slice, FA measures green light (520–560 nm) emitted by mitochondrial flavoproteins during periods of increased cellular metabolic activity (Shibuki et al., 2003; Llano et al., 2009). FA was performed using a QImage Retiga-SRV camera (QImaging) attached to a fluorescent light-equipped microscope (Axioscop 2FS, Carl Zeiss Instruments). For each trial, FA activity was monitored over the whole slice for a total of 14 s, including 1.5 s before stimulation [10 pulses at 20 Hz and 150 –300 μA, over the ventral posterior medial nucleus (VPM) or the ventral division of the medial geniculate body (MGBv) using a concentric bipolar electrode (FHC)] and 12 s after stimulation. FA images were obtained at 2.5–10 frames/s (integration time of 100–400 ms). The final FA image was generated as a function of the Δf/f ratio of the baseline autofluorescence of the slice before stimulation subtracted from the autofluorescence of the slice over the period of stimulation (Δf) divided by baseline (f). Bright-field images of the slices were overlaid on the FA images for the identification of cortical layers and other relevant brain structures.
Electrophysiology.
Current-clamp and voltage-clamp mode whole-cell recordings were performed in a visualized slice setup under a DIC-equipped microscope and with a Multiclamp 700B amplifier and pCLAMP software (Molecular Devices). Recording glass pipettes with input resistances ranging between 3 and 7 MΩ were filled with intracellular solution containing (in mm) 117 K-gluconate, 13 KCl, 1 MgCl2, 0.07 CaCl2, 10 HEPES, 0.1 EGTA, 2 Na2-ATP, 0.4 Na-GTP, and 0.02% biocytin; pH 7.3, 290 mOsm. In addition, our intracellular solution included TS-TM calix[4]arene (0.003 mm), a chloride channel blocker (generously provided by Professor R. J. Bridges of Rosalind Franklin University) to block the inhibitory effects of GABAA receptors on the recorded cell (Dudek and Friedlander, 1996). Individual cortical layers (layers 5a, 5b, and 6) were identified by the marked differences in their brightness under DIC. We avoided transition zones at the borders of layers to reduce the risk of misidentifying laminar locations. VPM and MGBv were easily identified by their shapes and differences in brightness from the surrounding thalamic tissue (e.g., Fig. 5 of Lee and Sherman, 2008). Electrical stimulation of the thalamocortical pathways was delivered through a concentric bipolar electrode, which carries the advantage of delivering current to a relatively restricted tissue area. Short-term plasticity (paired-pulse depression vs paired-pulse facilitation) was assessed using a stimulation protocol consisting of four 0.1-ms-long positive current pulses at a frequency of 10 Hz. Paired-pulse effects were examined using the lowest stimulation intensity capable of inducing EPSPs of a >0.5 mV amplitude (for at least 3 of the 4 EPSPs) in the recorded cells. Higher stimulation intensities were used for some experiments to assess the effects of increased stimulation currents on evoked responses (see Results). In these experiments, we measured the relationship between stimulation intensity and the amplitude of the evoked EPSPs by using an initial stimulation intensity of 25 μA (which typically was within 25–35 μA of the threshold for evoking a synaptic response in each cell) and gradually increasing the stimulation intensity in increments of 25 or 50 μA. High-frequency stimulation (0.1-ms-long pulses delivered at 125 Hz over 200–500 ms, 100 –300 μA) was used for the assessment of metabotropic glutamate receptor (mGluR) activation (McCormick and von Krosigk, 1992). To isolate any metabotropic responses, NMDA and AMPA receptor antagonists (AP5, 100 μm and DNQX, 50 μm, respectively) were applied to the ACSF during high-frequency stimulation trials. All data were digitized on a Digidata 1200 board (Molecular Devices) and stored on a computer for off-line analysis. Measurement and analyses of the acquired traces were performed in ClampFit (Molecular Devices) software. Latency was measured as the time between stimulation offset and the beginning of the evoked EPSP. We calculated the E2/E1 ratio by dividing the amplitude of the second evoked EPSP by the amplitude of the first. An E2/E1 ratio of >1 indicates paired-pulse facilitation, whereas an E2/E1 ratio of <1 indicates paired-pulse depression. We also calculated the E3/E2 ratio by dividing the amplitude of the third evoked EPSP by the amplitude of the second. To assess the consistency of facilitation or depression across a stimulation train, we divided the E2/E1 ratio by the E3/E2 ratio. Rise times of recorded first EPSPs were measured as the time between the onset of the evoked EPSP and the maximum EPSP amplitude at the stimulation intensity used to assess paired-pulse effects and first EPSP amplitude for each recorded neuron. The rise times for each neuron were measured for each of 10 trials at this stimulation intensity and then averaged to give an overall rise time for the cell. The laminar position of the recorded cells in layers 5a, 5b, and 6 was determined by using bright-field images of the slices taken during recording and by measuring the radial distance of the cell from the white matter. The spike frequency adaptation index was calculated as follows:
where τ = interspike interval. IH was calculated as follows:
 |
where Vpeak was measured as the most negative recorded potential in the first 200 ms of negative current injection, and Vplateau is the steady-state voltage measured in the last 200 ms of the negative current injection.
Figure 5.

Response latencies and laminar positions. A, Mean ± SEM of response latencies across layers 5a, 5b, and 6 in S1 and A1. B, Mean ± SEM of response latencies within each response class for neurons in S1 and A1. C, Laminar position (measured as the distance from the white matter) for neurons with Class 1A, 1B, and 1C responses in S1. D, Laminar position (measured as the distance from the white matter) for neurons with Class 1A, 1B, and 1C responses in A1. Horizontal spread of points in C and D is purely to enhance viewing of individual data points.
Glutamate photo-uncaging.
We added nitroindolinyl-caged glutamate (Sigma-Aldrich) to the recirculating ACSF (0.4 mm final concentration). A UV laser beam (DPSS Lasers) was used to focally photolyse the caged compound over the tissue on an 8 × 8 grid in a pseudorandom order that reduced the possibility of stimulating adjacent spots sequentially and thus locally depleted caged glutamate (Shepherd et al., 2003; Lam and Sherman, 2005, 2007; Lam et al., 2006). The laser beam had an intensity of 20–80 mW, and laser illumination lasted 2–5 ms (355 nm wavelength, frequency-tripled Nd: YVO4, 100 kHz pulse repetition rate). A custom-made software written in Matlab (MathWorks) developed in the laboratory of Karel Svoboda (Shepherd et al., 2003) was used to control the uncaging interface.
Histology.
Following the electrophysiology experiments, slices were preserved in 4% paraformaldehyde in PBS until processed to recover the biocytin-filled recorded cells. The following protocol was used for biocytin processing: Slices were washed for 15 min in 0.5% H2O2, and were then treated with three 10 min washes in PBS and a 5 min wash in 0.3% Triton-X, and were finally incubated overnight with ABC reagent (Vectastain ABC Peroxidase Kit, Vector). On the next day, following two 15 min washes in PBS and two 10 min washes in Tris-buffered saline, sections were bathed briefly in diaminobenzidine (DAB, SigmaFast, Sigma-Aldrich) to visualize the label. Finally, the processed brain sections were mounted onto gelatinized slides, dehydrated, and coverslipped.
Results
FA and glutamate uncaging
Slice connectivity was assessed using FA imaging. Electrical stimulation of VPM in the somatosensory thalamocortical slice resulted in the activation of S1 (including layers 5a, 5b, and 6), shown as increased FA signal in Figure 1A. Likewise, electrical stimulation of MGBv in the auditory thalamocortical slice produced FA activation in all layers of A1 (Fig. 1B).
Figure 1.
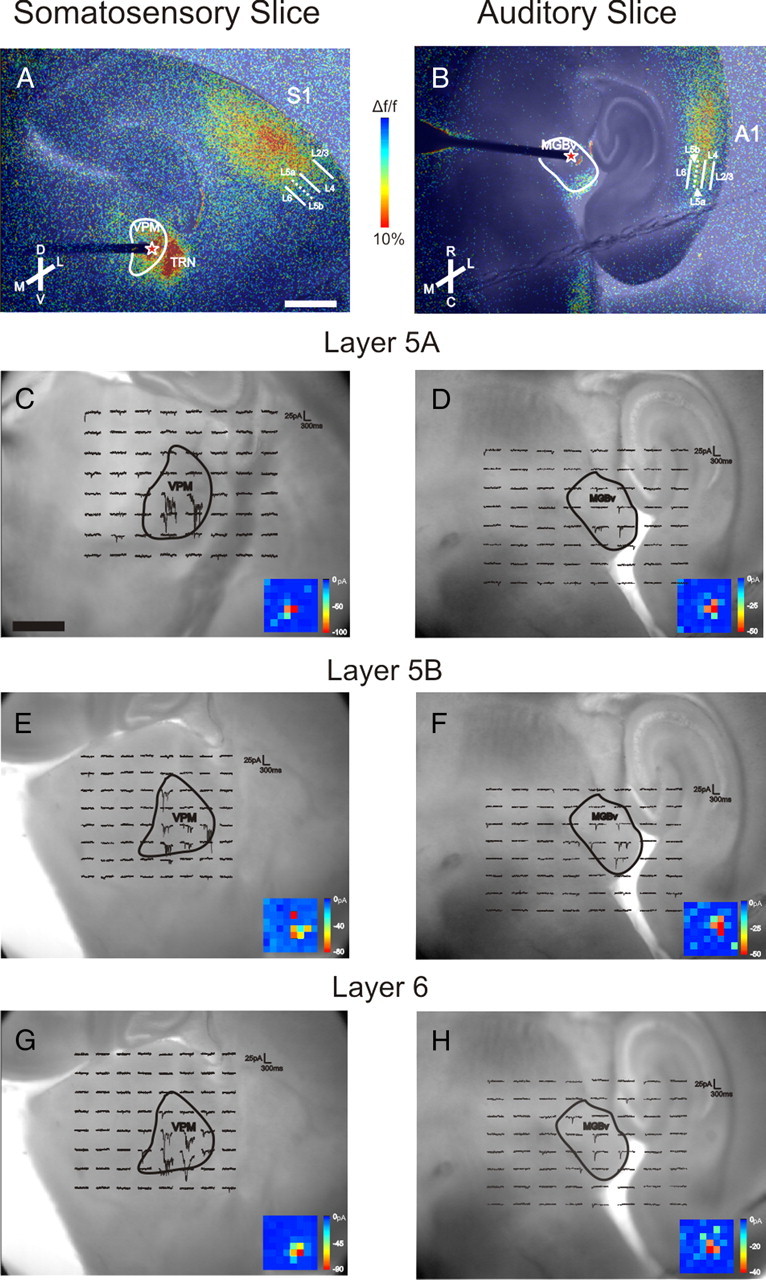
Slice connectivity confirmed using FA imaging and photo-uncaging of glutamate. A, Electrical stimulation (20 Hz, 150 μA) in VPM resulted in FA activation across S1, including layers 5a, 5b, and 6. B, Electrical stimulation (20 Hz, 150 μA) in MGBv resulted in FA activation in A1, including layers 5a, 5b, and 6. Red stars in A and B represent the site of electrical stimulation in thalamus. Color scale represents the percentage Δf/f change in fluorescence. C–H, Examples of inward currents recorded from neurons in layers 5a (C), 5b (E), and 6 (G) of S1 while photo-uncaging glutamate over VPM, and examples of inward currents recorded from neurons in layers 5a (D), 5b (F), and 6 (H) of A1 while photo-uncaging glutamate over MGBv. Insets, False-color maps of location and magnitude of inward currents. Each pixel corresponds to a locus of uncaging as seen in the main figure. The size of the 8 × 8 grid varied between slices and was set manually by the experimenter to maximize the number of stimulation sites in the thalamic nucleus of interest and in the surrounding tissue to serve as a control. Generally, the grid was set so that adjacent stimulation sites were ∼175–250 μm apart. TRN, Thalamic reticular nucleus; M, medial; L, lateral; D, dorsal; V, ventral; R, rostral; C, caudal; L2/3, layers 2/3; L4, layer 4; L5a, layer 5a; L5b, layer 5b; L6, layer 6. Scale bars: (in A) A, B, 1 mm; (in C) C–H, 500 μm.
As electrical stimulation during FA imaging runs could have potentially activated axons (either antidromically or axons of passage) as well as cell bodies, the laser uncaging of glutamate was implemented to demonstrate that input from VPM and MGBv could activate neurons in the subgranular layers of cortex. Slices were bathed in caged glutamate and voltage-clamp responses were recorded from neurons in layers 5a, 5b, and 6 of both S1 and A1 while photostimulating over VPM and MGBv, respectively. Inward currents were recorded from cells of layers 5a, 5b, and 6 of S1 within 4–7 ms following photostimulation of the dorsalateral region of VPM (Fig. 1C,E,G). In A1, inward currents were recorded from cells in the subgranular layers within 5–10 ms of photostimulation of the lateral aspect of MGBv (Fig. 1D,F,H). These latencies are consistent with monosynaptic activation. To minimize potentially activating inappropriate axons, electrical stimulating electrodes were targeted to the sites of photostimulation that evoked the largest response in the recorded cortical neuron. All subsequent experiments described were performed using electrical stimulation.
Thalamocortical response classes
We recorded from a total of 103 neurons in S1 (41 in layer 5a, 29 in layer 5b, and 33 in layer 6). Of these neurons, 77 (30 in layer 5a, 24 in layer 5b, and 23 in layer 6) exhibited EPSPs deemed to be monosynaptic in response to electrical stimulation of VPM. In A1, 30 (10 in layer 5a, 10 in layer 5b, and 10 in layer 6) of 73 (26 in layer 5a, 19 in layer 5b, and 28 in layer 6) recorded cells responded likewise to electrical stimulation of MGBv with EPSPs. Only the subset of connected cells will be referred to henceforth.
Layer 5a cells of S1 had a membrane potential of −58.65 ± 6.78 (SD) mV, uncorrected for an approximately −10 mV junction potential, and an input resistance of 486.4 ± 145.4 MΩ. Layer 5a cells of A1 had an uncorrected membrane potential of −62.10 ± 6.64 mV and an input resistance of 486.0 ± 188.8 MΩ. Neurons in layer 5b of S1 had an average uncorrected membrane potential of −57.55 ± 7.09 mV and an input resistance of 404.2 ± 150.1 MΩ, while layer 5b neurons in A1 had an average uncorrected membrane potential of −61.00 ± 6.38 mV and an input resistance of 363.9 ± 112.5 MΩ. In S1, layer 6 neurons had an uncorrected membrane potential of −58.79 ± 6.60 mV and an input resistance of 441.8 ± 120.5 MΩ, while those in A1 had an average uncorrected membrane potential of −62.40 ± 7.62 mV and an input resistance of 423.9 ± 135.3 MΩ.
We conclude that all recorded cells in both S1 and A1 were pyramidal in nature. We visually identified pyramidal neurons for recording on the basis of their size and shape, as well as the presence of an apical dendrite. Current injection was used to look for the presence of IH (negative current) and spike frequency adaptation (positive current). Additionally, all recovered biocytin-filled cells were pyramidal (n = 42). All recorded neurons exhibited spike frequency adaption and IH. No significant differences were observed in the intrinsic properties of cells with different response classes (Table 1 and see below for description of response classes).
Table 1.
Summary of intrinsic properties of cells with Class 1A, 1B, and 1C responses
| Class 1A | Class 1B | Class 1C | p value | |
|---|---|---|---|---|
| Resting potential (mV) | −59.84 ± 6.82 | −59.31 ± 6.29 | −58.47 ± 7.49 | 0.70 |
| Input resistance (MΩ) | 454.7 ± 130.8 | 478.5 ± 151.3 | 412.3 ± 147.9 | 0.30 |
| Spike frequency adaptation index | −4.39 ± 7.83 | −3.72 ± 6.20 | −1.98 ± 3.10 | 0.23 |
| IH (pA) | 18.98 ± 13.51 | 21.89 ± 8.76 | 24.65 ± 17.88 | 0.31 |
| n | 47 | 14 | 31 |
All data are represented as mean ± SD. p values were calculated using Kruskal–Wallis tests.
Three distinct classes of responses were observed in the subgranular layers of S1 and A1 in response to trains of electrical stimulation in thalamus. The first type of response, which we will term Class 1A, has been observed previously both in the thalamus and cortex and had been referred to then simply as Class 1 (Viaene et al., 2011) or as a Driver response pattern (Reichova and Sherman, 2004; Lee and Sherman, 2008, 2010; Petrof and Sherman, 2009). Differences between responses with Class 1 properties suggest the possibility of further subdivision within this group, and so we have adopted the terminology here of “Class 1A,” “Class 1B,” and “Class 1C.” Cells with Class 1A responses exhibited pure depression in response to thalamic stimulation that was consistent across several different frequencies of stimulation (Fig. 2A,D). The Class 1A response was evoked in an all-or-none manner, meaning that EPSP amplitude reached its maximum value at low stimulation intensities and further increases in stimulation intensity did not result in an increase in EPSP amplitude (Fig. 2A). EPSPs evoked with 10 Hz stimulation could be blocked by ionotropic glutamate receptor antagonists (AP5 and DNQX), and in the presence of these antagonists, high-frequency stimulation of thalamus failed to activate metabotropic glutamate receptors on cells exhibiting Class 1A responses (Fig. 2A).
Figure 2.

Examples of Class 1A, 1B, and 1C responses. A, Class 1A response pattern. Upper trace shows response to various intensities of thalamic stimulation. Middle trace shows the absence of a response following thalamic stimulation at 200 μA in the presence of ionotropic receptor antagonists (DNQX and AP5). Lower trace shows the absence of metabotropic glutamate receptor activation following high-frequency stimulation of thalamus at 200 μA in the presence of DNQX and AP5. B, Class 1B response pattern. Upper trace shows response to various intensities of thalamic stimulation. Middle trace shows the absence of a response following thalamic stimulation at 200 μA in the presence of ionotropic receptor antagonists (DNQX and AP5). Lower trace shows the absence of metabotropic glutamate receptor activation following high-frequency stimulation of thalamus at 200 μA in the presence of DNQX and AP5. C, Class 1C response pattern. Upper trace shows response to various intensities of thalamic stimulation. Middle trace shows the absence of a response following thalamic stimulation at 200 μA in the presence of ionotropic receptor antagonists (DNQX and AP5). Lower trace shows the absence of metabotropic glutamate receptor activation following high-frequency stimulation of thalamus at 200 μA in the presence of DNQX and AP5. D, Examples Class 1A responses to different stimulation frequencies at 150 μA in current clamp (left column) and voltage clamp (right column). The value of the ISI is shown to the left and these values for each row apply as well to E and F. E, Example Class 1B responses to different stimulation frequencies at 150 μA in current clamp (left column) and voltage clamp (right column). F, Example Class 1C responses to different stimulation frequencies at 150 μA in current clamp (left column) and voltage clamp (right column). Arrows represent timing of stimulation for all low-frequency stimulation trials. Black bars represent the duration of stimulation in high-frequency stimulation trials. With the exception of high-frequency stimulation trials, all traces represent the average of 10 sweeps.
A second response class was observed in pyramidal neurons of layers 5a, 5b, and 6 in S1 and A1, which we term Class 1B. This response class has been previously reported in corticocortical pathways (Covic and Sherman, 2011). The Class 1B response pattern resembles the Class 1A pattern in that these cells responded to thalamic stimulation with depression across several stimulation frequencies and showed no evidence of a metabotropic glutamate receptor response component (Fig. 2B,E). However, unlike the Class 1A response, cells with Class 1B responses showed a graded response pattern meaning that the amplitude of the evoked EPSPs increased gradually as stimulation intensity was increased (Fig. 2B).
The third and final response class observed in the recorded neurons will be referred to as Class 1C. Class 1C responses exhibited mixed depression and facilitation in response to thalamic stimulation that was consistent across stimulation frequencies and intensities (Figs. 2C,F, 3A,B). Specifically, these cells showed facilitation between the first two evoked EPSPs that switched to depression for the subsequent EPSPs. Increases in stimulation intensity caused increases in the amplitude of the evoked EPSPs for Class 1C responses (Fig. 2C). As with the Class 1A and 1B response patterns, no evidence of a metabotropic glutamate receptor response component was seen (Fig. 2C).
Figure 3.
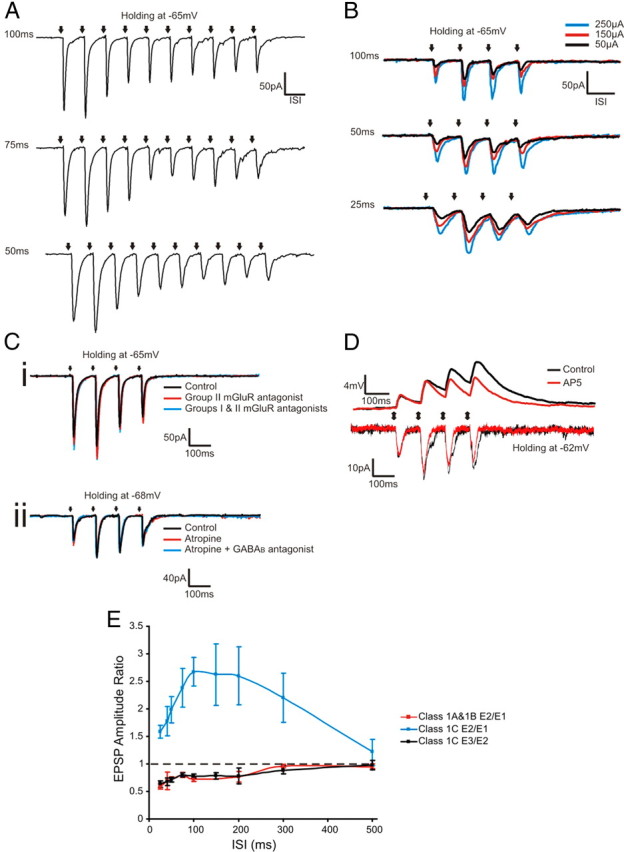
Properties of Class 1C responses. A, Voltage-clamp responses to a train of 10 pulses at various stimulation frequencies (200 μA). The ISI is shown to the left of each trace. B, Voltage-clamp responses at different stimulation intensities and frequencies, and the ISI shown to the left of each trace. Ci, Voltage-clamp responses under control conditions and following bath application of MPPG (Group II metabotropic glutamate receptor antagonist) and MPPG, LY367385, and MPEP (together, LY367385 and MPEP inhibit Group I metabotropic glutamate receptors). Cii, Voltage-clamp responses under control conditions and following bath application of atropine (muscarinic acetylcholine receptor antagonist) and atropine plus CGP 46381 (a GABAB receptor antagonist). D, Voltage-clamp and current-clamp responses during control conditions and following bath application of AP5. E, Changes in EPSP amplitude ratios of the second to first EPSP (E2/E1) or third to second (E3/E2) across stimulation frequencies, showing the mean ± SEM. Black arrows represent the timing of stimulation. All traces in A–D represent averages of 10 sweeps.
A response pattern of mixed facilitation and depression has been observed before in the hippocampus (Dittman et al., 2000; Losonczy et al., 2002; Sun et al., 2005) and in GABAergic synapses of rat somatosensory cortex (Gupta et al., 2000). However, such a mixed response pattern has never been described for thalamocortical projections, and therefore, we performed subsequent experiments to better characterize the Class 1C response (Fig. 3). As noted, facilitation was present between the first two EPSCs, but further EPSCs in the train showed depression in response to low-frequency stimulation of thalamus (Fig. 3A). This pattern was consistent across varied stimulation intensities and stimulation frequencies (Fig. 3B). To investigate whether the observed depression was due to activation of metabotropic glutamate receptors on the terminals of the presynaptic neuron, metabotropic glutamate receptor antagonists (LY367385, 40 μm; MPEP, 30 μm; MPPG, 300 μm) were applied to the bath. No changes in the response pattern were observed in cells with Class 1C responses (n = 6) following this procedure (Fig. 3Ci). Previous studies have shown that activation of muscarinic acetylcholine receptors can strongly modulate thalamocortical transmission (Metherate and Ashe, 1993) and that activation of presynaptic GABAB receptors can alter EPSP amplitude and paired-pulse effects in S1 (Gil et al., 1997). To assess whether muscarinic acetylcholine receptors play a role in Class 1C responses, atropine (1 μm) was added to the bath. No changes in EPSCs were observed (n = 4, Fig. 3Cii). We then tested the effects of GABAB receptor blockade by adding CGP 46381 (GABAB receptor antagonist, 25 μm) to the bath, and again, the recorded EPSCs were unaffected (n = 4, Fig. 3Cii). We also investigated the effect of NMDA receptor activation on the Class 1C responses (Fig. 3D). The addition of AP5 to the bath (NMDA receptors antagonist, 100 μm) reduced EPSC amplitude by an average of 11.24 ± 8.34% and decreased EPSC half-width by an average of 18.27 ± 11.57%. The first EPSC amplitude was affected least by AP5 application (6.41% average amplitude reduction for the first EPSC vs 8.18%, 14.48%, and 15.90% for the second, third, and fourth EPSCs, respectively). Likewise, the half-width of the first EPSC was the least affected by AP5 (11.87% average half-width reduction for the first EPSC vs 22.17%, 15.56%, and 23.47% for the second, third, and fourth EPSCs, respectively). Though the recorded EPSCs were larger and broader during control conditions, the overall pattern of the response was not changed when AP5 was added to the bath (n = 5: 2 cells from layer 5a of S1, and one cell each from layers 5B of S1, 6 of S1, and 5a of A1; Fig. 3D). Finally, we looked at the relationship between the E2/E1 ratio and the interstimulus interval (ISI) for cells with Class 1C responses. The E2/E1 ratio of cells exhibiting pure facilitation has been shown to increase exponentially as ISI is decreased (Dittman et al., 2000; Sun et al., 2005). Though Class 1C cells exhibit facilitation between the first two EPSCs, the relationship between their E2/E1 ratio and the ISI does not follow the same pattern as cells exhibiting pure facilitation (Fig. 3E). As ISI is increased, the E2/E1 ratio of cells with Class 1C responses increases, until it reaches a maximum around a 100–200 ms ISI, after which the E2/E1 decreases with increased ISI (Fig. 3E). This same relationship between EPSC amplitude ratio and ISI has been observed in other cells exhibiting mixed facilitation and depression (Dittman et al., 2000). When the E3/E2 ratio of cells with Class 1C responses is plotted versus ISI, an exponential increase is seen in the E3/E2 as ISI is increased (Fig. 3E). The same pattern was observed for the E2/E1 of cells with Class 1A and 1B responses (Fig. 3E) and is consistent what has been previously reported for other cells exhibiting pure depression (Dittman et al., 2000; Sun et al., 2005; for review, see Zucker and Regehr, 2002).
Population data
All three classes of responses were observed in layers 5a, 5b, and 6 of both S1 and A1; however, the proportions of pyramidal neurons exhibiting each response class varied between layers (Fig. 4A,B). Similar distributions of responses classes were observed in S1 (Fig. 4A) and A1 (Fig. 4B). In layer 5a, Class 1C responses were most common though the percentages of cells exhibiting each response class were most equally distributed when compared to layers 5b and 6. In layer 5b, Class 1A and 1C responses were much more common than Class 1B, and in layer 6, Class 1A responses dominated; this is consistent with results seen in Beierlein and Connors (2002), where thalamic inputs to layer 6 of S1 showed paired-pulse depression.
Figure 4.
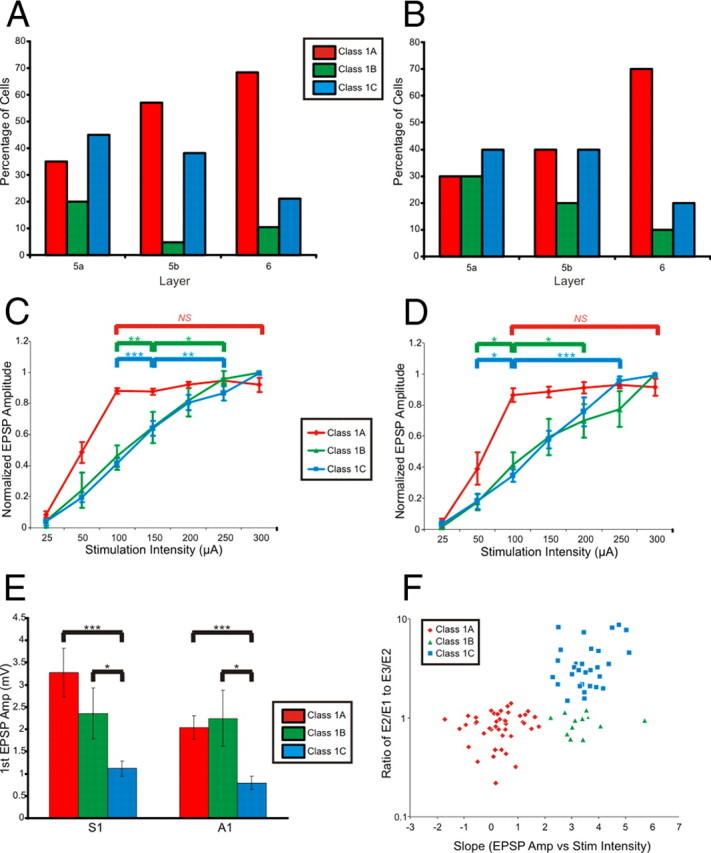
Summary of response properties. A, Proportions of cells with Class 1A, 1B, and 1C response properties in the subgranular layers of S1. B, Proportions of cells with Class 1A, 1B, and 1C response properties in the subgranular layers of A1. C, Relationship between normalized EPSP amplitude and stimulation intensity for cells with Class 1A, 1B, and 1C responses in S1. D, Relationship between normalized EPSP amplitude and stimulation intensity for cells with Class 1A, 1B, and 1C responses in A1. E, Mean ± SEM of first EPSP amplitudes at minimal stimulation intensity. F, Scatter plot of the amplitude ratios of the second to first EPSP (E2/E1) divided by the third to second (E3/E2) versus the slope of the normalized EPSP amplitude versus stimulation intensity (for stimulation intensities 100 μA and above). Error bars are SEM. *p < 0.05, **p < 0.01, ***p < 0.001; NS, not significant.
Cells with Class 1B and Class 1C responses of both S1 and A1 showed a protracted region of monotonic increases in EPSP amplitude as stimulation intensity was increased (Fig. 4C,D; Kruskal–Wallis: S1 Class 1B, p < 0.05; S1 Class 1C, p < 0.001; A1 Class 1B, p < 0.001; A1 Class 1C, p < 0.001; see Fig. 4 for multiple contrasts). On the other hand, for cells with Class 1A responses of S1 and A1, once stimulation intensity reached a certain threshold (between 50 and 100 μA for most cells), further increases in stimulation intensity did not result in further increases in EPSP amplitude (Fig. 4C,D; Kruskal–Wallis: S1, p = 0.15; A1, p = 0.71).
The amplitudes of the first EPSPs evoked at minimum stimulation intensity are shown for each of the three responses classes in Figure 4E. In both S1 and A1, cells exhibiting Class 1A and 1B responses had significantly larger first EPSP amplitudes than did cells with Class 1C responses (Mann–Whitney: S1 Class 1A, p < 0.001; S1 Class 1B, p < 0.05; A1 Class 1A, p < 0.001; A1 Class 1B, p < 0.05).
The three responses classes could be distinguished from each other using a few of the criteria we tested. The ratio of the E2/E1 to the E3/E2 is plotted versus the slope of the normalized EPSP amplitude versus stimulation intensity (100 μA and above) for the recorded neurons in Figure 4F. Neurons with Class 1A responses had small slopes (due to their all-or-none response pattern) and a ratio of E2/E1 to E3/E2 of near 1. Cells with Class 1B responses had larger slopes (due to their graded activation profile) and had a ratio of E2/E1 to E3/E2 of near 1. Finally, cells exhibiting Class 1C responses had larger slopes (due to a graded activation profile) and a larger ratio of E2/E1 to E3/E2 [due to the facilitation between the first two EPSPs (E2/E1 ratio >1) and depression between the second and third EPSPs (E3/E2 ratio <1)].
Response latency was analyzed for the recorded neurons in layers 5a, 5b, and 6 of S1 and A1 (Fig. 5A). Response latencies for each recorded neuron varied by <0.5 ms across all trials. Though the response latency was slightly longer on average for neurons in layer 5b, no significant differences were observed between layers of S1 or A1 (Kruskal–Wallis: S1, p = 0.40; A1, p = 0.46). Response latencies were larger in A1 than in S1, a trend that has been reported for cells in layers 2/3 and 4 (Viaene et al., 2011). Given that the response latency of the recorded neurons did not significantly vary with location, we examined response latencies across the three different response classes (Fig. 5B). No significant differences in response latency were observed across the different responses classes for neurons in S1 or A1 (Kruskal–Wallis: S1, p = 0.46; A1, p = 0.98).
We examined the laminar position of the recorded neurons in S1 and A1 to look for any correlations between the location of the neuron and response class (Fig. 5C,D). The three response classes were found in neurons throughout layers 5a, 5b, and 6 and no correlation between laminar position and type of response was apparent.
We also examined rise times of the recorded EPSPs. Individual rise times varied by <1 ms from the average rise time for each cell, and average rise times were not significantly different between cells of S1 and A1 (13.51 ± 5.46 ms for S1, n = 60;14.31 ± 5.37 ms for A1, n = 30, Mann–Whitney: p = 0.51). Additionally, no significant differences in average rise times were observed between cells with different response classes (13.37 ± 5.88 ms for cells with Class 1A responses, n = 46; 14.62 ± 5.19 ms for cells with Class 1B responses, n = 13; 14.02 ± 4.88 ms for cells with Class 1C responses, n = 31; Kruskal–Wallis: p = 0.73), and there was variability in rise times seen within each of the three classes (see examples in Fig. 3). However, average rise times of EPSPs were significantly different across layers of cortex. Average rise times were measured to be 14.11 ± 5.06 ms in layer 5a (n = 30), 15.15 ± 5.30 ms in layer 5b (n = 31), and 11.57 ± 5.30 ms in layer 6 (n = 29). Rise times were not significantly different between layers 5a and 5b (Mann–Whitney: p = 0.29), while average EPSP rise times were significantly shorter in layer 6 than in layer 5a (Mann–Whitney: p < 0.05) and layer 5b (Mann–Whitney: p < 0.01).
Review of thalamocortical projections
All responses recorded in the subgranular layers of S1 and A1 were found to be Class 1 in nature and each layer included all three subclasses of this type of response (1A, 1B, 1C). Previous work found that all input to layer 4 of S1 and A1 was Class 1A in nature (Lee and Sherman, 2008; Viaene et al., 2011). However, the input to layers 2/3 of S1 and A1 is predominantly Class 2 (Viaene et al., 2011). The properties of these different classes of response are shown in Figure 6. All types of Class 1 responses can be distinguished from Class 2 responses by the presence or absence of a metabotropic glutamate receptor component (Class 1 responses lack this component). Class 2 and Class 1C responses have an E2/E1 ratio >1 while Class 1A and 1B have an E2/E1 ratio <1. Finally, Class 1A and 1B responses have larger first EPSP amplitudes while Class 1C have the next largest. Class 2 responses have the smallest first EPSP amplitudes of all the response classes.
Figure 6.

Three-dimensional scatter plot of all thalamocortical response properties seen in excitatory neurons of S1 and A1. Response properties include first EPSP amplitude at minimal stimulation intensity, the ratio of the second to first EPSP amplitude (E2/E1), and peak metabotropic glutamate receptor response, defined as the largest deflection from baseline in millivolts during the period of 0.25–2 s following high-frequency stimulation. Colors distinguish different neuron locations (i.e., supragranular vs subgranular layers) and shapes distinguish different response classes.
For thalamocortical inputs to excitatory neurons in S1 and A1, the different classes of response and the proportions of each response type within each layer of cortex are shown in Figure 7. Class 1A responses can be found in all layers of cortex. Neurons of layer 4 exhibit only Class 1A responses (Lee and Sherman, 2008; Viaene et al., 2011). Layers 2/3 neurons show both Class 1A and Class 2 response patterns. The responses in layers 2/3 are predominantly Class 2, and layers 2/3 are the only layers of cortex where pyramidal neurons exhibiting Class 2 responses following thalamic stimulation have been described (Viaene et al., 2011). Neurons of layers 5a, 5b, and 6 all exhibit the three subtypes of Class 1 responses. Layer 5a has similar amounts of Class 1A, 1B, and 1C response patterns whereas layer 5b exhibits mainly Class 1A and 1C. Finally, the majority of layer 6 neurons exhibit Class 1A responses.
Figure 7.

Schematic representation of first-order thalamic inputs to excitatory neurons of primary sensory cortex. Within each layer, line thickness and symbol size represent the percentage of each response class seen in that layer. This figure does not show the location of the synaptic inputs responsible for each response class (i.e., for pyramidal cells with apical dendrites spanning many layers dorsally, the actual laminar location of the synaptic input cannot be specified). Though this figure shows four unique projections originating in thalamus, it is not meant to imply that four distinct classes of cells are responsible for each of these response classes; the precise origins of the inputs responsible for each class of response are currently unknown.
Discussion
Stimulation of VPM and MGBv produced very similar responses in pyramidal cells of layers 5a, 5b, and 6 of S1 and A1, respectively. We observed three distinct classes of responses, two of which were previously unreported for thalamocortical projections. We termed these three response classes as Class 1A, 1B, and 1C. Class 1A and 1B responses both exhibited pure synaptic depression while Class 1C responses included both facilitation and depression. Class 1A responses were all-or-none while Class 1B and 1C responses showed graded activation profiles. High-frequency stimulation of thalamus failed to activate metabotropic glutamate receptors for all three response classes.
We found that the majority of recorded pyramidal neurons in the subgranular layers of S1 receive input from thalamus. Fewer connected cells were observed in the auditory thalamocortical slice; however, this is may be an artifact of slicing and does not necessarily indicate a numerically weaker thalamocortical projection to the subgranular layers in A1 versus S1.
Our results from the current study and previous work (Viaene et al., 2011) indicate that excitatory neurons in all cortical layers receive direct input from first-order thalamic nuclei. These findings are consistent with several anatomical studies. Recent work has shown that excitatory neurons in layers 3–6 of S1 receive substantial thalamocortical inputs from VPM, between 150 and 300 boutons per neuron (Meyer et al., 2010). Ultrastructural analysis has also indicated that pyramidal neurons of layers 3, 4, 5, and 6 receive thalamic input (White, 1978; Keller et al., 1985). More recent electrophysiology work has shown that neurons in layers 5a, 5b, and 6 receive inputs from VPM (Bureau et al., 2006).
Previous studies have shown that both regular and fast spiking neurons in the subgranular layers receive thalamic input (Beierlein and Connors, 2002; Cruikshank et al., 2010). In these studies, the recorded neurons exhibited paired-pulse depression. Though the majority of our recorded cells exhibited pure depression following thalamic stimulation, we also observed a number of cells that responded to thalamic stimulation with a Class 1C pattern of mixed facilitation and depression. We observed the smallest number of cells with such Class 1C responses in layer 6, which may explain why they were not reported in work that focused on layer 6 (Beierlein and Connors, 2002).
Response latencies were found to be similar across cells in layers 5a, 5b, and 6 within S1 and within A1. On average, responses in layer 5b were slightly slower than in 5a and 6 [consistent with findings reported by de Kock et al. (2007)], but no statistically significant differences were observed across layers 5a, 5b, and 6 or between cells with different response classes. Overall, the response latencies we observed in the subgranular layers were similar in duration to response latencies observed in neurons of layers 2/3, and these responses are ∼1–1.5 ms slower than those recorded in neurons of layer 4 (Viaene et al., 2011). These results mirror what has been reported in in vivo studies where response latencies following whisker deflection were found to only vary by a few milliseconds across all layers of cortex (Ahissar et al., 2000; de Kock et al., 2007).
Subdividing Class 1 responses
Class 1A responses have been reported previously both in thalamus and cortex (Reichova and Sherman, 2004; Lee and Sherman, 2008, 2010; Petrof and Sherman, 2009; Viaene et al., 2011). In the thalamus, this type of response is associated with driver input. Drivers are thought to provide receptive field defining information to their postsynaptic target. This is likely to be the role of the thalamic projection to layer 4 of cortex as well given that all thalamic input to layer 4 is driver-like (Class 1A in nature). Support for this comes from studies of geniculocortical input to layer 4 in the cat: these inputs appear to provide the main receptive field properties to their postsynaptic cortical cells (Reid and Alonso, 1995; Ferster et al., 1996; Alonso et al., 2001; Kara et al., 2002).
When looking outside of thalamus and its inputs to layer 4, responses that resemble, but are not identical to, Class 1A responses are found. Class 1B responses seen now in thalamocortical projections and previously reported in corticocortical connections (Covic and Sherman, 2011), closely resemble Class 1A responses but lack the all-or-none activation profile. It is likely that the projections responsible for the Class 1B inputs are very similar in nature to those responsible for Class 1A responses but are much more convergent, resulting in a graded activation profile. That is, more convergent input is consistent with recruiting of more afferent axons with increasing stimulation currents as seen for Class 1B inputs.
Class 1C responses show a mixture of facilitation and depression. Such a response pattern is thought to be associated with an intermediate initial probability of release, lower than the probability of release of purely depressing synapses and higher than that of purely facilitating synapses (Dittman et al., 2000; Sun et al., 2005). Short-term plasticity is thought to be largely mediated by presynaptic variables (such as calcium concentration, the size of the readily releasable vesicle stores, etc.) (for review, see Zucker and Regehr, 2002). Aside from the initial facilitation, Class 1C responses closely resemble Class 1B responses, and as they lack metabotropic glutamate receptor activation, it is unlikely that Class 1C responses are a subtype of Class 2 responses.
We believe that the three response types described in this study are all unique subclasses of the previously described Class 1 response pattern due to different amounts of convergence in their inputs and differing initial probabilities of release. Functionally, cells exhibiting Class 1A responses are likely to receive driver-like inputs that provide receptive field defining properties [discussed by Viaene et al. (2011) and referred to then as Class 1 responses].
Class 1B responses closely resemble those of Class 1A in that inputs responsible for Class 1B responses are set up for reliable information transfer as they elicit larger initial EPSP amplitudes, have a high probability of neurotransmitter release (Dobrunz and Stevens, 1997); also, their lack of a metabotropic glutamate receptor component prevents distortion of temporal information content because metabotropic receptor activation is quite prolonged and often outlasts the activating input by hundreds of milliseconds to several seconds. However, these Class 1B responses show a graded activation profile, and therefore, may require more inputs (e.g., a larger sensory stimulus) to elicit responses equal to those of Class 1A.
Class 1C responses have the properties of a high-pass filter with a boost for intermediate frequencies. At intermediate stimulation frequencies, the facilitative component of the responses is enhanced, while at low and high stimulation frequencies, facilitation is diminished (see Fig. 3E). Thus inputs responsible for Class 1C responses may be important for enhancing the transmission of sensory information in the 10–20 Hz range. In VPM, relay neurons have been shown to reliably transmit whisker stimulation up to 40 Hz while thalamus is in an active state (Castro-Alamancos, 2002). Rats are known to actively explore their environment by sweeping their vibrissae at 4–12 Hz (for review, see Moore, 2004). Therefore, during active conditions, VPM should reliably transmit the sensory information from exploratory whisking to S1 at a frequency where these inputs could potentially be enhanced in the subgranular layers.
Projections of first-order thalamic nuclei
Responses of excitatory cells of primary sensory cortex following stimulation of the first-order thalamic nuclei tested here (VPM and MGBv) can be divided into four distinct groups. Interestingly, the types of responses seen in the supragranular layers, subgranular layers, and layer 4 are quite distinct. Responses in layers 2/3 are predominantly Class 2 in nature, while layer 4 neurons only exhibit Class 1A responses. This has been likened to layers 2/3 receiving modulatory input and layer 4 receiving driving input from thalamus (Viaene et al., 2011). The subgranular layers exhibit a mixture of Class 1 responses; however, there are some key differences between these responses and what is observed in layer 4. Cells in layer 4 exhibit larger initial EPSP amplitudes than do cells with Class 1A responses in the subgranular layers (see Fig. 6). Also, we observed a higher percentage of neurons in layer 4 that responded to thalamic stimulation than in layers 5a, 5b, or 6 (Viaene et al., 2011). Though both layer 4 and the subgranular layers receive a significant amount of driver-like input from thalamus, it may be that this input is more robust in layer 4. Overall, it appears that thalamus provides driving input to layer 4 while modulating the flow of sensory information through cortex via its projection to layers 2/3. The thalamic inputs to the subgranular layers of cortex (being weaker than those to layer 4) may combine more with other, intracortical inputs to drive their postsynaptic target cells.
Footnotes
This work was supported by National Institute on Deafness and Other Communication Disorders Grant DC008794 to S.M.S. and National Institute of General Medical Sciences Medical Scientist National Research Service Award 5 T32 GM07281 to A.N.V.
The authors declare no competing financial interests.
References
- Agmon A, Connors BW. Thalamocortical responses of mouse somatosensory (barrel) cortex in vitro. Neuroscience. 1991;41:365–379. doi: 10.1016/0306-4522(91)90333-j. [DOI] [PubMed] [Google Scholar]
- Ahissar E, Sosnik R, Haidarliu S. Transformation from temporal to rate coding in a somatosensory thalamocortical pathway. Nature. 2000;406:302–306. doi: 10.1038/35018568. [DOI] [PubMed] [Google Scholar]
- Alonso JM, Usrey WM, Reid RC. Rules of connectivity between geniculate cells and simple cells in cat primary visual cortex. J Neurosci. 2001;21:4002–4015. doi: 10.1523/JNEUROSCI.21-11-04002.2001. [DOI] [PMC free article] [PubMed] [Google Scholar]
- Beierlein M, Connors BW. Short-term dynamics of thalamocortical and intracortical synapses onto layer 6 neurons in neocortex. J Neurophysiol. 2002;88:1924–1932. doi: 10.1152/jn.2002.88.4.1924. [DOI] [PubMed] [Google Scholar]
- Bureau I, von Saint Paul F, Svoboda K. Interdigitated paralemniscal and lemniscal pathways in the mouse barrel cortex. PLoS Biol. 2006;4:e382. doi: 10.1371/journal.pbio.0040382. [DOI] [PMC free article] [PubMed] [Google Scholar]
- Castro-Alamancos MA. Different temporal processing of sensory inputs in the rat thalamus during quiescent and information processing states in vivo. J Physiol. 2002;539:567–578. doi: 10.1113/jphysiol.2001.013283. [DOI] [PMC free article] [PubMed] [Google Scholar]
- Covic EN, Sherman SM. Synaptic properties of connections between the primary and secondary auditory cortices in mice. Cereb Cortex. 2011 doi: 10.1093/cercor/bhr029. [DOI] [PMC free article] [PubMed] [Google Scholar]
- Cruikshank SJ, Rose HJ, Metherate R. Auditory thalamocortical synaptic transmission in vitro. J Neurophysiol. 2002;87:361–384. doi: 10.1152/jn.00549.2001. [DOI] [PubMed] [Google Scholar]
- Cruikshank SJ, Urabe H, Nurmikko AV, Connors BW. Pathway-specific feedforward circuits between thalamus and neocortex revealed by selective optical stimulation of axons. Neuron. 2010;65:230–245. doi: 10.1016/j.neuron.2009.12.025. [DOI] [PMC free article] [PubMed] [Google Scholar]
- de Kock CP, Bruno RM, Spors H, Sakmann B. Layer- and cell-type-specific suprathreshold stimulus representation in rat primary somatosensory cortex. J Physiol. 2007;581:139–154. doi: 10.1113/jphysiol.2006.124321. [DOI] [PMC free article] [PubMed] [Google Scholar]
- Dittman JS, Kreitzer AC, Regehr WG. Interplay between facilitation, depression, and residual calcium at three presynaptic terminals. J Neurosci. 2000;20:1374–1385. doi: 10.1523/JNEUROSCI.20-04-01374.2000. [DOI] [PMC free article] [PubMed] [Google Scholar]
- Dobrunz LE, Stevens CF. Heterogeneity of release probability, facilitation, and depletion at central synapses. Neuron. 1997;18:995–1008. doi: 10.1016/s0896-6273(00)80338-4. [DOI] [PubMed] [Google Scholar]
- Dudek SM, Friedlander MJ. Intracellular blockade of inhibitory synaptic responses in visual cortical layer IV neurons. J Neurophysiol. 1996;75:2167–2173. doi: 10.1152/jn.1996.75.5.2167. [DOI] [PubMed] [Google Scholar]
- Ferster D, Chung S, Wheat H. Orientation selectivity of thalamic input to simple cells of cat visual cortex. Nature. 1996;380:249–252. doi: 10.1038/380249a0. [DOI] [PubMed] [Google Scholar]
- Gil Z, Connors BW, Amitai Y. Differential regulation of neocortical synapses by neuromodulators and activity. Neuron. 1997;19:679–686. doi: 10.1016/s0896-6273(00)80380-3. [DOI] [PubMed] [Google Scholar]
- Guillery RW, Sherman SM. Thalamic relay functions and their role in corticocortical communication: generalizations from the visual system. Neuron. 2002;33:163–175. doi: 10.1016/s0896-6273(01)00582-7. [DOI] [PubMed] [Google Scholar]
- Gupta A, Wang Y, Markram H. Organizing principles for a diversity of GABAergic interneurons and synapses in the neocortex. Science. 2000;287:273–278. doi: 10.1126/science.287.5451.273. [DOI] [PubMed] [Google Scholar]
- Kara P, Pezaris JS, Yurgenson S, Reid RC. The spatial receptive field of thalamic inputs to single cortical simple cells revealed by the interaction of visual and electrical stimulation. Proc Natl Acad Sci U S A. 2002;99:16261–16266. doi: 10.1073/pnas.242625499. [DOI] [PMC free article] [PubMed] [Google Scholar]
- Keller A, White EL, Cipolloni PB. The identification of thalamocortical axon terminals in barrels of mouse Sml cortex using immunohistochemistry of anterogradely transported lectin (Phaseolus vulgaris-leucoagglutinin) Brain Res. 1985;343:159–165. doi: 10.1016/0006-8993(85)91171-0. [DOI] [PubMed] [Google Scholar]
- Lam YW, Sherman SM. Mapping by laser photostimulation of connections between the thalamic reticular and ventral posterior lateral nuclei in the rat. J Neurophysiol. 2005;94:2472–2483. doi: 10.1152/jn.00206.2005. [DOI] [PubMed] [Google Scholar]
- Lam YW, Sherman SM. Different topography of the reticulothalmic inputs to first- and higher-order somatosensory thalamic relays revealed using photostimulation. J Neurophysiol. 2007;98:2903–2909. doi: 10.1152/jn.00782.2007. [DOI] [PubMed] [Google Scholar]
- Lam YW, Nelson CS, Sherman SM. Mapping of the functional interconnections between thalamic reticular neurons using photostimulation. J Neurophysiol. 2006;96:2593–2600. doi: 10.1152/jn.00555.2006. [DOI] [PubMed] [Google Scholar]
- Lee CC, Sherman SM. Synaptic properties of thalamic and intracortical inputs to layer 4 of the first- and higher-order cortical areas in the auditory and somatosensory systems. J Neurophysiol. 2008;100:317–326. doi: 10.1152/jn.90391.2008. [DOI] [PMC free article] [PubMed] [Google Scholar]
- Lee CC, Sherman SM. Topography and physiology of ascending streams in the auditory tectothalamic pathway. Proc Natl Acad Sci U S A. 2010;107:372–377. doi: 10.1073/pnas.0907873107. [DOI] [PMC free article] [PubMed] [Google Scholar]
- Llano DA, Theyel BB, Mallik AK, Sherman SM, Issa NP. Rapid and sensitive mapping of long-range connections in vitro using flavoprotein autofluorescence imaging combined with laser photostimulation. J Neurophysiol. 2009;101:3325–3340. doi: 10.1152/jn.91291.2008. [DOI] [PMC free article] [PubMed] [Google Scholar]
- Losonczy A, Zhang L, Shigemoto R, Somogyi P, Nusser Z. Cell type dependence and variability in the short-term plasticity of EPSCs in identified mouse hippocampal interneurones. J Physiol. 2002;542:193–210. doi: 10.1113/jphysiol.2002.020024. [DOI] [PMC free article] [PubMed] [Google Scholar]
- McCormick DA, von Krosigk M. Corticothalamic activation modulates thalamic firing through glutamate “metabotropic” receptors. Proc Natl Acad Sci U S A. 1992;89:2774–2778. doi: 10.1073/pnas.89.7.2774. [DOI] [PMC free article] [PubMed] [Google Scholar]
- Metherate R, Ashe JH. Nucleus basalis stimulation facilitates thalamocortical synaptic transmission in the rat auditory cortex. Synapse. 1993;14:132–143. doi: 10.1002/syn.890140206. [DOI] [PubMed] [Google Scholar]
- Meyer HS, Wimmer VC, Hemberger M, Bruno RM, de Kock CP, Frick A, Sakmann B, Helmstaedter M. Cell type-specific thalamic innervation in a column of rat vibrissal cortex. Cereb Cortex. 2010;20:2287–2303. doi: 10.1093/cercor/bhq069. [DOI] [PMC free article] [PubMed] [Google Scholar]
- Moore CI. Frequency-dependent processing in the vibrissa sensory system. J Neurophysiol. 2004;91:2390–2399. doi: 10.1152/jn.00925.2003. [DOI] [PubMed] [Google Scholar]
- Petrof I, Sherman SM. Synaptic properties of the mammillary and cortical afferents to the anterodorsal thalamic nucleus in the mouse. J Neurosci. 2009;29:7815–7819. doi: 10.1523/JNEUROSCI.1564-09.2009. [DOI] [PMC free article] [PubMed] [Google Scholar]
- Porter JT, Johnson CK, Agmon A. Diverse types of interneurons generate thalamus-evoked feedforward inhibition in the mouse barrel cortex. J Neurosci. 2001;21:2699–2710. doi: 10.1523/JNEUROSCI.21-08-02699.2001. [DOI] [PMC free article] [PubMed] [Google Scholar]
- Reichova I, Sherman SM. Somatosensory corticothalamic projections: distinguishing drivers from modulators. J Neurophysiol. 2004;92:2185–2197. doi: 10.1152/jn.00322.2004. [DOI] [PubMed] [Google Scholar]
- Reid RC, Alonso JM. Specificity of monosynaptic connections from thalamus to visual cortex. Nature. 1995;378:281–284. doi: 10.1038/378281a0. [DOI] [PubMed] [Google Scholar]
- Shepherd GM, Pologruto TA, Svoboda K. Circuit analysis of experience-dependent plasticity in the developing rat barrel cortex. Neuron. 2003;38:277–289. doi: 10.1016/s0896-6273(03)00152-1. [DOI] [PubMed] [Google Scholar]
- Sherman SM, Guillery RW. On the actions that one nerve cell can have on another: distinguishing “drivers” from “modulators”. Proc Natl Acad Sci U S A. 1998;95:7121–7126. doi: 10.1073/pnas.95.12.7121. [DOI] [PMC free article] [PubMed] [Google Scholar]
- Sherman SM, Guillery RW. Exploring the thalamus. Cambridge, MA: MIT Press; 2006. [Google Scholar]
- Shibuki K, Hishida R, Murakami H, Kudoh M, Kawaguchi T, Watanabe M, Watanabe S, Kouuchi T, Tanaka R. Dynamic imaging of somatosensory cortical activity in the rat visualized by flavoprotein autofluorescence. J Physiol. 2003;549:919–927. doi: 10.1113/jphysiol.2003.040709. [DOI] [PMC free article] [PubMed] [Google Scholar]
- Sun HY, Lyons SA, Dobrunz LE. Mechanisms of target-cell specific short-term plasticity at Schaffer collateral synapses onto interneurones versus pyramidal cells in juvenile rats. J Physiol. 2005;568:815–840. doi: 10.1113/jphysiol.2005.093948. [DOI] [PMC free article] [PubMed] [Google Scholar]
- Swadlow HA, Gusev AG, Bezdudnaya T. Activation of a cortical column by a thalamocortical impulse. J Neurosci. 2002;22:7766–7773. doi: 10.1523/JNEUROSCI.22-17-07766.2002. [DOI] [PMC free article] [PubMed] [Google Scholar]
- Tan Z, Hu H, Huang ZJ, Agmon A. Robust but delayed thalamocortical activation of dendritic-targeting inhibitory interneurons. Proc Natl Acad Sci U S A. 2008;105:2187–2192. doi: 10.1073/pnas.0710628105. [DOI] [PMC free article] [PubMed] [Google Scholar]
- Viaene AN, Petrof I, Sherman SM. Synaptic properties of thalamic input to layers 2/3 and 4 of primary somatosensory and auditory cortices. J Neurophysiol. 2011;105:279–292. doi: 10.1152/jn.00747.2010. [DOI] [PMC free article] [PubMed] [Google Scholar]
- White EL. Identified neurons in mouse Sml cortex which are postsynaptic to thalamocortical axon terminals: a combined Golgi-electron microscopic and degeneration study. J Comp Neurol. 1978;181:627–661. doi: 10.1002/cne.901810310. [DOI] [PubMed] [Google Scholar]
- Zhou Y, Liu BH, Wu GK, Kim YJ, Xiao Z, Tao HW, Zhang LI. Preceding inhibition silences layer 6 neurons in auditory cortex. Neuron. 2010;65:706–717. doi: 10.1016/j.neuron.2010.02.021. [DOI] [PMC free article] [PubMed] [Google Scholar]
- Zucker RS, Regehr WG. Short-term synaptic plasticity. Annu Rev Physiol. 2002;64:355–405. doi: 10.1146/annurev.physiol.64.092501.114547. [DOI] [PubMed] [Google Scholar]