Abstract
OBJECTIVE
The role of adenosine (ADO) in the regulation of glucose homeostasis is not clear. In the current study, we used A1-ADO receptor (A1AR)-deficient mice to investigate the role of ADO/A1AR signaling for glucose homeostasis.
RESEARCH DESIGN AND METHODS
After weaning, A1AR−/− and wild-type mice received either a standard diet (12 kcal% fat) or high-fat diet (HFD; 45 kcal% fat). Body weight, fasting plasma glucose, plasma insulin, and intraperitoneal glucose tolerance tests were performed in 8-week-old mice and again after 12–20 weeks of subsequent observation. Body composition was quantified by magnetic resonance imaging and epididymal fat-pad weights. Glucose metabolism was investigated by hyperinsulinemic-euglycemic clamp studies. To describe pathophysiological mechanisms, adipokines and Akt phosphorylation were measured.
RESULTS
A1AR−/− mice were significantly heavier than wild-type mice because of an increased fat mass. Fasting plasma glucose and insulin were significantly higher in A1AR−/− mice after weaning and remained higher in adulthood. An intraperitoneal glucose challenge disclosed a significantly slower glucose clearance in A1AR−/− mice. An HFD enhanced this phenotype in A1AR−/− mice and unmasked a dysfunctional insulin secretory mechanism. Insulin sensitivity was significantly impaired in A1AR−/− mice on the standard diet shortly after weaning. Clamp studies detected a significant decrease of net glucose uptake in A1AR−/− mice and a reduced glucose uptake in muscle and white adipose tissue. Effects were not triggered by leptin deficiency but involved a decreased Akt phosphorylation.
CONCLUSIONS
ADO/A1AR signaling contributes importantly to insulin-controlled glucose homeostasis and insulin sensitivity in C57BL/6 mice and is involved in the metabolic regulation of adipose tissue.
Adenosine (ADO), a purine nucleoside, is a ubiquitous product of ATP breakdown, with a large variety of regulatory functions. ADO effects are mediated by four receptors (AR): A1, A2a, A2b, and A3, each showing an organ-specific expression pattern and different half-maximal effective concentration (EC50), thus facilitating differential effects (1). ARs mediate downstream effects mostly via G-protein–coupled receptors that are either stimulatory (A2a and A2b) or inhibitory (A1 and A3) to adenylate cyclase. The resulting increase or decrease of cAMP induces downstream signaling by triggering phosphorylation activation of key enzymes (2).
A role of the metabolic byproduct of ATP utilization, adenosine, in the regulation of glucose uptake and utilization makes physiological sense. Nevertheless, previous studies of the effect of ADO on glucose transport have yielded conflicting results in that insulin sensitivity and/or glucose uptake were reported as either decreased (3–6) or increased (7–9). The availability of mice with adenosine receptor deletions offers a new way to assess the role of a chronic reduction in ADO signaling on glucose tolerance. Recently, we discovered a nephropathic phenotype in an A1AR-deficient Akita hybrid mouse model of type 1 diabetes, suggesting a relevant role for A1AR signaling in maintaining glucose homeostasis (10). Another recent study showed that mice with A1AR deletion have a higher fat content with aging (11). Because of the well-established relationship between excess body weight and insulin resistance, we considered it possible that the phenotype of A1AR-deficient mice may include the development of glucose intolerance and insulin resistance. In the current study, we have therefore used A1AR-deficient mice to examine the hypothesis that ADO signaling via A1AR contributes to glucose homeostasis. Our main findings support this notion in that A1AR-deficient mice show a defect in glucose tolerance that seems to be a result of insulin resistance.
RESEARCH DESIGN AND METHODS
Experiments were performed in mice of the A1AR-deficient strain generated in this laboratory (12). Heterozygous mice were crossed with C57BL/6 or Swiss wild-type mice for more than eight generations to generate A1AR−/− mice in a congenic C57BL/6 or Swiss genetic background. Genotyping was done on tail DNA using PCR, as described previously (12). Male A1AR+/+ and A1AR−/− mice in a C57BL/6 background were separated into two different study groups; one group received a standard rodent diet (NIH-07 rodent diet), containing 24 kcal% protein, 12 kcal% fat, and 64 kcal% carbohydrate, whereas another group received a high-fat diet (HFD) (D12451 rodent diet; Research Diets, New Brunswick, NJ), containing 20 kcal% protein, 45 kcal% fat, and 35 kcal% carbohydrate. Mice were included in the study at ~8 weeks of age. Body weight was assessed regularly. Female littermates of the C57BL/6 background were used for body composition analyses and hyperinsulinemic-euglycemic clamp studies. All mice had unrestricted access to tap water. Animal care and experimentation were approved and carried out in accordance with the National Institutes of Health Guide for the Care and Use of Laboratory Animals.
Food intake and locomotor activity.
Food and water consumption were measured over 10 days in mice housed individually in their home cages by determining the initial and final weights of supplied food and water. Body weight was measured on day 1 and thereafter on days 4, 7, and 10. Spontaneous locomotor activity was measured in mice carrying radio transmitters that were implanted for blood pressure measurements (Data Sciences International, St. Paul, MN).
Body composition analysis.
Fat and lean mass were measured in conscious mice using the EchoMRI 3-in-1 analyzer for mice (Echo Medical Systems, Houston, TX) (13). In addition, the weight of epididymal fat pads was determined in tissue collected from male mice.
Blood sampling and determination of blood parameters.
In the plasma of blood samples collected in conscious mice by tail-vein puncture using 30-g needles, glucose concentrations were measured using the Glucostix AccuCheck active (Roche Diagnostics, Indianapolis, IN), and insulin concentrations were measured using an ELISA (Ultra Sensitive Rat Insulin ELISA Kit; Crystal Chem, Downers Grove, IL), according to the manufacturer’s recommendation. Measurements of fasting values were conducted after a 10- to 12-h fasting period. All experiments were timed to start in midmorning (at 10:00 a.m.). Free fatty acids (FFAs; Roche Applied Science, Indianapolis, IN), triglycerides (Thermo DMA, Louisville, CO), leptin (EIA, Alpco Diagnostics, Salem, NH), and adiponectin (RIA, Millipore, Billerica, MA) were measured in serum collected from the vena cava of anesthetized C57BL/6 mice. Plasma and serum samples were stored at −80°C if not used immediately.
Intraperitoneal glucose tolerance test.
Intraperitoneal glucose tolerance tests (ipGTTs) were performed in each study group according to the protocol of the Animal Model of Diabetes Complications Consortium at the inclusion time and again after 14–15 weeks. Mice were fasted for 10–12 h prior to the experiment. Experiments were performed between 10:00 a.m. and 1:00 p.m. A stock solution of 100 mg/mL d-glucose saline was prepared and sterile filtered through 45-μm pore filters (Millex-HA; Millipore Ireland, Carrigtwohill, Ireland). After an initial fasting blood sample, 1 mg glucose/g body wt was injected intraperitoneally, and blood was sampled after 5, 15, 30, 60, and 120 min. Glucose and insulin were determined in each sample. To rule out strain-specific effects, we additionally performed ipGTTs in A1AR−/− versus wild-type mice with the congenic Swiss genetic background. Groups were matched for age, body weight, and sex.
Insulin sensitivity index.
Insulin sensitivity was quantified by a modified Belfiore Insulin Sensitivity Index (ISI). Belfiore et al. (14) proposed an index derived from the following formula: ISI (gly) = 2/[(INSp × GLYp) + 1], where INSp and GLYp refer to insulinemic and glycemic areas during a glucose tolerance test. Meta-analyses of hyperinsulinemic-euglycemic clamp studies documented an almost linear relationship with Belfiore ISI (r = 0.96, P < 0.001) in humans. The Belfiore ISI equation was changed to (2/[area under the curve {AUC} insulin {mU/L} × AUC glucose {mmol/L}] × 106) as an adaptation to the lower mouse insulin plasma concentration, as shown for rat data previously (15).
Hyperinsulinemic-euglycemic clamp study.
Hyperinsulinemic-euglycemic clamp studies were performed in awake, restrained, female mice at 18 weeks of age, as described previously (16), with the following modifications: mice were fasted for 5 h; experiments used primed-continuous infusion of [3-3H]glucose (2.5 μCi bolus, 0.05 μCi/min during the basal state, and 0.1 μCi/min during the clamp period); and insulin was infused at the rate of 4 mU/kg/min after a 16 mU/kg bolus.
Akt phosphorylation.
C57BL/6 mice were fasted overnight and anesthetized by an intraperitoneal injection of avertin (0.25 mg/g body wt; n = 3). A total of 2.5 min after the vena cava injection of insulin (100 μL of 15 μg/mL; Sigma), quadriceps muscles were dissected and immediately frozen. Muscle tissues were homogenized in lysis buffer containing 0.1 mol/L NaCl and 20 mmol/L HEPES (pH 7.4, 1% Tx-100, 1 mmol/L EDTA, 1 mmol/L phenylmethanesulfonyl fluoride, 1 mmol/L Na3VO4, 1 mmol/L NaF, and protease inhibitor cocktail) (Roche Biomedical, Indianapolis, IN). Tissue lysates were centrifuged at 5,000 rpm for 10 min at 4°C, and supernatants were kept at −80°C. Muscle protein (75 μg) was separated on 4–12% NuPAGE gels, and Akt phosphorylation levels or total Akt protein were determined using an anti–phospho-Akt (ser473) or anti-Akt (ser473) antibody (Cell Signaling Technology, Beverly, MA). Antibody binding was determined by chemoluminescence (ECL kit; Thermo Scientific, Waltham, MA). Muscle Akt phosphorylation levels were determined by measurement of band density using an AlphaImager 3400 and normalized to total Akt protein.
Statistical analyses.
Chauvenet criteria were applied to all data before statistical analysis to eliminate outliers. Univariable determinations were subjected to the Kruskal-Wallis test for normality and the Student t test for significance. In case of a significantly different variance, the Welch correction was used. ipGTTs were analyzed by calculating total AUC (tAUC) for glucose and corresponding insulin values respectively. tAUC results were compared like univariable data. P values < 0.05 were considered significant.
RESULTS
Food consumption and locomotor activity.
Food intake measured over 10 consecutive days in 12- to 14-week-old C57BL/6 mice averaged 3.85 ± 0.1 g/day in wild-type (n = 10, 4 male and 6 female) and 4.12 ± 0.06 g/day in A1AR−/− (n = 12, 6 male and 6 female; P = 0.024) mice. Thus, caloric intake was significantly greater in A1AR−/− than wild-type mice. Likewise, water intake was significantly higher in A1AR−/− than wild-type mice (7.75 ± 0.01 mL/day vs. 6.9 ± 0.17 mL/day; P < 0.01). Twenty-four–hour mean spontaneous locomotor activity measured by radiotelemetry and expressed as movement counts per minute averaged 6.5 ± 3.3 in wild-type (n = 5) and 6.3 ± 0.8 in A1AR−/− (n = 5) mice. Mean arterial blood pressure was not different between wild-type and A1AR−/− mice (108 ± 2.8 mmHg vs. 107 ± 1.25 mmHg; n = 5).
Body weight, body composition, and fat fraction.
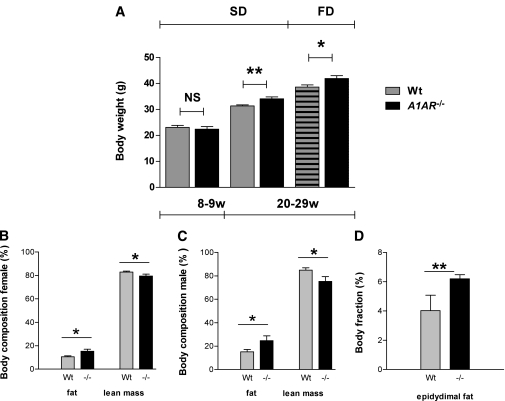
Body weights in male mice were compared at baseline (at 8–9 weeks) and repeatedly between 20 and 29 weeks on either the standard diet or HFD. The latter data were pooled for analysis. A1AR−/− mice on the standard diet were significantly heavier than wild-type mice already at baseline. The difference under the standard diet was even more pronounced in the 20- to 29-week age-group, and feeding the HFD further increased body weight. The extra weight gain in A1AR−/− mice was caused by a significantly higher proportion of body fat, whereas no difference in lean mass was obvious. Fittingly, the epididymal fat mass was significantly greater in male A1AR−/− compared with wild-type mice (Fig. 1).
FIG. 1.
A–D: Body weight by age and diet type, body composition, and fat fraction. A1AR-deficient C57BL/6 mice have increased body weight and fat mass. A: Body weight of male mice at 8–9 weeks on the standard diet (SD) (wild type [Wt]: n = 17; A1AR−/−: n = 5) and 20–29 weeks on the SD (Wt: n = 36; A1AR−/−: n = 14) and HFD (FD) (Wt: n = 26; A1AR−/−: n = 18). B: Body composition in male mice (Wt: n = 8; A1AR−/−: n = 8). C: Body composition in female mice (Wt: n = 9; A1AR−/−: n = 8). D: Epididymal fat pads in male mice (Wt: n = 12; A1AR−/−: n = 6). Body composition and fat-pad weight data are expressed as percentage body weight. Data are shown as means ± SEM. *P < 0.05; **P < 0.01. NS, not significant.
Serum concentration of adipokines and lipids.
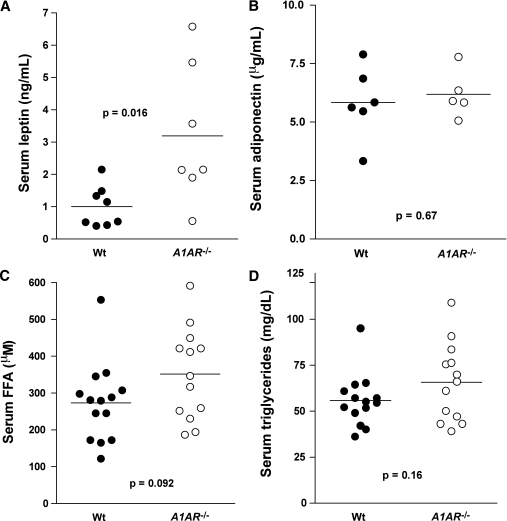
The serum leptin concentration of mice in the 25- to 30-week age range averaged 1.0 ± 0.22 ng/mL in wild-type mice, which was significantly lower than the value of 3.19 ± 0.81 ng/mL found in A1AR−/− mice (P = 0.15) (Fig. 2A). Body weights of these groups of mice were 25.4 ± 1.4 g and 29 ± 1.1 g in wild-type and A1AR−/− mice, respectively. Serum concentrations of adiponectin were not different between genotypes, averaging 5.8 ± 0.6 mg/mL and 6.2 ± 0.45 mg/mL in wild-type and A1AR−/− mice, respectively (Fig. 2B).
FIG. 2.
A–D: Serum concentrations of leptin (wild type [Wt]: n = 8; A1AR−/−: n = 7) (A), adiponectin (Wt: n = 6; A1AR−/−: n = 5) (B), FFAs (Wt: n = 14; A1AR−/−: n = 13) (C), and triglycerides (Wt: n = 14; A1AR−/−: n = 13) (D) in C57BL/6 Wt and A1AR−/− mice (25–30 weeks of age). Symbols represent data from individual mice.
In mice on standard diets, FFA serum concentrations tended to be higher in A1AR−/− than wild-type mice (352 ± 34 μmol/L vs. 273 ± 29 μmol/L; P = 0.091) (Fig. 2C). A similar nonsignificant tendency was observed in serum triglyceride concentrations between the A1AR−/− and wild-type mice (55.8 ± 33.8 mg/dL vs. 65.7 ± 5.9 mg/dL; P = 0.16) (Fig. 2D). There were no sex differences in either FFA or triglyceride serum concentrations. FFA serum concentrations in A1AR−/− mice on the HFD tended to be higher than in wild-type mice without quite reaching significance (359 ± 61 μmol/L vs. 217 ± 30 μmol/L; n = 10 vs. n = 9; P = 0.06). Triglyceride serum concentrations in mice fed the HFD were not different between A1AR−/− and wild-type genotypes (110.8 ± 7.2 mg/dL vs. 111.4 ± 14 mg/dL), but they were significantly higher than in mice on standard diets.
Fasting plasma glucose and insulin.
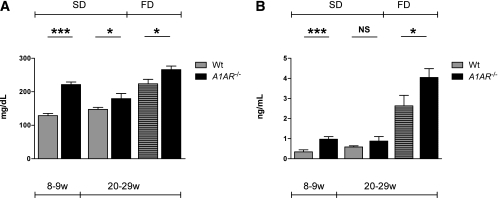
Plasma glucose concentration after a 10- to 12-h fasting period was significantly higher in A1AR−/− than in wild-type mice at 8 weeks and at 20–28 weeks on both the standard diet and the HFD. Intragroup comparison showed no significance in wild-type mice on the standard diet comparing 8–9 with 20–28 weeks, but wild-type mice at 20–28 weeks on the standard diet had significantly lower plasma glucose than age-matched mice on the HFD (P < 0.0001). In contrast, the plasma glucose of A1AR−/− mice increased significantly with age on both the standard diet and HFD (Fig. 3A). Fasting plasma insulin was higher in A1AR−/− than in wild-type mice. The difference was significant at 8 weeks on the standard diet and at 20–28 weeks on the HFD. Looking at age-related effects, the intragroup comparison showed that the fasting plasma insulin of wild-type mice differed significantly between 8–9 and 20–28 weeks on the standard diet (P = 0.0257) and highly significantly at 20–28 weeks on the HFD (P < 0.0001). A1AR−/− mice, in contrast, did not increase fasting plasma insulin significantly between 8–9 and 20–28 weeks on the standard diet but had significantly higher values on the HFD compared with the standard diet at 20–28 weeks (P < 0.0001) (Fig. 3B).
FIG. 3.
A and B: A1AR-deficient mice have significantly elevated glucose and insulin levels. Blood glucose (A) and plasma insulin (B) levels were measured after a 10- to 12-h fast in 8- to 9-week-old mice fed a standard diet (SD) (A: wild type [Wt]: n = 15, A1AR−/−: n = 14; B: Wt: n = 14, A1AR−/−: n = 18) and 20- to 29-week-old mice fed an SD (A: Wt: n = 32, A1AR−/−: n = 19; B: Wt: n = 22, A1AR−/−: n = 12) and an HFD (FD) (A: Wt: n = 19, A1AR−/−: n = 20; B: Wt: n = 13, A1AR−/−: n = 15). All mice were on a C57BL/6 background. Data are means ± SEM. *P < 0.05; ***P < 0.001. NS, not significant. w, weeks.
ipGTTs.
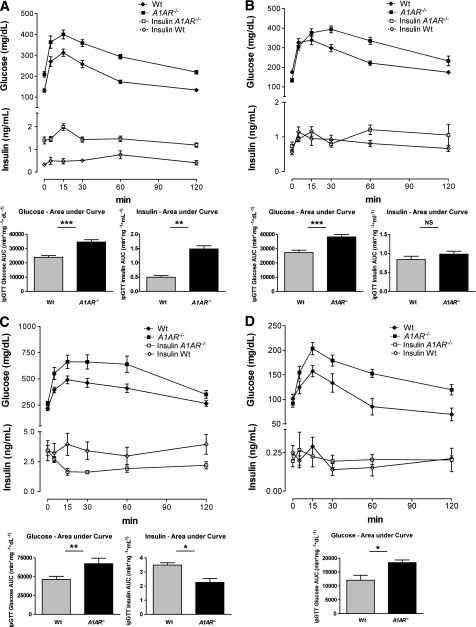
Plasma glucose clearance after an intraperitoneal glucose challenge was significantly delayed in A1AR−/− mice compared with wild-type controls on a C57BL/6 background, as indicated by a significant reduction of the tAUC (min/mg/dL) (Fig. 4A–C). To test whether impaired glucose tolerance was caused by defects in insulin secretion or insulin action, we measured plasma insulin levels during an ipGTT. At 8 weeks of age, insulin levels were significantly higher in the mutant mice compared with the controls, suggesting that glucose intolerance was a result of insulin resistance rather than insulin deficiency (Fig. 4A). After 20 weeks of age, glucose-stimulated insulin secretion was comparable in mutant and wild-type mice, suggesting that insufficient insulin secretion may have contributed to impaired glucose tolerance in adult A1AR−/− mice. However, a trend toward an increased insulin response in the knockout compared with the wild-type mice still was recognizable at 20–22 weeks (P = 0.09). The insulin curve showed a biphasic pattern, with a delayed second-phase response capability in the knockout mice, suggesting a defective secretion mechanism (Fig. 4B). This finding was enhanced in mice on the HFD. The mutant mice on the HFD showed a significantly and paradoxically reduced insulin secretion at the age of ~20 weeks, suggesting that an HFD further worsened islet function. These mice lost the physiological response to the glucose stimulus (Fig. 4C). In general, this documentation of an insufficient insulin response in adult A1AR−/− mice compares well with the age-dependent differences of insulin secretion pattern that were noticed in the fasting-mice baseline values (Fig. 3B). To determine the potential impact of the genetic background, we performed the ipGTT test in A1AR−/− mice on a congenic Swiss background. Again, after an intraperitoneal glucose challenge, tAUCs (min/mg/dL) under the glucose curve were significantly increased in A1AR−/− compared with wild-type mice (Fig. 4D).
FIG. 4.
A–D: A1AR-deficient mice are glucose intolerant and develop an age- and body weight–dependent pathologic insulin secretion pattern. Curves depict plasma glucose clearance and corresponding insulin concentrations in male wild-type (Wt) and A1AR−/− mice on a pure C57BL/6 background by time. Inserts indicate tAUCs (min/mg/dL) of timed glucose and insulin values as marked. A: Glucose tolerance and insulin secretion after glucose stimulus in male mice fed a standard diet at the age of 8 weeks (Wt: n = 10; A1AR−/−: n = 9). B: Glucose tolerance and insulin secretion after glucose stimulus in male mice fed a standard diet at the age of 20–22 weeks (Wt: n = 12; A1AR−/−: n = 7). C: Glucose tolerance and insulin secretion after glucose stimulus in male mice fed an HFD at the age of 20–22 weeks (Wt: n = 14; A1AR−/−: n = 10). D: Intraperitoneal glucose tolerance in Wt and A1AR−/− mice on the standard diet in the congenic Swiss background. Groups are matched for sex, age, and body weight (Wt: n = 3 female and 1 male, mean age 21 weeks; A1AR−/−: n = 2 female and 2 male, mean age 23 weeks; P = NS for all parameters). tAUCs (min/mg/dL) of glucose clearance were significantly increased in A1AR−/− compared with Wt mice (P = 0.0199). Data are means ± SEM. *P < 0.05; **P < 0.01; ***P < 0.001. NS, not significant.
Modified Belfiore ISI.
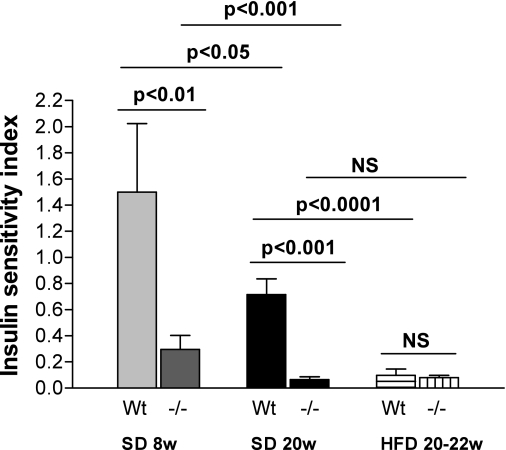
A1AR−/− on a standard diet at 8 and 20 weeks had significantly decreased index compared with wild-type mice, suggesting reduced insulin sensitivity. In contrast, the indices in mice fed the HFD were equal. When comparing intragroup differences, it is obvious that increasing age on the standard diet led to significantly lower index values in wild-type and A1AR−/− mice, respectively (8 vs. 20 weeks: wild type, P = 0.015; A1AR−/−, P < 0.001). No difference was seen between A1AR−/− mice on the HFD at 20–22 weeks compared with the standard diet at 20 weeks (P = 0.25), whereas in wild-type mice, the HFD led to a markedly significant lower ISI compared with the standard diet (P < 0.0001), a lower index representing decreased insulin sensitivity (Fig. 5).
FIG. 5.
Modified Belfiore ISI calculated from ipGTTs of plasma glucose and insulin concentrations (Belfiore ISI). Significantly reduced insulin sensitivity in A1AR−/− mice compared with wild-type (Wt) controls on the standard diet (SD) at 8 weeks (w) (A1AR−/−: n = 3; Wt: n = 4) and 20 weeks (A1AR−/−: n = 6; Wt: n = 5). No difference in mice on the HFD (Wt: n = 7; A1AR−/−: n = 5). Intragroup comparison: increasing age on the SD led to significantly lower index values in Wt and A1AR−/− mice. No difference was seen between A1AR−/− mice on the HFD at 20–22 weeks vs. the SD at 20 weeks. In contrast, in Wt mice HFD lowered ISI significantly. NS, nonsignificant.
Hyperinsulinemic-euglycemic clamp.
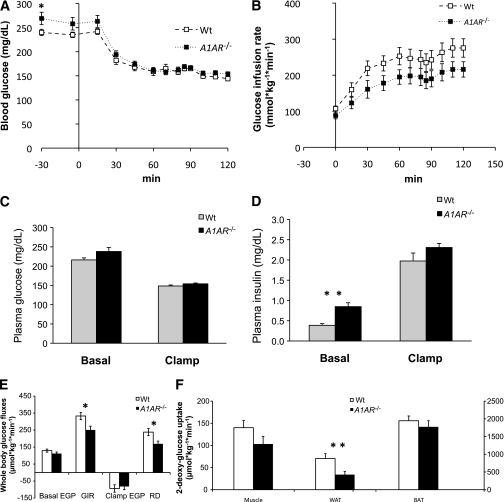
To determine the mechanism of insulin resistance in the A1AR-deficient mice, we performed hyperinsulinemic-euglycemic clamp studies in 18-week-old female mice fasted for 5 h (Fig. 6). Basal glucose turnover was comparable in wild-type and A1AR−/− mice, although plasma insulin levels were significantly higher in the mutant mice (Fig. 6E and D). During the clamp, insulin was infused at the rate of 4 mU/kg/min to achieve physiological hyperinsulinemia (~2 ng/mL) (Fig. 6D), and glucose was infused at a variable rate to maintain blood glucose at ~150 mg/dL (Fig. 6A and C). The glucose infusion rate was significantly lower in the A1AR−/− mice, consistent with insulin resistance (Fig. 6B). Under the clamp conditions used, endogenous glucose production was equally suppressed in both strains; the reduced glucose infusion rate in the A1AR−/− mice was mainly attributed to lower glucose disposal rates (Fig. 6E). To test which tissues contributed to this difference between the strains, we used a nonmetabolized glucose tracer, 2-deoxy-glucose (2-DG). As shown in Fig. 6F, the A1AR−/− mice showed significantly reduced 2-DG uptake into white adipose tissue (WAT) and a trend toward lower 2-DG uptake into skeletal muscle (P = 0.12), whereas the uptake into brown adipose tissue was comparable between the strains. Clamp studies performed in male mice showed similar trends (not shown). Taken together, these data demonstrate that the insulin resistance in the A1AR−/− mice was associated with a reduced glucose uptake into WAT and, possibly, skeletal muscle.
FIG. 6.
A–F: Hyperinsulinemic-euglycemic clamp in wild-type (Wt) and A1AR−/− mice. Blood glucose (A), glucose infusion rate (GIR) (B), plasma glucose (C), plasma insulin (D), whole-body glucose fluxes (E), and tissue 2-DG (F) uptake were measured in 5-h–fasted, 18-week-old Wt (n = 16) and A1AR−/− (n = 14) littermate mice on a C57BL/6 background during a hyperinsulinemic-euglycemic clamp. C–E: Basal parameters are the means ± SEM of data collected at −30 and −5 min (after a 90-min equilibration). At 0 min, mice were infused with insulin (4 mU/kg/min) and 20% glucose (variable rate) to maintain blood glucose concentrations at ~150 mg/dL. E: Clamp whole-body fluxes are the means ± SEM of data collected at 90–120 min. D: Clamp insulin was measured at 110 min. C: Bolus of 2-DG was administered at 80 min, and mice were killed at 120 min for tissue processing. BAT, brown adipose tissue; EGP, endogenous glucose production; Muscle, gastrocnemius muscle; RD, glucose disposal rate. *P < 0.05; **P < 0.01.
Insulin signaling.
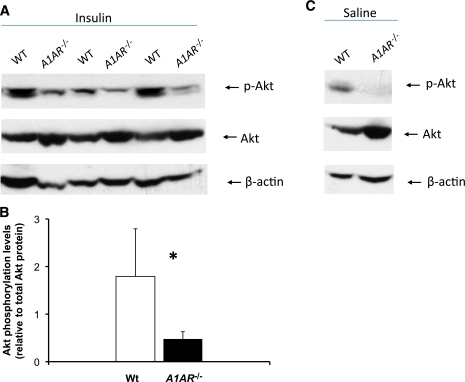
To test if insulin resistance in A1AR−/− mice is associated with impaired downstream signaling, we determined insulin-dependent phosphorylation of protein kinase B/Akt in skeletal muscle. As shown in Fig. 7, insulin-induced phosphorylation of Akt was markedly reduced in A1AR−/− compared with wild-type mice. Of note, total Akt protein seemed to be higher in the mutant mice for reasons currently unknown. The abundance of phospho-extracellular signal–related kinase 1/2 following insulin was not different between wild-type and A1AR−/− mice (data not shown).
FIG. 7.
A–C: Decrease in Akt phosphorylation levels in A1AR−/− mice. A: Male wild-type (WT) and A1AR−/− mice were killed 2.5 min after insulin administration into the vena cava, and Akt phosphorylation at the ser473 site was assessed in muscle tissues. Immunoblotting analysis of Akt phosphorylation levels (upper panels) and total Akt protein (lower panel). B: Quantification of Akt phosphorylation normalized to total Akt protein. C: Akt phosphorylation and total Akt protein under basal conditions. Basal Akt phosphorylation levels were visualized by extent exposure for the image. (A high-quality color representation of this figure is available in the online issue.)
DISCUSSION
The main finding of the current study is the demonstration that mice with a null mutation of the A1AR display reduced glucose tolerance, had decreased insulin sensitivity, and had a significantly lower net glucose uptake under clamp conditions. The phenotype is strain independent because it was observed in two different mouse strains with deletion of the A1AR locus (C57BL/6 and Swiss). Furthermore, our data show a worsening of the phenotype with age or body weight, as can be typically seen in type 2 diabetes. Our findings demonstrate that A1AR signaling contributes importantly to maintaining glucose homeostasis and physiological insulin action. Aside from affecting glucose metabolism, A1ARs also modify fat metabolism, as evidenced by an increase in adipose tissue mass.
Facilitation of glucose uptake by ADO previously has been reported in isolated hindquarter preparation and, conversely, inhibition of ADO actions by methylxanthine-inhibited insulin-stimulated glucose uptake in isolated rat muscle strips (7,17). There is some evidence that this ADO action is mediated by A1ARs because A1AR activation directly stimulates insulin-mediated glucose transport in oxidative muscle during contractions and indirectly contributes to enhanced insulin and glucose delivery to muscle fibers during contractions by increasing the blood flow by vasodilatation (18). Maeda and Koos (19) observed a depressing effect of endogenous ADO on insulin and glucose concentrations in fetal sheep via A1ARs. More recently, it has been reported that adenosine A1 selective activation elicits 50% of insulin-stimulated glucose transport in isolated skeletal muscle without influencing either basal or maximal insulin-stimulated glucose uptake (20). Moreover, the partial A1AR agonist, CVT-3619, improved insulin resistance during hyperinsulinemic clamp studies in C57BL/J6 mice fed an HFD (21). Genetically engineered mice overexpressing A1ARs were protected against insulin resistance during HFD-induced obesity (22). Prolonged A1AR stimulation led to downregulation of A1AR receptors in neurons, whereas streptozotocin-induced diabetes led to an increase of A1AR gene expression (23,24). These reports suggest the existence of a feedback cycle of plasma glucose levels and A1AR signaling to maintain glucose homeostasis. In contrast, using a genetic model of A1AR deficiency, Johansson et al. (25,26) reported the absence of an effect on glucose tolerance but an increase of pancreatic insulin secretion after glucose stimuli.
The cellular mechanisms by which ADO may enhance glucose uptake are not clear. Our data show a significantly reduced phosphorylation of Akt kinase in skeletal muscle following stimulation by insulin. In view of the well-established role of Akt as a downstream constituent of the insulin-signaling pathway, reduced insulin-dependent activation could lead to a reduction in the membrane trafficking of Glut4 and hence reduced glucose uptake (27). Activation of A1AR regulates several membrane and intracellular proteins, such as adenylate cyclase, phospholipase C, Ca2+ channels, and K+ channels (28). In rat hepatoma cells, A1AR stimulation of the Na+-dependent ADO transporter, CNT2, is dependent on ATP-sensitive K+ channel activity. This mechanism is more effective under high extracellular glucose concentrations, suggesting that A1AR-dependent cellular uptake of ADO may participate in adapting the intracellular purine content to excess extracellular glucose usable to be metabolized (28). Selective A1AR inhibition in these cells attenuated glucose production and glycogenolysis (29). Therefore, ADO seems to mediate the increase of intracellular glucose that can be used as substrate for oxidative glycolysis to produce ATP, and the A1AR pathway seems to participate in this process by promoting uptake of extracellular glucose.
Other than demonstrating a significant impairment in whole-body glucose uptake, our studies show that the body weights of A1AR-deficient mice are significantly greater than that of normal control mice and that this is associated with a higher proportion of fat tissue (Fig. 1A–D). An effect of A1AR deficiency on body weight also has been reported by Johansson et al. (11), who observed significantly higher body weights in A1AR−/− mice at ≥5 months of age. Although locomotor activity was similar between genotypes, the weight gain of A1AR-deficient mice was associated with a significantly higher food and water intake, suggesting an impairment of regulation of energy balance. Although wild-type mice fed an HFD gained weight compared with standard diet–fed mice of both groups (Fig. 1), the HFD further enhanced the difference of glucose intolerance between A1AR−/− and wild-type mice. These effects were a result of an increasing failure of compensatory insulin secretion in A1AR−/− (Figs. 4C and 5).
Although a significant impairment in glucose tolerance was noted in the A1AR−/− mice already shortly after weaning (Fig. 4A), the difference in body weight only became significant when the mice reached adulthood. The age dependence of growth rate may result from differentially regulated humoral factors affecting fat metabolism, such as growth hormone, or adipokines, such as adiponectin and leptin (30–36). In isolated white adipocytes and epididymal fat pads, ADO mediates and positively regulates the effect of insulin on leptin release, probably via the phosphokinase C/phospholipase C activation caused by A1AR stimulation (34,35). Leptin then negatively controls caloric intake and increases energy expenditure. However, our data indicate that the insulin resistance in A1AR-deficient mice is not caused by a reduced leptin expression (Fig. 2A). ADO/A1AR signaling maintains a tonic inhibition of lipolysis in WAT in vitro. Specific blockade of the A1AR receptor or ADO deprivation by supraphysiological doses of adenosine deaminase leads to maximal lipolysis (36). Therefore, in isolated white adipocytes, a functional A1AR-signaling system seems to counterbalance a leptin-induced lipolysis by means of a negative-feedback loop. However, leptin effects, as concluded from in vitro findings, would be suspected to lead to lipolysis in A1AR-deficient mice, an expectation not supported by our measurements of FFAs (Fig. 2C). The significant elevation of leptin in A1AR−/− parallels the increased body fat mass but does not play a causal role for the insulin-resistant phenotype of the A1AR−/− mice. Adiponectin remained unchanged in A1AR−/− (Fig. 2B). Hence, the increased body fat mass of the A1AR−/− mice reflects a complexity of fat metabolism in vivo that is not mimicked sufficiently by in vitro studies. For example, the direct inhibitory effect of ADO/A1AR signaling on key enzymes of lipid regulation, such as the hormone-sensitive lipase and the adipose triglycerate lipase, has been deduced from experimental evidence but has not yet been demonstrated in vivo (37). The fat, glucose-intolerant A1AR−/− phenotype might hint toward the existence of functionally different effects of ADO signaling in lean compared with obese animals (38,39). Another possible mechanism for the different body composition and faster weight gain of A1AR−/− mice could be a disturbance of the hypothalamic regulation of food consumption and energy expenditure, which can result in a progressive and significant weight gain (30,31). The hypothalamic-derived orexins/hypocretins control arousal during the sleep/wake cycle, stimulate food intake after awakening, and promote pro-obese metabolic effects. Thus, these molecules are regarded as sensors for metabolism and arousal in the central nervous system and thereby participate in the hormonal cyclic regulation of metabolic homeostasis. In mammals, the disruption of circadian rhythms is involved in the development of metabolic syndrome and obesity. This has been shown in narcoleptic humans, who, being deficient in orexin/hypocretin signaling, have a tendency toward obesity (40–42). Of interest, the expression of orexin/hypocretin is negatively controlled by ADO/A1AR signaling (43,44). ADO/A1AR effects include sleep-promoting via control of orexinergic tone in rats, thereby exerting an influence on hypothalamic circadian rhythm (45,46). Moreover, specific ADO/A1AR stimuli at higher doses decrease behavioral food consumption in rats (47). Thus, the seemingly paradox weight gain in A1AR−/− mice may be caused by an orexin/hypocretin-induced disturbance of the hypothalamic hormonal circadian regulation followed by increased food consumption, weight gain, obesity, and metabolic syndrome.
Summary and outlook.
Our data demonstrate that disturbed glucose tolerance is part of the phenotype of A1AR deficiency. This phenotype is accompanied by pronounced insulin resistance and possibly dysfunctional insulin secretion regulation. Our data indicate that the hypothesized effects of ADO/A1AR signaling on glucose and fat metabolism, as derived from in vitro data, may not always reflect those seen in the in vivo situation. Currently available data do not allow the specification of a hypothesis to satisfactorily explain the increased body weight and total body-fat fraction of the A1AR−/− mice. However, we hypothesize that central hypothalamic effects of the missing ADO/A1AR signal on the control of food intake and energy expenditure dominate peripheral adipokine effects, leading to net weight gain, fat deposition, disturbed glucose tolerance, and insulin resistance.
ACKNOWLEDGMENTS
This work was funded by a postdoctoral fellowship award of the National Institutes of Health (NIH) (to R.F.-W.).
No potential conflicts of interest relevant to this article were reported.
R.F.-W. planned the project, performed the experiments, and wrote and edited the manuscript. W.J., D.M., L.L., J.Z., and S.M.K. performed the experiments. Y.H. bred and genotyped the mice. M.C. performed and supervised the experiments. J.P.B. and O.G. participated in planning the project and wrote and reviewed the manuscript. J.B.S. participated in planning the project, wrote and reviewed the manuscript, and supervised the experimentation.
Parts of this study were presented in abstract form at the Mid-Atlantic Diabetes Research Symposium, Bethesda, Maryland, June 2006; at the Meeting of the Deutsche Diabetes Gesellschaft, Munich, Germany, 30 April–3 May 2008; and at the Meeting of the Deutsche Diabetes Gesellschaft, Leipzig, Germany, 1–4 June 2011.
The authors thank S. Pack, formerly National Institute of Diabetes and Digestive and Kidney Diseases (NIH), for valuable technical support during clamp studies.
REFERENCES
- 1.Fredholm BB, IJzerman AP, Jacobson KA, Klotz KN, Linden J. International Union of Pharmacology: XXV. Nomenclature and classification of adenosine receptors. Pharmacol Rev 2001;53:527–552 [PMC free article] [PubMed] [Google Scholar]
- 2.Thong FS, Graham TE. The putative roles of adenosine in insulin- and exercise-mediated regulation of glucose transport and glycogen metabolism in skeletal muscle. Can J Appl Physiol 2002;27:152–178 [DOI] [PubMed] [Google Scholar]
- 3.Leighton B, Lozeman FJ, Vlachonikolis IG, Challiss RA, Pitcher JA, Newsholme EA. Effects of adenosine deaminase on the sensitivity of glucose transport, glycolysis and glycogen synthesis to insulin in muscles of the rat. Int J Biochem 1988;20:23–27 [DOI] [PubMed] [Google Scholar]
- 4.Challiss RA, Richards SJ, Budohoski L. Characterization of the adenosine receptor modulating insulin action in rat skeletal muscle. Eur J Pharmacol 1992;226:121–128 [DOI] [PubMed] [Google Scholar]
- 5.Xu B, Berkich DA, Crist GH, LaNoue KF. A1 adenosine receptor antagonism improves glucose tolerance in Zucker rats. Am J Physiol 1998;274:E271–E279 [DOI] [PubMed] [Google Scholar]
- 6.Langfort J, Budohoski L, Dubaniewicz A, Challiss RA, Newsholme EA. Exercise-induced improvement in the sensitivity of the rat soleus muscle to insulin is reversed by chloroadenosine: the adenosine receptor agonist. Biochem Med Metab Biol 1993;50:18–23 [DOI] [PubMed] [Google Scholar]
- 7.Vergauwen L, Hespel P, Richter EA. Adenosine receptors mediate synergistic stimulation of glucose uptake and transport by insulin and by contractions in rat skeletal muscle. J Clin Invest 1994;93:974–981 [DOI] [PMC free article] [PubMed] [Google Scholar]
- 8.Derave W, Hespel P. Role of adenosine in regulating glucose uptake during contractions and hypoxia in rat skeletal muscle. J Physiol 1999;515:255–263 [DOI] [PMC free article] [PubMed] [Google Scholar]
- 9.Han DH, Hansen PA, Nolte LA, Holloszy JO. Removal of adenosine decreases the responsiveness of muscle glucose transport to insulin and contractions. Diabetes 1998;47:1671–1675 [DOI] [PubMed] [Google Scholar]
- 10.Faulhaber-Walter R, Chen L, Oppermann M, et al. Lack of A1 adenosine receptors augments diabetic hyperfiltration and glomerular injury. J Am Soc Nephrol 2008;19:722–730 [DOI] [PMC free article] [PubMed] [Google Scholar]
- 11.Johansson SM, Lindgren E, Yang JN, Herling AW, Fredholm BB. Adenosine A1 receptors regulate lipolysis and lipogenesis in mouse adipose tissue-interactions with insulin. Eur J Pharmacol 2008;597:92–101 [DOI] [PubMed] [Google Scholar]
- 12.Sun D, Samuelson LC, Yang T, et al. Mediation of tubuloglomerular feedback by adenosine: evidence from mice lacking adenosine 1 receptors. Proc Natl Acad Sci USA 2001;98:9983–9988 [DOI] [PMC free article] [PubMed] [Google Scholar]
- 13.Taicher GZ, Tinsley FC, Reiderman A, Heiman ML. Quantitative magnetic resonance (QMR) method for bone and whole-body-composition analysis. Anal Bioanal Chem 2003;377:990–1002 [DOI] [PubMed] [Google Scholar]
- 14.Belfiore F, Iannello S, Volpicelli G. Insulin sensitivity indices calculated from basal and OGTT-induced insulin, glucose, and FFA levels. Mol Genet Metab 1998;63:134–141 [DOI] [PubMed] [Google Scholar]
- 15.Blouet C, Mariotti F, Mathe V, Tome D, Huneau JF. Nitric oxide bioavailability and not production is first altered during the onset of insulin resistance in sucrose-fed rats. Exp Biol Med (Maywood) 2007;232:1458–1464 [DOI] [PubMed] [Google Scholar]
- 16.Toyoshima Y, Gavrilova O, Yakar S, et al. Leptin improves insulin resistance and hyperglycemia in a mouse model of type 2 diabetes. Endocrinology 2005;146:4024–4035 [DOI] [PubMed] [Google Scholar]
- 17.Kolnes AJ, Ingvaldsen A, Bolling A, et al. Caffeine and theophylline block insulin-stimulated glucose uptake and PKB phosphorylation in rat skeletal muscles. Acta Physiol (Oxf) 2010;200:65–74 [DOI] [PubMed] [Google Scholar]
- 18.Hespel P, Richter EA. Role of adenosine in regulation of carbohydrate metabolism in contracting muscle. Adv Exp Med Biol 1998;441:97–106 [DOI] [PubMed] [Google Scholar]
- 19.Maeda T, Koos BJ. Adenosine A1 and A2a receptors modulate insulinemia, glycemia, and lactatemia in fetal sheep. Am J Physiol Regul Integr Comp Physiol 2009;296:R693–R701 [DOI] [PMC free article] [PubMed] [Google Scholar]
- 20.Thong FS, Lally JS, Dyck DJ, Greer F, Bonen A, Graham TE. Activation of the A1 adenosine receptor increases insulin-stimulated glucose transport in isolated rat soleus muscle. Appl Physiol Nutr Metab 2007;32:701–710 [DOI] [PubMed] [Google Scholar]
- 21.Liu IM, Tzeng TF, Tsai CC, Lai TY, Chang CT, Cheng JT. Increase in adenosine A1 receptor gene expression in the liver of streptozotocin-induced diabetic rats. Diabetes Metab Res Rev 2003;19:209–215 [DOI] [PubMed] [Google Scholar]
- 22.Dong Q, Ginsberg HN, Erlanger BF. Overexpression of the A1 adenosine receptor in adipose tissue protects mice from obesity-related insulin resistance. Diabetes Obes Metab 2001;3:360–366 [DOI] [PubMed] [Google Scholar]
- 23.Dhalla AK, Wong MY, Voshol PJ, Belardinelli L, Reaven GM. A1 adenosine receptor partial agonist lowers plasma FFA and improves insulin resistance induced by high-fat diet in rodents. Am J Physiol Endocrinol Metab 2007;292:E1358–E1363 [DOI] [PubMed] [Google Scholar]
- 24.Hettinger BD, Leid M, Murray TF. Cyclopentyladenosine-induced homologous down-regulation of A1 adenosine receptors (A1AR) in intact neurons is accompanied by receptor sequestration but not a reduction in A1AR mRNA expression or G protein alpha-subunit content. J Neurochem 1998;71:221–230 [DOI] [PubMed] [Google Scholar]
- 25.Johansson SM, Salehi A, Sandström ME, et al. A1 receptor deficiency causes increased insulin and glucagon secretion in mice. Biochem Pharmacol 2007;74:1628–1635 [DOI] [PubMed] [Google Scholar]
- 26.Johansson SM, Yang JN, Lindgren E, Fredholm BB. Eliminating the antilipolytic adenosine A1 receptor does not lead to compensatory changes in the antilipolytic actions of PGE2 and nicotinic acid. Acta Physiol (Oxf) 2007;190:87–96 [DOI] [PubMed] [Google Scholar]
- 27.Klip A. The many ways to regulate glucose transporter 4. Appl Physiol Nutr Metab 2009;34:481–487 [DOI] [PubMed] [Google Scholar]
- 28.Duflot S, Riera B, Fernández-Veledo S, et al. ATP-sensitive K(+) channels regulate the concentrative adenosine transporter CNT2 following activation by A(1) adenosine receptors. Mol Cell Biol 2004;24:2710–2719 [DOI] [PMC free article] [PubMed] [Google Scholar]
- 29.Yasuda N, Inoue T, Horizoe T, et al. Functional characterization of the adenosine receptor contributing to glycogenolysis and gluconeogenesis in rat hepatocytes. Eur J Pharmacol 2003;459:159–166 [DOI] [PubMed] [Google Scholar]
- 30.List EO, Palmer AJ, Berryman DE, Bower B, Kelder B, Kopchick JJ. Growth hormone improves body composition, fasting blood glucose, glucose tolerance and liver triacylglycerol in a mouse model of diet-induced obesity and type 2 diabetes. Diabetologia 2009;52:1647–1655 [DOI] [PubMed] [Google Scholar]
- 31.Solomon SS, Schwartz Y, Rawlinson T. Lipolysis in diabetic adipocytes: differences in response to growth hormone and adenosine. Endocrinology 1987;121:1056–1060 [DOI] [PubMed] [Google Scholar]
- 32.Ohisalo JJ, Stouffer JE. Adenosine, thyroid status and regulation of lipolysis. Biochem J 1979;178:249–251 [DOI] [PMC free article] [PubMed] [Google Scholar]
- 33.Antuna-Puente B, Feve B, Fellahi S, Bastard JP. Adipokines: the missing link between insulin resistance and obesity. Diabetes Metab 2008;34:2–11 [DOI] [PubMed] [Google Scholar]
- 34.Cheng JT, Liu IM, Chi TC, et al. Role of adenosine in insulin-stimulated release of leptin from isolated white adipocytes of Wistar rats. Diabetes 2000;49:20–24 [DOI] [PubMed] [Google Scholar]
- 35.Rice AM, Fain JN, Rivkees SA. A1 adenosine receptor activation increases adipocyte leptin secretion. Endocrinology 2000;141:1442–1445 [DOI] [PubMed] [Google Scholar]
- 36.Frühbeck G, Gómez-Ambrosi J, Salvador J. Leptin-induced lipolysis opposes the tonic inhibition of endogenous adenosine in white adipocytes. FASEB J 2001;15:333–340 [DOI] [PubMed] [Google Scholar]
- 37.Dhalla AK, Chisholm JW, Reaven GM, Belardinelli L. A1 adenosine receptor: role in diabetes and obesity. Handb Exp Pharmacol 2009;271–295 [DOI] [PubMed]
- 38.Kaartinen JM, LaNoue KF, Ohisalo JJ. Quantitation of inhibitory G-proteins in fat cells of obese and normal-weight human subjects. Biochim Biophys Acta 1994;1201:69–75 [DOI] [PubMed] [Google Scholar]
- 39.van Schaick EA, Zuideveld KP, Tukker HE, Langemeijer MW, Ijzerman AP, Danhof M. Metabolic and cardiovascular effects of the adenosine A1 receptor agonist N6-(p-sulfophenyl)adenosine in diabetic Zucker rats: influence of the disease on the selectivity of action. J Pharmacol Exp Ther 1998;287:21–30 [PubMed] [Google Scholar]
- 40.Adamantidis A, de Lecea L. The hypocretins as sensors for metabolism and arousal. J Physiol 2009;587:33–40 [DOI] [PMC free article] [PubMed] [Google Scholar]
- 41.Froy O. The relationship between nutrition and circadian rhythms in mammals. Front Neuroendocrinol 2007;28:61–71 [DOI] [PubMed] [Google Scholar]
- 42.Tsujino N, Sakurai T. Orexin/hypocretin: a neuropeptide at the interface of sleep, energy homeostasis, and reward system. Pharmacol Rev 2009;61:162–176 [DOI] [PubMed] [Google Scholar]
- 43.Liu ZW, Gao XB. Adenosine inhibits activity of hypocretin/orexin neurons by the A1 receptor in the lateral hypothalamus: a possible sleep-promoting effect. J Neurophysiol 2007;97:837–848 [DOI] [PMC free article] [PubMed] [Google Scholar]
- 44.Thakkar MM, Winston S, McCarley RW. Orexin neurons of the hypothalamus express adenosine A1 receptors. Brain Res 2002;944:190–194 [DOI] [PubMed] [Google Scholar]
- 45.Thakkar MM, Engemann SC, Walsh KM, Sahota PK. Adenosine and the homeostatic control of sleep: effects of A1 receptor blockade in the perifornical lateral hypothalamus on sleep-wakefulness. Neuroscience 2008;153:875–880 [DOI] [PubMed] [Google Scholar]
- 46.Thakkar MM, Winston S, McCarley RW. A1 receptor and adenosinergic homeostatic regulation of sleep-wakefulness: effects of antisense to the A1 receptor in the cholinergic basal forebrain. J Neurosci 2003;23:4278–4287 [DOI] [PMC free article] [PubMed] [Google Scholar]
- 47.Coupar IM, Tran BL. Effects of adenosine agonists on consumptive behaviour and body temperature. J Pharm Pharmacol 2002;54:289–294 [DOI] [PubMed] [Google Scholar]


