Abstract
Purpose
To validate a method called bi-ventricular strain unwrapped phase (BiSUP) for reconstructing three-dimensional plus time (3D+t) biventricular strain maps from phase-unwrapped harmonic phase (HARP) images derived from tagged cardiac magnetic resonance imaging (MRI).
Materials and Methods
A set of 30 human subjects were imaged with tagged MRI. In each study, HARP phase was computed and unwrapped in each short-axis and long-axis image. Inconsistencies in unwrapped phase were resolved using branch cuts manually placed with a graphical user interface. 3D strain maps were computed independently in each imaged time frame through systole and mid diastole in each study. The BiSUP strain and displacements were compared to those estimated by a 3D feature-based (FB) technique and a 2D+t HARP technique.
Results
The standard deviation of the difference between strains measured by the FB and the BiSUP methods was less than 4% of the average of the strains from the two methods. The correlation between peak minimum principal strain measured using the BiSUP and HARP techniques was over 83%.
Conclusion
The BiSUP technique can reconstruct full 3D+t strain maps from tagged MR images through the cardiac cycle in a reasonable amount of time and user interaction compared to other 3D analysis methods.
Keywords: phase unwrapping, branch cuts, harmonic phase, tagged magnetic resonance imaging, biventricular strain, 4D strain
INTRODUCTION
Accurate measurement of cardiac ventricular mechanical function is important for diagnosing and managing patients with heart disease and assessing the efficacy of therapies over time. The right ventricle (RV) plays a vital role in cardiac function and is adversely affected by many cardiac and pulmonary diseases. Compared to the left ventricle (LV), RV functional analysis is relatively difficult due to its lack of geometric symmetry and relatively thin wall.
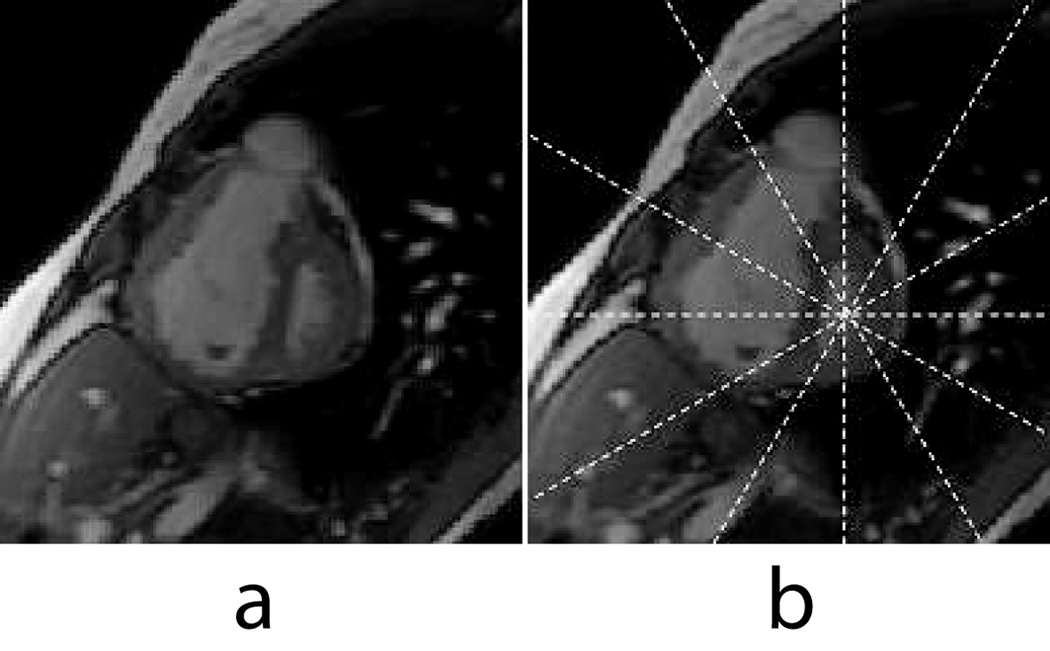
Accurate assessment of right ventricular (RV) function is particularly important in patients with pulmonary hypertension (PAH) and congestive heart failure. Also, in PAH, relatively higher systolic pressure in the RV can cause excursion of the inter-ventricular septum into the LV cavity (see Figure 1a). As a result, the LV cavity can also lose its geometric symmetry which is assumed in many 3D LV deformation models (1–5).
Figure 1.
(a) Basal short-axis slice of a PAH patient near end-systole. (b) Same image with the radially-oriented long axis prescriptions shown.
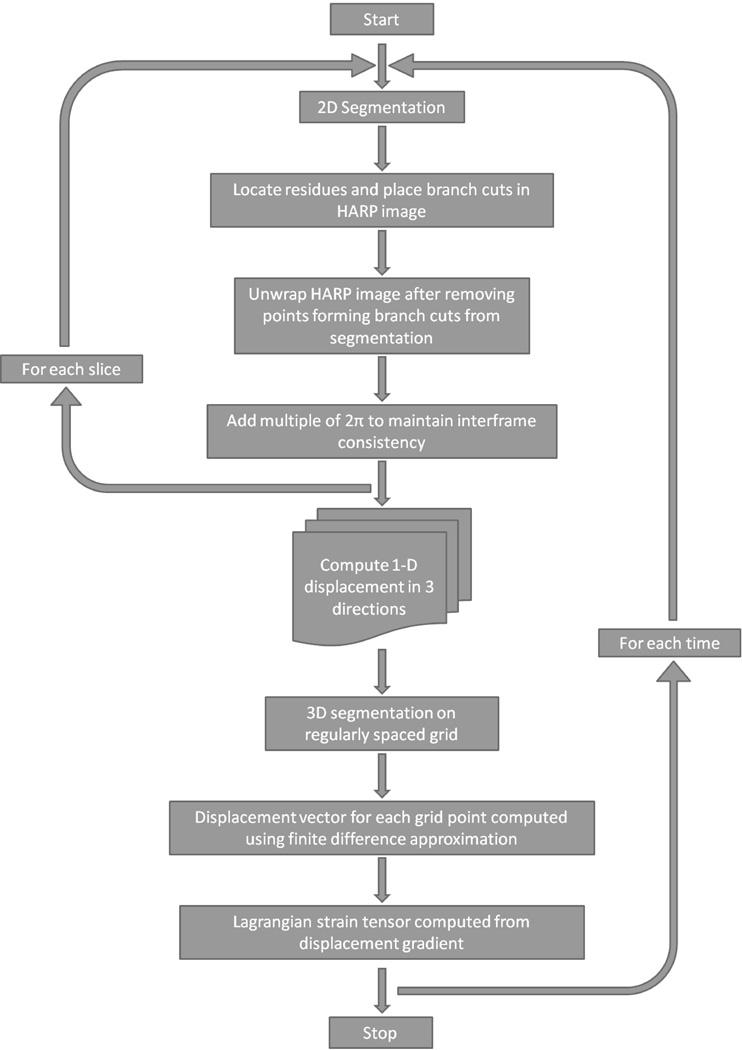
In (6), the strain from unwrapped phase (SUP) method was presented for computing three-dimensional plus time (3D+t) strain in the LV. The SUP method is based on unwrapping 2D harmonic phase (HARP) images (7) from tagged MRI and a prolate-spheroidal deformation model (5). The SUP strains compared well with strains from 3D feature-based methods (5) and (wrapped) 2D HARP (7), but the prolate-spheroidal deformation model does not fit the RV geometry and is difficult to extend to a biventricular model. The discrete model free (DMF) model proposed by Denney and McVeigh (8), however, is geometry independent and can be easily adapted to biventricular morphology. Also, the unwrapped HARP produces displacement measurements at each pixel, which is useful when estimating the deformation of the thin-walled RV. A flowchart of the entire procedure is shown in Figure 2 and is explained in detail in the next section.
Figure 2.
A flowchart detailing the entire procedure involved obtaining 3D+t strains from tagged MR images.
In this paper, myocardial displacements from unwrapped HARP in both the RV and LV were used with DMF deformation to reconstruct 3D+t biventricular strain in each imaged timeframe through systole and early diastole. We refer to this method as the biventricular strain unwrapped phase (BiSUP) technique. The BiSUP technique produces 3D+t biventricular displacements and strains with minimal manual intervention and with high spatial resolution. Results are presented in normal volunteers, patients with LV hypertension (HTN), patients with PAH, and diabetic patients with myocardial infarction (DMI).
MATERIALS AND METHODS
Human Subjects
The BiSUP algorithm was validated on a cohort of 30 human subjects. This cohort consisted of 10 normal volunteers (39–60 years of age, 5 female, 5 male, all Caucasian), 7 patients with pulmonary hypertension (PAH, 28–54 years of age, 3 female, 7 male, all Caucasian), , 8 patients with hypertension (HTN, 45–66 years of age, 2 female, 6 male, 6 Caucasian, 2 African American), and 5 patients with diabetes mellitus and myocardial infarction (MI) (50–60 years of age, 1 female, 4 male, 4 Caucasian, 1 Asian). Diagnosis of recent acute MI was made based on appropriate clinical presentation and elevated cardiac enzymes (troponin > 0.78 ng/ml). These patient groups were selected based on the availability of image data to provide a diverse set of LV and RV strains and strain rates for validation purposes. All human studies were approved by the Institutional Review Boards of both institutions and informed consent was obtained from all participants.
Magnetic Resonance Imaging
All participants underwent MRI on a 1.5T MRI scanner (GE Healthcare, Milwaukee, WI) optimized for cardiac application. Standard short-axis cardiac views were obtained resulting on average 12 short-axis slices. Six, equally-spaced, radially-oriented long-axis views (see Figure 1b) were obtained, which resulted in 2–3 long-axis slices through the RV free wall, with a fast gradient-echo cine sequence with the following parameters: FOV = 360 mm, image matrix = 224×256, flip angle = 45, TE = 1.82ms, TR = 5.2ms, number of cardiac phases = 20, slice thickness = 8 mm. A 2D fast gradient recalled spatial modulation of magnetization (FGR-SPAMM) tagging preparation was done with a tag spacing of 7 pixels. The tagged imaging protocol was optimized for patient comfort and required typically 16 seconds or less per slice with one breath-hold per slice.
Strain Computation
An overview of the BiSUP algorithm is shown in Figure 2. First, in a given timeframe, 2D HARP images were unwrapped in each slice. Displacement measurements from the phase-unwrapped images were then used to compute a 3D displacement field from which strain was computed. This procedure was repeated for each imaged timeframe. Details of each step are provided below.
Segmentation
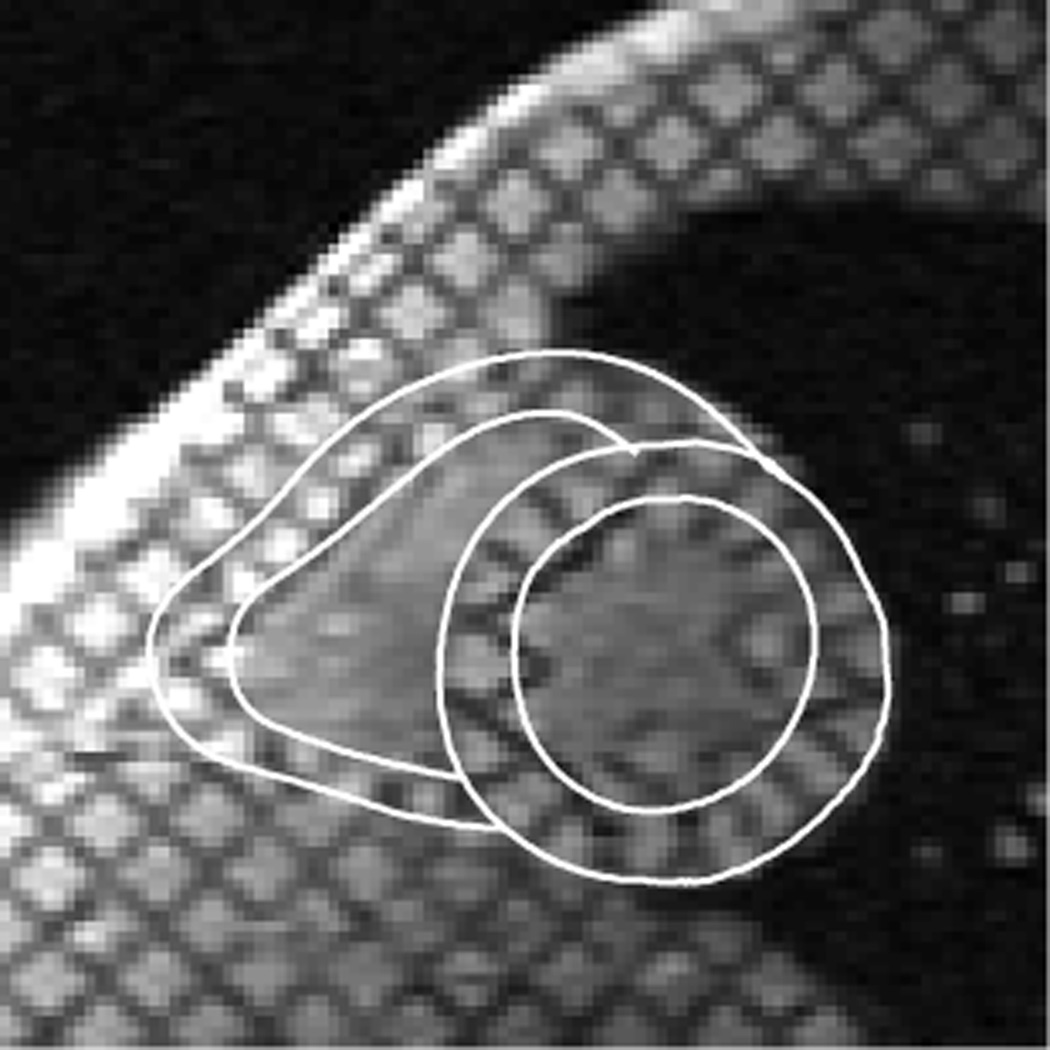
Myocardial contours modeled using active contours were semi-automatically drawn at end-diastole (ED) and end-systole (ES) timeframes for all slices (see Figure 3). In the short-axis images, two closed contours (LV endo-contour and LV epi-contour) were drawn for the left ventricle and two open contours (RV endo-contour and RV epi-contour) were drawn for the right ventricle. In the long-axis images, all four were open contours. The RV contours connected to the LV epi-contour at the insertion points. These contours were then propagated to all time frames (9). Note that the RV contours were drawn so that the RV wall is thicker than one would expect from a physiological standpoint. The rationale for drawing contours in this manner is described in the Discussion.
Figure 3.
A short-axis slice in a normal volunteer at end-systole showing user-input RV and LV contours for the segmentation of the myocardium.
Displacement Estimation
3D displacement was measured from the unwrapped HARP phase method described in (6). Phase unwrapping involves adding integer multiples of 2π to the wrapped phase so that the unwrapped phase is continuous. A quality-guided path-following method, also used by Spottiswoode et al (10) to unwrap wrapped DENSE images, is used to unwrap the wrapped HARP phase images.
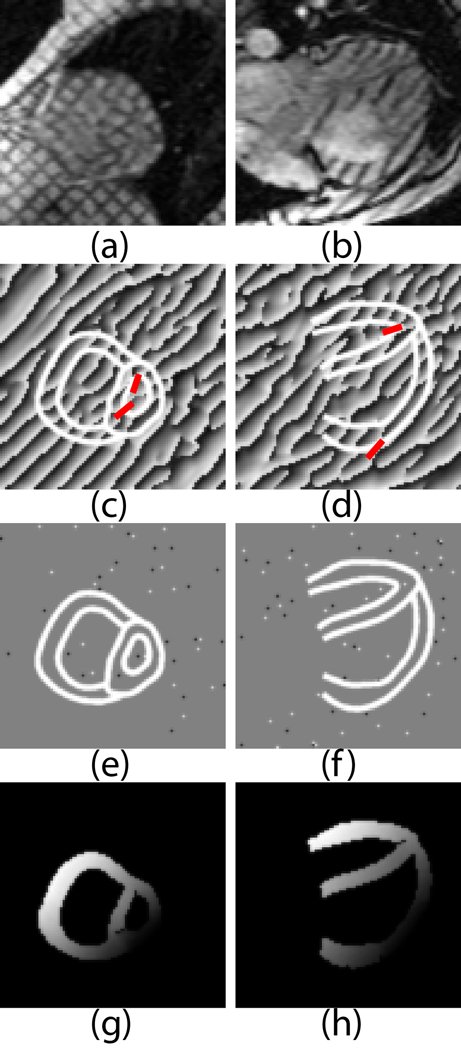
The unwrapped-phase method described uses residues (11) to detect inconsistencies in the wrapped HARP phase. Residues were computed by locally unwrapping a 2×2 neighborhood of each pixel in the region of interest. Phase inconsistencies were corrected using the residue compensation method (11), where residues were removed by connecting residues with branch cuts. Branch cuts are lines in the image where an unwrapping path is not allowed to cross. Branch cuts are specified by the user with a graphical user interface (GUI). Branch cut placement in the RV is an extension of the method used for the LV in (6). Since the LV and RV contours are connected at the RV insertion points, the two ventricles are unwrapped as a single entity.
Figure 4 shows the effect of branch cuts and the resulting unwrapped phase maps in a short-axis and a long-axis image. Once branch cuts were placed, the phase unwrapping technique described above resulted in a smooth unwrapped phase map as shown in Figure 4 (4g and 4h). Note that after branch cuts are placed, the unwrapped phase is independent of the path taken during the unwrapping process.
Figure 4.
Phase Unwrapping example in a short-axis slice (left column) and a long-axis slice (right column) of a patient with pulmonary hypertension: (a–b) Tagged short-axis images acquired near end-systole; (c–d) HARP images obtained from a and b with branch cuts drawn(red lines).. White contours delineate the myocardium. ; (e–f) HARP negative (black) and positive (white) residues in the HARP images in (c–d); (g–h) unwrapped HARP image with branch cuts.
Each image was unwrapped independently and the starting point for phase unwrapping may correspond to a different material point in each image. As a result, the unwrapped phases in two adjacent timeframes may differ by an integer multiple of 2π. As in (6), this difference was corrected by adding the integer multiple of 2π to all unwrapped phases in the current timeframe. The multiple was chosen to minimize the L1 norm of all displacements between the current and previous timeframes.
Once the phases were unwrapped, 1-D displacements were measured from each pixel in the myocardium similar to those measured from tag-line tracking data (12).
Strain Computation
The DMF technique (8) was used to reconstruct 3D biventricular strains at each imaged timeframe from 1D displacement measurements. The DMF technique makes no assumptions about the geometry of the object being analyzed, so both LV and RV strains can be reconstructed as a single object. In addition, because the DMF technique uses finite difference analysis, it does not require a specific co-ordinate system for the reconstruction (13).
The method proceeded as follows to reconstruct displacement and strain from tag lines and user-defined myocardial contours. For each imaged time frame, the DMF first constructed a 3D segmentation of the LV and RV walls on a regularly spaced discrete grid of points from the user-defined endocardial and epicardial contours. The grid spacing was equal to the pixel size in the MR image. A displacement vector was estimated for each grid point in the LV and RV segmentation that maps the grid point back to its end-diastolic position using finite difference analysis. A smoothness constraint minimized the spatial variation of the displacement gradient across the myocardium. The result was a collection of displacement fields defined on the end-diastolic grid that mapped the trajectory of each point through the cardiac cycle. The displacement gradient was then computed at each point on the end-diastolic grid using a finite difference derivative approximation averaged over a 3 × 3 × 3 point neighborhood. Finally the Lagrangian strain tensor was computed from the displacement gradient.
Strains in each ventricle were rotated to a prolate spheroidal coordinate system specific to that ventricle (5). For the LV, the coordinate system was centered along a central axis passing through the centroid of the LV endocardial contour in a basal short-axis slice and perpendicular to the short-axis image planes. For the RV, the coordinate system was centered along a central axis passing through the centroid of the RV endocardial contour in a basal short-axis slice and the centroid of the RV endocardial contours in a short-axis slice near the RV apex. In both the LV and RV coordinate systems, coordinate system center was located on the central axis 2/3 of the distance from the apex to the base, and the focal point was set so that the average radial coordinate was as close to 1 as possible. Strains were computed at each point in the end-diastolic grid in the circumferential and longitudinal directions of the prolate coordinate system. The minimum principal strain at each point was also computed. In the LV, the circumferential, longitudinal, and minimum principal strains were denoted as Ecc, Ell, and E3 respectively. In the RV, these strains were denoted as EccRV, EllRV, and E3RV. In addition, 3D torsion in degrees was computed for the LV.
Validation Experiments
The BiSUP technique was validated on the cohort of 30 human subjects described above. In each subject, 3D strain was computed in all imaged timeframes using the BiSUP technique. To validate 3D strain reconstruction, 3D strain was computed at end-systole (ES) with the feature-based (FB) technique in (8), which also uses the DMF strain reconstruction technique. The tags were tracked using the FB technique and then manually corrected by an expert.
To assess the accuracy of 1D displacement measurements obtained from unwrapped phase images, 1D displacement measurements were computed from tag lines tracked in the FB method and compared to 1D measurements computed from the unwrapped phase images at the tracked tag line points. The accuracy of 3D strains at end-systole was assessed by comparing BiSUP strains and FB strains with paired t-tests, measuring the coefficient of variation and Bland-Altman plots.
To validate the evolution of strains over time, BiSUP strains were compared to 2D strain in each timeframe computed using HARP analysis (7). 2D LV torsion using HARP was measured using the procedure described in (14). One slice each at the basal and apical levels was used to compute torsion. The basal slice chosen was the slice closest to and below the mitral valve at the end-systolic (ES) phase. The apical slice chosen was the slice closest to the apex where the blood pool could be identified. A mesh consisting of 3 concentric rings and 24 circumferential points was defined in each slice at end-diastole (ED) from semi-automatically-drawn contours. Each mesh was tracked through all time frames using the improved harmonic phase (HARP) method for motion tracking (15). The accuracy of strains versus time was assessed by comparing peak strains and strain rates computed using BiSUP and HARP with paired t-tests. In all statistical comparisons, a p-value of 0.05 or less was considered statistically significant.
The inter-user and intra-user variability analysis of the BiSUP method was performed by 3 users trained in cardiac MRI analysis, who were not involved in algorithm development. A set of 12 human subjects, including 3 normal subjects, 3 diabetic patients with myocardial infarction, 3 patients with hypertension and 3 patients with pulmonary hypertension, were randomly selected for analysis. For each subject, inconsistencies in the unwrapped phase for all long-axis and short-axis slices were resolved manually by each user, independently. 3D end systolic strains were then computed for each study. Furthermore, each user performed the analysis described above three times on a randomly selected subject with a different subject for each user. The inter-user variability was determined based on comparisons of differences between each user using all strain parameters. The intra-user variability was determined based on the comparisons of the differences between each trial from each user using all strain parameters. Both analyses were performed using repeated measures ANOVA model (16) via SAS software (Statistical Analysis System version 9.1.3). A compound symmetry correlation structure was assumed in both analyses to account for the repeated measurements within subject. A P value less than 0.05 was considered significant.
RESULTS
Biventricular Strain
Computation time
All studies were processed using the BiSUP technique described above, which was implemented in MATLAB (The Mathworks Inc, Natick, MA). Unwrapping all images in a study took less than a minute on a 2.6GHz Core2 Duo processor with 4 GB of memory. Approximately 60 minutes per study of user interaction were required to resolve residues. Strain reconstruction took approximately 30 minutes per study of automatic computation. The total time required to analyze 20 time frames of a typical study was 90 minutes.
Comparison of Displacement Estimates with Feature-Based Technique
Table 1 shows statistics of the differences between 1D displacement measurements computed from unwrapped phase images and tracked tag lines at end-systole. The BiSUP and tag line methods showed excellent agreement on long-axis images and short-axis images in the proximal and middle thirds of the LV (relative to the base). Less agreement was observed in the distal third of the LV.
Table 1.
Comparison of displacement measurements computed from BiSUP at tracked tag lines at end-systole. Proximal, middle, and distal refer to the LV base.
| Slices | Mean Difference (pixels) |
Standard Deviation (pixels) |
Measurement differences > 2 pixels |
|---|---|---|---|
| All slices | 0.03 | 0.51 | 0.73 % |
| Long-axis | 0.03 | 0.44 | 0.75 % |
| Short-axis - Proximal 3rd | 0.00 | 0.44 | 0.38 % |
| Short-axis - Middle 3rd | 0.06 | 0.55 | 0.79 % |
| Short-axis - Distal 3rd | 0.10 | 0.69 | 1.46 % |
Difference = BiSUP – tag line.
Comparison of End-Systolic Strains with Feature-Based Technique
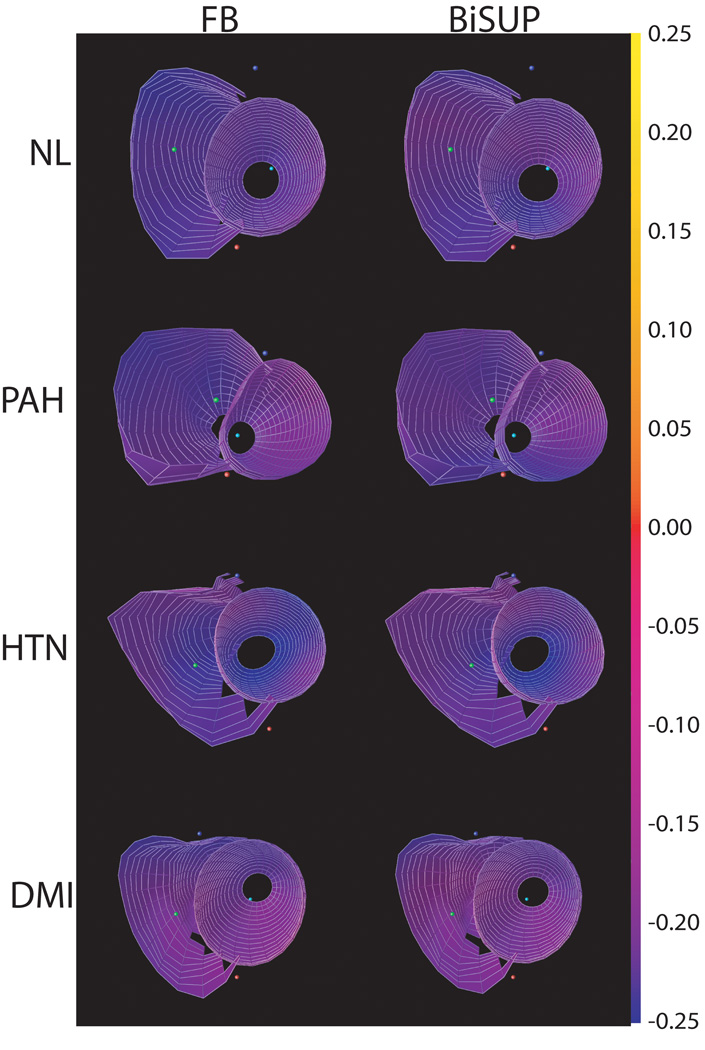
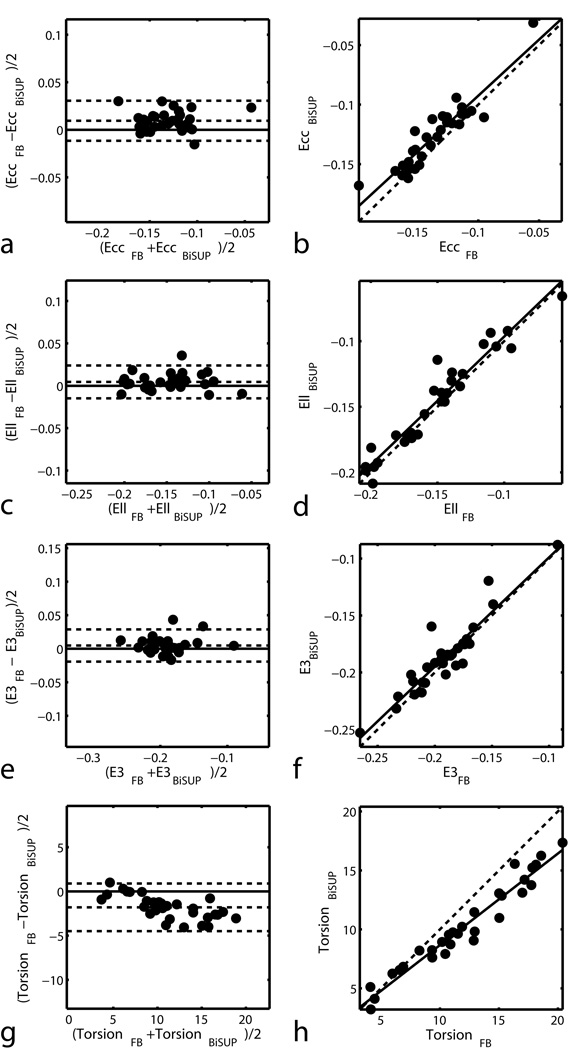
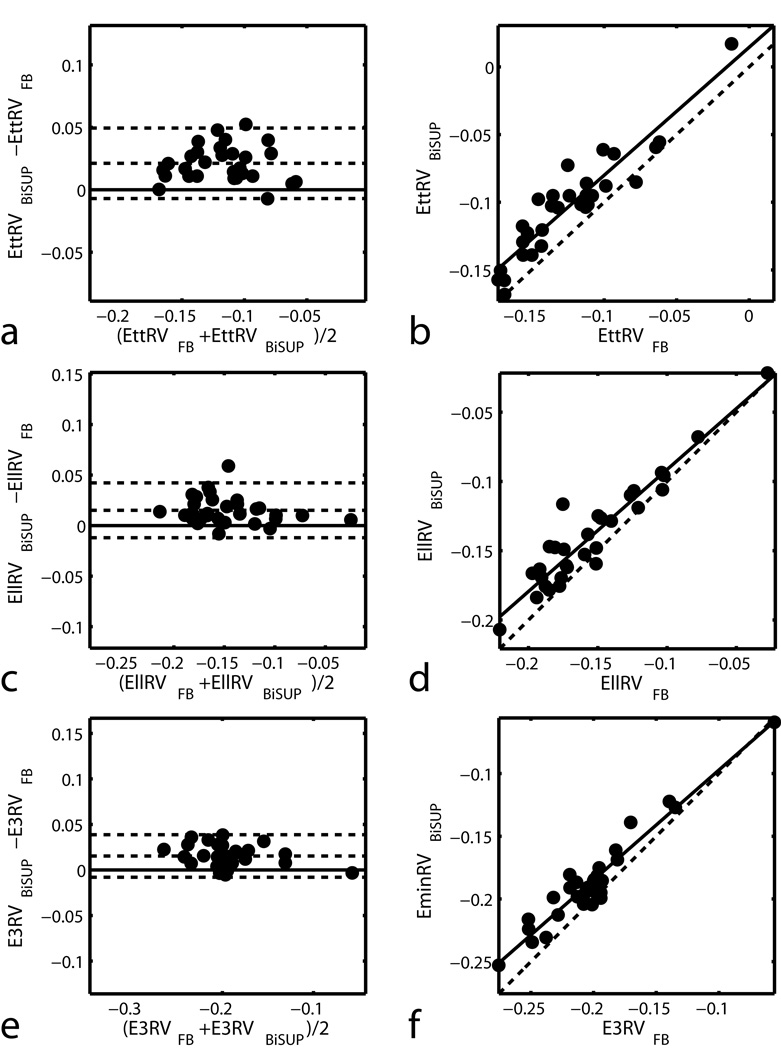
Figure 5 shows the maps of 3D minimum principal strain (E3) in a representative normal human volunteer computed using BiSUP method and the FB method. The same DMF reconstruction method was used to reconstruct strain in both methods. Note that strain is computed in the entire LV and RV, except the apex which is typically not included in this type of analysis. The strains maps are similar. Table 2 shows statistics of the difference between the BiSUP and FB methods. In all strains in Table 2, the standard deviation of the difference is less than 4% of the average of the two methods. The differences between the computed strains are small with no significant difference found in the LV. Comparisons between the two sets of strains are displayed in Bland-Altman and correlation plots shown in Figure 6 and Figure 7.
Figure 5.
Maps of minimum principal strain (E3) using feature-based (left) and BiSUP (right) methods for a normal volunteer (NL), and patients with pulmonary hypertension (PAH), LV hypertension (HTN) and diabetics with myocardial infarction (DMI). Strains are mapped from blue = −25% to yellow = +25%. The anterior LV wall is at the bottom of each strain map.
Table 2.
Comparison of 3D, end-systolic strains computed from strain from unwrapped phase (BiSUP) and feature-based (FB) methods.
| Strains | Difference (BiSUP-FB) | p | ρ | p | CV |
|---|---|---|---|---|---|
| Ecc | 0.0095 ± 0.0019 | 0.18 | 0.93 | <0.001 | 2.01% |
| Ell | 0.0046 ± 0.0018 | 0.63 | 0.97 | <0.001 | 1.62% |
| E3 | 0.0048 ± 0.0022 | 0.56 | 0.93 | <0.001 | 1.59% |
| Torsion (deg) | −1.8019 ± 0.2461 | 0.10 | 0.97 | <0.001 | 3.01% |
| EttRV | 0.0212 ± 0.0026 | 0.03 | 0.93 | <0.001 | 3.11% |
| EllRV | 0.0151 ± 0.0025 | 0.15 | 0.95 | <0.001 | 2.31% |
| E3RV | 0.0154 ± 0.0021 | 0.13 | 0.96 | <0.001 | 1.51% |
Differences = Mean ± Standard Error. ρ = Correlation coefficient. CV = coefficient of variation. Ecc = LV Circumferential shortening strain. Ell = LV Longitudinal shortening strain. E3 = LV Minimum principal strain. EttRV = RV Tangential shortening strain. EllRV = RV Longitudinal shortening strain. E3RV = RV Minimum principal strain.
Figure 6.
Bland-Altman (left) and correlation (right) plots for comparing BiSUP and FB strain measurements in the LV. In the Bland-Altman plots, lines above and below the zero-difference line represent 2 SD of the difference. In the correlation plots, the dashed line represents perfect agreement.
Figure 7.
Bland-Altman (left) and correlation (right) plots for comparing BiSUP and FB strain measurements in the RV. In the Bland-Altman plots, lines above and below the zero-difference line represent 2 SD of the difference. In the correlation plots, the dashed line represents perfect agreement.
Comparison with HARP Strains
Table 3 shows statistics of the difference between the 3D strains calculated from BiSUP and the 2D strains from the HARP method (7). Significant differences were found between the two techniques in minimum principal strains (E3), peak systolic torsion rate and E3RV rate, but the coefficients of variation for these parameters were all less than 10%. Peak strains showed the strongest correlations between the two techniques. Weakest correlations and largest coefficients of variation were found in early diastolic rates.
Table 3.
Comparison of strains and torsion using the strain from unwrapped phase (BiSUP) and HARP methods.
| Srains | Difference(BiSUP-HARP) | p | ρ | p | CV | |
|---|---|---|---|---|---|---|
| Ecc | Peak | −0.0066 ± 0.0009 | 0.39 | 0.61 | <0.001 | 5.35% |
| Sys Rate | −0.0659 ± 0.0045 | 0.10 | 0.61 | <0.001 | 5.06% | |
| E Dia Rate | −0.0604 ± 0.0127 | 0.52 | 0.53 | 0.0024 | 13.27% | |
| E3 | Peak | −0.0224 ± 0.0006 | 0.01 | 0.83 | <0.001 | 2.64% |
| Sys Rate | −0.2604 ± 0.0057 | 0.00 | 0.66 | <0.001 | 5.99% | |
| E Dia Rate | 0.1328 ± 0.0063 | 0.01 | 0.58 | <0.001 | 8.81% | |
| Torsion | Peak | −1.5122 ± 0.1322 | 0.23 | 0.70 | <0.001 | 7.35% |
| Sys Rate | −16.1142 ± 0.7645 | 0.01 | 0.58 | <0.001 | 8.49% | |
| E Dia Rate | 13.0258 ± 0.8720 | 0.07 | 0.55 | 0.0018 | 9.48% | |
| EttRV | Peak | 0.0011 ± 0.0010 | 0.90 | 0.61 | <0.001 | 6.86% |
| Sys Rate | 0.0934 ± 0.0105 | 0.16 | 0.24 | 0.2031 | 10.81% | |
| E Dia Rate | −0.3137 ± 0.0248 | 0.07 | 0.39 | 0.0315 | 20.08% | |
| E3RV | Peak | −0.0119 ± 0.0008 | 0.21 | 0.80 | <0.001 | 3.13% |
| Sys Rate | −0.1659 ± 0.0076 | 0.01 | 0.60 | <0.001 | 7.47% | |
| E Dia Rate | 0.0150 ± 0.0094 | 0.83 | 0.48 | 0.0069 | 11.44% |
Differences = Mean ± Standard Error. ρ = Correlation coefficient. CV = coefficient of variation. Ecc = LV Circumferential shortening strain. E3 = LV Minimum principal strain. EttRV = RV Tangential shortening strain. E3RV = RV Minimum principal strain. Peak = Peak (maximum/minimum) strain/torsion during the cycle measured. Sys Rate = Peak systolic strain/torsion rate. E Dia Rate = Peak early diastolic strain/torsion rate.
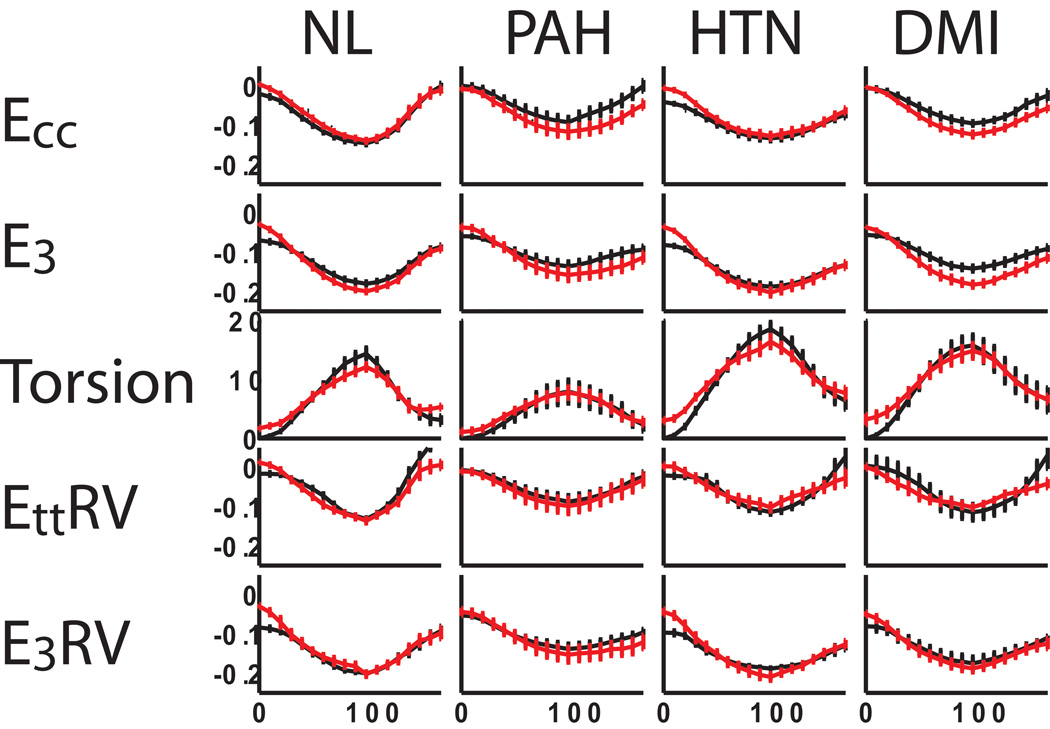
Figure 8 shows strain and torsion curves for both BiSUP and HARP averaged over the studies for each of the four patient groups showing good agreement between BiSUP and HARP in the temporal evolution of strain. Note that a few degrees of rotation occur between tag pattern application and acquisition the first images. The BiSUP method corrected for this initial deformation, resulting in a few degrees of torsion in the first timeframe. The HARP method has zero torsion in the first timeframe because it measured rotation relative to points identified in the first timeframe.
Figure 8.
Plots of average mid-ventricular strain and torsion obtained from 2D HARP (black) and 3D BiSUP (red) methods for normal volunteers (NL) and, patients with pulmonary hypertension (PAH), LV hypertension (HTN) and diabetics with myocardial infarction (DMI). X-axis represents in percentage systolic interval. Error bars represent ± one standard error.
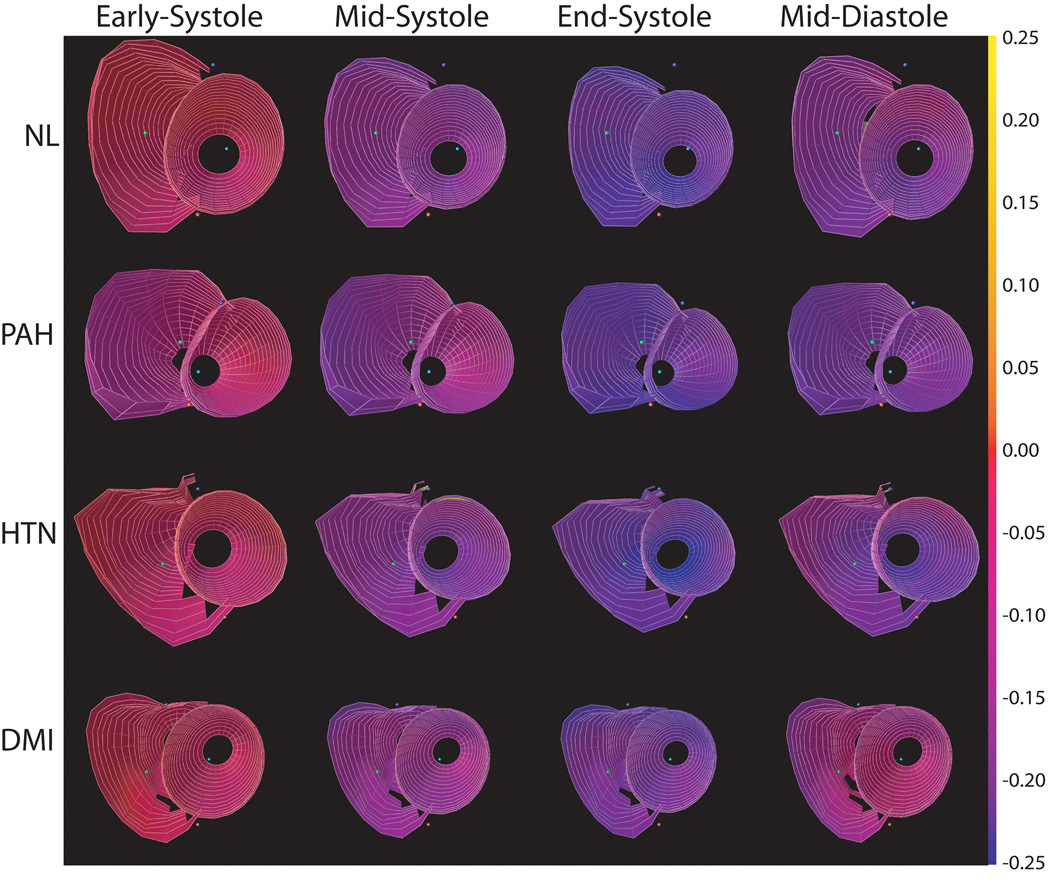
Figure 9 shows minimum principal strain for a normal volunteer, and patients with pulmonary hypertension, left ventricular hypertension and a diabetic with myocardial infarction at different phases of the cardiac cycle. Note that, by convention, myocardial contraction results in a negative strain. Each row of Figure 8 shows a map of this strain at four time points: early-systole, mid-systole, end-systole, and mid-diastole. The strains are relatively low in magnitude (red) in early systole and get progressively more purple and blue as the myocardium contracts through systole with the largest strains at end-systole. It is clear that the shortening in the RV is depressed in patients with pulmonary hypertension relative to the normal volunteers (also see Figure 8). Also, note that the excursion of the RV into the LV at the septum.
Figure 9.
Maps of minimum principal strain (E3) using the BiSUP method for a normal volunteer (NL), and patients with pulmonary hypertension (PAH), hypertension (HTN) and diabetes mellitus with myocardial infarction (DMI) from early-diastole through mid-diastole of a cardiac cycle. Strains are mapped from blue = −25% to yellow = +25%. The anterior LV wall is at the bottom of each strain map.
Inter-user and Intra-user Variability
Table 4 shows the statistics of the inter-user variability analysis based on the differences between each user from 12 studies using both LV and RV strains. No significant differences were found among users in all strain parameters.
Table 4.
Comparison of strains among three users based on the differences of each user
| Strains | Difference of each user | P | 95% Confidence Interval | |
|---|---|---|---|---|
| Ecc | −0.00432 ± 0.002911 | 0.1629 | −0.01076 | 0.002053 |
| Ell | −0.00168 ± 0.006014 | 0.7856 | −0.01491 | 0.011560 |
| E3 | 0.00161 ± 0.001660 | 0.3532 | −0.00204 | 0.005263 |
| Torsion | −0.10660 ± 0.125100 | 0.4126 | −0.38200 | 0.168900 |
| EccRV | −0.00824 ± 0.004617 | 0.1020 | −0.01840 | 0.001926 |
| EllRV | −0.00036 ± 0.005270 | 0.9469 | −0.01196 | 0.011240 |
| E3RV | −0.00133 ± 0.003849 | 0.7365 | −0.00980 | 0.007143 |
Difference = Mean ± Standard Error. Ecc = LV End Systolic Circumferential shortening strain. Ell = LV End Systolic Longitudinal shortening strain. E3 = LV Minimum principal strain. EccRV= RV End Systolic Circumferential shortening strain. EllRV= RV End Systolic Longitudinal shortening strain. E3RV = RV Minimum principal strain.
Table 5 shows the statistics of the intra-user variability analysis based on the differences between each trial from each user in both LV and RV strains. No significant differences were found among trials in all strain parameters.
Table 5.
Comparison of strains among three trials based on the differences of each trial.
| Strains | Difference of each trial | P | 95% Confidence Interval | |
|---|---|---|---|---|
| Ecc | −0.00191 ± 0.003019 | 0.5917 | −0.01490 | 0.011080 |
| Ell | 0.01011 ± 0.003993 | 0.1270 | −0.00707 | 0.027290 |
| E3 | −0.00400 ± 0.001747 | 0.1490 | −0.01152 | 0.003513 |
| Torsion | −0.00366 ± 0.106100 | 0.9756 | −0.46030 | 0.452900 |
| EccRV | 0.00046 ± 0.002240 | 0.8562 | −0.00918 | 0.010100 |
| EllRV | 0.00566 ± 0.002813 | 0.1817 | −0.00644 | 0.017770 |
| E3RV | −0.00283 ± 0.002370 | 0.3549 | −0.01303 | 0.007368 |
Differences = Mean ± Standard Error. Ecc = LV End Systolic Circumferential shortening strain. Ell = LV End Systolic Longitudinal shortening strain. E3 = LV Minimum principal strain. EccRV= RV End Systolic Circumferential shortening strain. EllRV= RV End Systolic Longitudinal shortening strain. E3RV = RV Minimum principal strain.
DISCUSSION
The application of tagged MRI to the RV has various difficulties; the thin wall of the normal RV limits the number of tag lines that are required for accurate quantification (17). Several myocardial tagging studies have been performed on the RV to investigate and characterize mechanical deformation. Klien et al. (18) used measures of percent segmental shortening of the RV free wall. Zahi et al. (17) designed a specific breath hold imaging sequence with 1-D tag lines for RV tagging acquisition and, thus, were able to characterize the RV regional deformation. Young et al. (19) use a finite element model for 3D reconstruction of the in-plane deformations of the RV free wall as a surface. Haber et al. (2) also use a finite element model to obtain 3D strains in the RV. Using this model, they were able to quantify components of the in-plane strain tensor in the RV free wall. Tustison et. al. (20) computed biventricular strains using volumetric deformable models with a non-uniform rational B-splines (NURBS) basis. All the 3D methods (2, 19, 20) feature tag tracking to obtain displacements.
In this paper, an unwrapped phase technique to compute 3D biventricular strain in about three-fourths of the cardiac cycle using tagged cardiac MR images has been described and validated. The BiSUP technique consists of an unwrapped phase technique to compute the 1D displacements followed by a discrete model-free reconstruction method to obtain 3D strain measurements.
A major problem in computing strain in the RV is that the RV wall is relatively thin. To compensate for the thinness of the RV wall, RV contours were drawn so that the RV wall is slightly thicker than it actually is. An example can be seen in Figure 2 where RV wall contours define a thicker wall than one would expect from a physiological standpoint. The bandpass filtering used in the HARP computation smooths the phase so that the phase is extrapolated to a slightly larger region than the RV wall actually occupies. This effect can be seen in the HARP images in Figures 3c and 3d. Any phase errors from adjacent tissues or blood or air show up as phase inconsistencies, which are corrected with branch cuts. Also, strain tensors were computed only at grid points where the entire 3 × 3 × 3 neighborhood was present. This approach reduced the partial volume effect, but strain could only be computed at the mid wall.
We demonstrated on human subjects of different pathologies that displacement measurements, as well as circumferential, longitudinal and minimum principal strains measured using BiSUP are similar to those obtained from a feature-based method that uses tag tracking to obtain the displacement measurements.
The mean differences between BiSUP and FB displacement measurements were a few hundredths of pixel, which means there is no bias toward under or over estimation of displacement. The difference standard deviation was around 1/2 of pixel, which is close to the tag line tracking accuracy (8, 21). A small number of differences (<1%) were in the range of 2–5 pixels. Most of these were near the apex in both the LV and RV where partial volume effects, diminished the contrast-to-noise ratio (CNR). However, these measurements were small in number and isolated and had little effect on the resulting strain map due to the smoothness constraints used in the reconstruction.
In the comparison of 3D end-systolic strains computed by the BiSUP and FB methods in Table 2, the correlation between the methods was strongest in longitudinal strain. Six long-axis images were acquired, allowing more comparisons so the correlation in longitudinal strain (Ell) and torsion was higher, but the other strains measured showed a high correlation as well. The tangential strain in the RV was found to be significantly different between the BiSUP and FB methods, but this could be because of the increased number of short-axis measurements with BiSUP, which would have larger effect on the relatively sparsely-sampled RV.
The time required for the BiSUP measured strains in the entire LV and RV combined over 20 timeframes is less than 1.5 hours per study with less than an hour of manual intervention. While 1.5 hours is still too long for clinical feasibility, the same analysis using the feature-based method would require approximately 3 hours with significantly higher manual intervention. In addition, methods for reducing the analysis time through automated branch cut placement, algorithmic improvements, and implementation on graphics processing units (GPUs) are currently being explored. Compared to methods based on tracking tag lines (2, 17, 19), displacement measurements from the BiSUP method are dense, potentially resulting in more accurate estimates of strain.
The strains from the BiSUP method were also compared to the strains from HARP. BiSUP-HARP agreement was not as strong as BiSUP-FB agreement because the BiSUP computes 3D strain while HARP computes 2D strain. Also, the tag line CNR decreases through the cycle due to T1 decay of the tag pattern, so early diastolic correlations are lower than correlations for peak strain and systolic strain rate.
It was observed that HARP in general measured lower minimum principal strains as compared to the BiSUP method. This could be attributed to the improved accuracy of tracking using the BiSUP method as a result of removal of inconsistencies in the HARP image using branch cuts. Also, HARP analysis does not correct for motion through the stationary basal and apical image planes, whereas BiSUP reconstructs 3D deformation and strain in each timeframe, which corrects for through-plane motion. With HARP, torsion is computed with HARP tracking, and large deformations between timeframes can cause errors. The unwrapped phase technique used in BiSUP is potentially more robust than HARP to large interframe deformations (6). With unwrapped phase, points can be tracked through an image sequence as long as the average inter-frame deformation over the entire myocardium is less than one-half tag spacing.
The DMF method has advantages that are utilized for the reconstruction of strain in the RV, and in the LV in patients with pulmonary hypertension. The DMF method does not need a specific coordinate system to do the LV reconstruction and uses relatively lesser amount of smoothing than other reconstruction methods (13). Therefore, the lack of a consistent geometry does not affect the performance of the DMF method as opposed to finite-element methods and prolate-spheroidal methods.
While the tagged imaging protocol used in this paper is commercially available and is widely used clinically, advanced tagged imaging techniques such as Complementary SPAMM (22), can yield a higher tag CNR throughout the cardiac cycle. Higher CNR images will result in fewer phase inconsistencies and less user interaction will be required to correct them. The BiSUP technique reconstructs full 3D strain maps from tagged MR images through the cardiac cycle, and takes into account the through-plane motion of the heart. Slice-following DENSE (10), zHARP (23) and HARP-SENC (24) can account for through-plane motion, but these techniques require two breath-holds per slice. In contrast, tagged images can be acquired with multiple slices per breath hold which allows the entire LV and RV to be imaged in significantly less time.
In the tests performed to study inter-user and intra-user variability, variance of the BiSUP method was introduced by the differences in branch-cuts manually placed by users for resolving the inconsistencies in the unwrapped phase of each study. The differences in the 3D strains, including Ecc, Ell, E3 in both LV and RV, and Torsion, between each user were computed. No significant differences were found in these strains among users, which indicated the uniform reproducibility of the method. The differences in the strains between each trial from each user were also computed. No significant differences were found among trials, suggestive of the acceptable repeatability of the method. In conclusion, these results suggest that BiSUP method is reproducible and repeatable for cardiac tagged image analysis.
In conclusion, the BiSUP method can compute accurate 3D biventricular strains through the cardiac cycle in a reasonable amount of time and user interaction compared to other 3D analysis methods.
Acknowledgments
Grant Support: NIH NHLBI grant P50-HL077100, NIH NHLBI grant R01-HL104018.
REFERENCES
- 1.Radeva P, Amini A, Jiantao H, Marti E. Deformable B-solids and implicit snakes for localization and tracking of SPAMM MRI-data. Proceedings of Mathematical Methods in Biomedical Image Analysis; Proceedings of the Workshop on; 1996.1996. pp. 192–201. [Google Scholar]
- 2.Haber I, Metaxas DN, Axel L. Three-dimensional motion reconstruction and analysis of the right ventricle using tagged MRI. Medical Image Analysis. 2000;4(4):335–355. doi: 10.1016/s1361-8415(00)00028-1. [DOI] [PubMed] [Google Scholar]
- 3.O'Dell WG, Moore CC, Hunter WC, Zerhouni EA, McVeigh ER. Three-dimensional myocardial deformations: calculation with displacement field fitting to tagged MR images. Radiology. 1995;195(3):829–835. doi: 10.1148/radiology.195.3.7754016. [DOI] [PMC free article] [PubMed] [Google Scholar]
- 4.Declerck J, Ayache N, McVeigh ER. Use of a 4D planispheric transformation for the tracking and analysis of LV motion with tagged MR images; Proceedings of Medical Imaging 1999: Physiology and Function from Multidimensional Images; San Diego, CA, USA. 1999. pp. 69–80. [Google Scholar]
- 5.Li J, Denney TS. Left ventricular motion reconstruction with a prolate spheroidal B-spline model. Phys Med Biol. 2006;51(3):517–537. doi: 10.1088/0031-9155/51/3/004. [DOI] [PubMed] [Google Scholar]
- 6.Ambale BV, Gupta H, Lloyd SG, Dell'Italia L, Denney TS., Jr 3D left ventricular strain from unwrapped harmonic phase measurements. Journal of Magnetic Resonance Imaging. 2010;31(4):854–862. doi: 10.1002/jmri.22099. [DOI] [PMC free article] [PubMed] [Google Scholar]
- 7.Osman NF, McVeigh ER. Imaging Heart Motion Using Harmonic Phase MRI. IEEE Transactions on Medical Imaging. 2000;19(3):186–202. doi: 10.1109/42.845177. [DOI] [PubMed] [Google Scholar]
- 8.Denney TS, McVeigh ER. Model-Free Reconstruction of Three-Dimensional Myocardial Strain From Planar Tagged MR Images. J Magn Reson Imaging. 1997;7(5):799–810. doi: 10.1002/jmri.1880070506. [DOI] [PMC free article] [PubMed] [Google Scholar]
- 9.Feng W, Nagaraj H, Gupta H, et al. A dual propagation contours technique for semi-automated assessment of systolic and diastolic cardiac function by CMR. Journal of Cardiovascular Magnetic Resonance. 2009;11(1):30. doi: 10.1186/1532-429X-11-30. [DOI] [PMC free article] [PubMed] [Google Scholar]
- 10.Spottiswoode BS, Zhong X, Hess AT, et al. Tracking Myocardial Motion From Cine DENSE Images Using Spatiotemporal Phase Unwrapping and Temporal Fitting. Medical Imaging, IEEE Transactions on. 2007;26(1):15–30. doi: 10.1109/TMI.2006.884215. [DOI] [PubMed] [Google Scholar]
- 11.Ghiglia DC, Pritt MD. Two-dimensional phase unwrapping : theory, algorithms, and software. New York: Wiley; 1998. p. 494. [Google Scholar]
- 12.Denney TS, Jr, Prince JL. Reconstruction of 3-D left ventricular motion from planar tagged cardiac MR images: an estimation theoretic approach. Medical Imaging, IEEE Transactions on. 1995;14(4):625–635. doi: 10.1109/42.476104. [DOI] [PubMed] [Google Scholar]
- 13.Declerck J, Denney TS, Ozturk C, O'Dell W, McVeigh ER. Left ventricular motion reconstruction from planar tagged MR images: a comparison. Physics in Medicine and Biology. 2000;45(6):1611–1632. doi: 10.1088/0031-9155/45/6/315. [DOI] [PMC free article] [PubMed] [Google Scholar]
- 14.Liu W, Chen J, Ji S, et al. Harmonic phase MR tagging for direct quantification of Lagrangian strain in rat hearts after myocardial infarction. Magn Reson Med. 2004;52(6):1282–1290. doi: 10.1002/mrm.20276. [DOI] [PubMed] [Google Scholar]
- 15.Khalifa A, Youssef ABM, Osman N. Improved Harmonic Phase (HARP) Method for Motion Tracking a Tagged Cardiac MR images; International Conference on the Engineering in Medical and Biology Society; 2005. pp. 4298–4301. [DOI] [PubMed] [Google Scholar]
- 16.Crowder MJ, Hand DJ. In: Analysis of repeated measures. Crowder MJ, Hand DJ, editors. London: Chapman and Hall; 1990. [Google Scholar]
- 17.Zahi AF, Victor AF, Dara LK, et al. Right ventricular regional function using MR tagging: Normals versus chronic pulmonary hypertension. Magnetic Resonance in Medicine. 1998;39(1):116–123. doi: 10.1002/mrm.1910390118. [DOI] [PubMed] [Google Scholar]
- 18.Klein SS, Graham TP, Lorenz CH. Noninvasive Delineation of Normal Right Ventricular Contractile Motion With Magnetic Resonance Imaging Myocardial Tagging. Annals of Biomedical Engineering. 1998;26(5):756–763. doi: 10.1114/1.75. [DOI] [PubMed] [Google Scholar]
- 19.Young AA, Fayad ZA, Axel L. Right ventricular midwall surface motion and deformation using magnetic resonance tagging. Am J Physiol Heart Circ Physiol. 1996;271(6):H2677–H2688. doi: 10.1152/ajpheart.1996.271.6.H2677. [DOI] [PubMed] [Google Scholar]
- 20.Tustison NJ, Amini AA. Biventricular myocardial strains via nonrigid registration of AnFigatomical NURBS models. Medical Imaging, IEEE Transactions on. 2006;25(1):94–112. doi: 10.1109/TMI.2005.861015. [DOI] [PubMed] [Google Scholar]
- 21.Denney TS, Jr, Yan BLGL. Unsupervised reconstruction of a three-dimensional left ventricular strain from parallel tagged cardiac images. Magnetic Resonance in Medicine. 2003;49(4):743–754. doi: 10.1002/mrm.10434. [DOI] [PubMed] [Google Scholar]
- 22.Zwanenburg JJM, Kuijer JPA, Marcus JT, Heethaar RM. Steady state free precession with myocardial tagging: CSPAMM in a single breathhold. Magn Reson Med. 2003;49(4):722–730. doi: 10.1002/mrm.10422. [DOI] [PubMed] [Google Scholar]
- 23.Abd-Elmoniem KZ, Stuber M, Prince JL. Direct three-dimensional myocardial strain tensor quantification and tracking using zHARP. Medical Image Analysis. 2008;12(6):778–786. doi: 10.1016/j.media.2008.03.008. [DOI] [PMC free article] [PubMed] [Google Scholar]
- 24.Sampath S, Osman NF, Prince JL. A combined harmonic phase and strain-encoded pulse sequence for measuring three-dimensional strain. Magnetic Resonance Imaging. 2009;27(1):55–61. doi: 10.1016/j.mri.2008.05.020. [DOI] [PMC free article] [PubMed] [Google Scholar]


