

Abstract
One fundamental unanswered question in the field of polyglutamine diseases concerns the pathophysiology of neuronal dysfunction. Is there dysfunction in a specific neuronal population or circuit initially that contributes the onset of behavioral abnormalities? This study used a systems-level approach to investigate the functional integrity of the excitatory cerebellar cortical circuitry in vivo from several transgenic ATXN1 mouse lines. We tested the hypotheses that there are functional climbing fiber (CF)–Purkinje cell (PC) and parallel fiber (PF)–PC circuit abnormalities using flavoprotein autofluorescence optical imaging and extracellular field potential recordings. In early-symptomatic and symptomatic animals expressing ATXN1[82Q], there is a marked reduction in PC responsiveness to CF activation. Immunostaining of vesicular glutamate transporter type 2 demonstrated a decrement in CF extension on PC dendrites in symptomatic ATXN1[82Q] mice. In contrast, responses to PF stimulation were relatively normal. Importantly, the deficits in CF–PC synaptic transmission required expression of pathogenic ataxin-1 (ATXN1[82Q]) and for its entrance into the nucleus of PCs. Loss of endogenous mouse Atxn1 had no discernible effects. Furthermore, the abnormalities in CF–PC synaptic transmission were ameliorated when mutant transgene expression was prevented during postnatal cerebellar development. The results demonstrate the preferential susceptibility of the CF–PC circuit to the effects of ATXN1[82Q]. Further, this deficit likely contributes to the abnormal motor phenotype of ATXN1[82Q] mice. For polyglutamine diseases generally, the findings support a model whereby specific neuronal circuits suffer insults that alter function before cell death.
Introduction
Spinocerebellar ataxia type 1 (SCA1) is a fatal, progressive neurological disorder caused by the expansion of an unstable CAG trinucleotide repeat tract in ATXN1 (Orr et al., 1993). Upon translation, the gene product, ataxin-1 (ATXN1), harbors an expanded glutamine tract, placing SCA1 into the group of autosomal-dominant, polyglutamine-induced neurodegenerative diseases. Clinical symptoms include ataxia, loss of coordination of voluntary movements, and dysarthria (Orr and Zoghbi, 2007).
In transgenic ATXN1 mice, Purkinje cell (PC) dysfunction, rather than cell death, leads to disease onset and early progression (Burright et al., 1995; Clark et al., 1997; Zu et al., 2004). Mice overexpressing expanded ATXN1[82Q] exhibit abnormal motor behavior by ∼6 weeks of age that is accompanied by mild PC pathology but no neuronal loss. Overt neuronal death does not begin until ∼24 weeks of age, well after mice are neurologically compromised (Burright et al., 1995; Clark et al., 1997; Zu et al., 2004). In these mice, genes involved in cell signal transduction and Ca2+ homeostasis (Lin et al., 2000), as well as glutamate signaling (Serra et al., 2004), are downregulated before pathological alterations. Mutant ATXN1 thus affects pathways involved in maintaining normal PC physiology before neuropathological changes occur.
Little is known about the functional status of PCs and the cerebellar cortical circuitry in affected animals. One study examined Ca2+ dynamics and electrophysiological properties of PCs from adult (3–7 months of age) ATXN1[82Q] mice in slice preparations (Inoue et al., 2001). Excepting a delay in PC firing resulting from an increased A-type potassium current, after adjustment for neuronal volume the basic electrophysiological properties of mutant PCs were found to be essentially intact, including the responses to climbing fiber (CF) and parallel fiber (PF) input (Palay and Chan-Palay, 1974). A more recent study identified reduced intrinsic PC simple spike firing in presymptomatic ATXN1[82Q] mice attributable to increased A-type potassium currents (Hourez et al., 2011). The former study ultimately suggested the need to examine the functioning of the intact cerebellar circuitry in ATXN1 mice; however, neither systematically evaluated the CF–PC circuit.
Toward that end, we used flavoprotein autofluorescence optical imaging and field potential (FP) recordings in vivo to test the hypotheses that there are alterations in the CF–PC and PF–PC circuitry in early-stage (6-week-old) and mid-stage (12-week-old) disease mice before gross PC pathology and death. By our methods, ATXN1[82Q] preferentially affects the CF–PC synapse early in the disease process at 6 weeks of age, while significant changes in PF–PC synaptic transmission were not detected until ∼40 weeks of age (late-stage disease). Functional and morphological measures reveal abnormalities in the CF–PC circuit that are dependent on ATXN1[82Q] expression and entrance into the nucleus of PCs, as mice that express ATXN1[82Q] that cannot enter the nucleus (ATXN1[82Q]-K772T) (Klement et al., 1998) are unaffected. Moreover, the deficits in CF–PC synaptic transmission required mutant ATXN1 expression during early postnatal development. Finally, these results indicate that alterations in the CF–PC circuitry are a critical component of the early motoric deficits observed in ATXN1[82Q] mice.
Materials and Methods
Animals.
The following six different mouse lines of either sex were studied: (1) ATXN1[82Q] (line B05) (Burright et al., 1995); (2) conditional ATXN1[82Q] (ATXN1[82Q]Cd) (Zu et al., 2004); (3) wild-type (WT)/FVB (Charles River Laboratories); (4) ATXN1[30Q] (line A02) (Burright et al., 1995); (5) ATXN1[82Q]-K772T (Klement et al., 1998); and (6) Atxn1-null mice (Atxn1−/−) (Matilla et al., 1998). When discussed jointly, both ATXN1[82Q] and ATXN1[82Q]Cd mice will be referred to as ATXN1[82Q]-expressing mice. By both behavioral and histological analyses, only ATXN1[82Q]-expressing mice are affected and show similar time courses and severity of pathological alterations, developing motoric deficits and PC pathology beginning at ∼6 weeks of age and progressing to ataxia by home-cage behavior and cell death after ∼24 weeks (Burright et al., 1995; Clark et al., 1997; Zu et al., 2004). Mice overexpressing unexpanded ATXN1[30Q] serve as an overexpression control and exhibit only subtle behavioral and morphological deficits (Burright et al., 1995; Clark et al., 1997), while ATXN1[82Q]-K772T animals that express expanded ATXN1[82Q] that cannot enter the nucleus are unaffected (Klement et al., 1998). Finally, Atxn1−/− mice show no cerebellar deficits (Matilla et al., 1998).
Animal preparation.
All animal experimentation was approved by the Institutional Animal Care and Use Committee of the University of Minnesota and was conducted in accordance with the National Institutes of Health Principles of Laboratory Animal Care (86–23, revised 1985) and the American Physiological Society Guiding Principles in the Use of Animals. Optical imaging and electrophysiology experiments were performed in anesthetized adult mice of either sex in vivo. Experimental details of the anesthetized animal preparation and optical imaging techniques have been previously reported (Reinert et al., 2004; Gao et al., 2006) and briefly described here. Mice were first anesthetized by intramuscular injection of acepromazine (0.1 mg/g) and by intraperitoneal injection of urethane (2 mg/g). Animals were mechanically ventilated and placed in a stereotaxic frame. Body temperature was regulated by feedback control with a rectal thermometer probe connected to a heating blanket. Depth of anesthesia was monitored throughout the experiment by electrocardiogram and was adjusted as necessary with supplemental doses of urethane. A craniotomy exposed a portion of the left cerebellar hemisphere that typically included Crus I, II, paramedian lobule, and lobulus simplex. The soft tissue and dura covering the caudal medulla were then removed to expose the dorsal surface of the brainstem to allow for placement of a stimulating electrode into the inferior olivary complex. Following the duratomy, a watertight chamber was created to encompass all areas of the exposed brain and was filled with Ringer's solution gassed with 95% O2 and 5% CO2.
Optical imaging.
Following placement onto an x-y stage mounted on a modified Nikon epifluorescence microscope fitted with a 4× objective, images of the exposed cerebellar cortex were acquired with a Quantix cooled charge-coupled device camera with 12 bit digitization (Roper Scientific). Images were then binned 2 × 2 to produce a final resolution of 256 × 256 (∼10 × 10 μm per pixel). The light source consisted of a 100 W xenon-mercury lamp (Hamamatsu Photonics) with a DC controlled power supply (Opti Quip). A bandpass excitation filter (455 ± 35 nm), an extended reflectance dichroic mirror (500 nm), and a >515 nm long-pass emission filter were used for imaging flavoprotein autofluorescence (Reinert et al., 2004).
Ca2+ imaging was also used by making microinjections of a Ca2+ indicator dye to completely stain Crus II. The dye solution was composed of 10 mm Oregon Green 488 BAPTA-1/AM (Invitrogen) dissolved in DMSO plus 20% Pluronic F-127 solution (Invitrogen). The dye was diluted 20× in normal Ringer's solution (Stosiek et al., 2003; Sullivan et al., 2005; Gao et al., 2006). A glass micropipette with resistance of 1–5 MΩ was filled with the dye solution and penetrated the cerebellar cortex to a depth of ∼300–400 μm. Individual dye injections were made over 2 s at 100 kPa. Approximately 15 separate locations were chosen to uniformly stain the entire folium. After a 30 min incubation period, the response to cerebellar cortical surface stimulation was tested using a custom Ca2+ filter set that excluded most of the autofluorescence signal (excitation filter at 490–510 nm, a long-pass dichroic mirror of 515 nm, and an emission filter at 520 –530 nm).
PF stimulation was accomplished by lowering a tungsten microelectrode (1–3 MΩ) until it touched the surface of the cerebellum. An applied stimulus (100 pulses delivered at 10 or 100 Hz, 200 μA, 100 μs) consistently evoked a characteristic transverse beam-like response. During experiments in which the contralateral inferior olive (CIO) was stimulated, the integrity of the PF–PC circuit was tested by PF stimulation, requiring an optical response of ∼1–2% change in fluorescence relative to the average of the control frames (ΔF/F) and an intact FP before stereotaxically inserting a tungsten microelectrode into the right inferior olive. The CIO electrode was lowered 1.4 mm into the brainstem from the dorsal surface near the obex to establish the first stimulation site. Subsequent test sites were each 200 μm lower to a total depth of 2.0 mm. Stimulations at 10 Hz for 10 s (100 μs pulse width, 200 μA) were done in quadruplicate at each depth. Optical responses were simultaneously recorded in the left cerebellar hemisphere.
Optical imaging data analysis.
Each series, regardless of the circuitry being examined, consisted of 110 frames, each of 200 ms duration. PF or CIO stimulation was initiated after a ∼13–15 frame control period. The 10 frames that preceded stimulation onset were averaged and served as the control average. The control average was subtracted from each individual frame. Each difference image was divided by the control average, resulting in a series of images that reflected the ΔF/F.
Analysis of the optical responses was based on selecting a region of interest. For PF stimulation, the on-beam region of interest was generally ∼10–20 pixels wide and typically spanned the length of the folium (Reinert et al., 2004; Gao et al., 2006; Wang et al., 2009). For CIO-evoked band-like responses, the regions of interest were circles with areas of 137 pixels (∼13,700 μm2) centered at the tip of the glass recording electrode from the medial-most parasagittal optical band. To generate a temporal profile of the fluorescence response within a region of interest, the ΔF/F in each frame were smoothed using a 5 point moving average. To quantify the PF-mediated responses, nine and five values centered about the peak ΔF/F were averaged for 10 and 100 Hz stimulation, respectively. Nine frames centered about the peak ΔF/F for each ROI within the medial band were averaged and used to quantify the CIO-evoked response.
Pseudocolored images obtained from PF stimulation were produced by first averaging the optical responses from three separate simulations, then by averaging nine frames centered on the peak ΔF/F. For CIO-evoked responses, the stimulation depth that elicited the optical response of greatest intensity for a single mouse was used to generate an optical stack average based on four separate stimulations. To generate a single composite response for each individual genotype, the responses for each mouse within a genotype were averaged. Pseudocolored images for the composite responses were created by averaging nine frames at the peak ΔF/F. Based on coordinates determined during stimulation, only sites within the medial band were used for quantification. The medial band was exclusively used due to its large area, robust response, and reliability of being evoked. It was defined as the region in Crus II that extended ∼1100 μm from the vermis–hemisphere boundary. Using these measures of response, cerebellar cortical activity elicited by separate stimulation of the PF–PC and CF–PC circuitry was compared in WT/FVB, Atxn1−/−, ATXN1[30Q], ATXN1[82Q], ATXN1[82Q]Cd, and ATXN1[82Q]-K772T mice.
Electrophysiology.
Following identification of the active regions by optical imaging, conventional extracellular electrophysiological techniques with glass recording microelectrodes (2 M NaCl, 2–5 MΩ) were used to record FPs (Eccles et al., 1966a,b; Reinert et al., 2004; Wang et al., 2009). Optical imaging results were used to guide placement of the electrode. For both PF- and CIO-evoked FPs, a total of 16 pulses were delivered at 1 Hz for each individual recording site and were subsequently averaged. For PF stimulation, the recording microelectrode was placed on the cortical surface in the region of the evoked beam with the largest optical response to monitor the characteristic P1-N1-P2-N2 FP (Eccles et al., 1966a). Recording sites were located ∼500–1000 μm from the stimulating electrode in all mice. On average, seven discrete on-beam sites were recorded per mouse to obtain a robust measure of the PF-mediated response. During CIO stimulation, FPs were recorded from the medial band. For the reasons stated above, only responses within the medial band were examined. Recording positions were selected to provide uniform coverage of this area. Activation of the CF–PC circuitry by CIO stimulation produced a biphasic, negative–positive potential recorded on the cortical surface that typically reversed at greater depths (Eccles et al., 1966b; Ekerot et al., 1991). Electrodes were lowered through the molecular layer with evoked signals recorded every ∼100 μm. Following completion of the stimulation protocol, marking lesions were created at the tip of the electrode in the CIO by passing 100 μA of direct current three times for 1 s per pulse. Though lesion attempts were always made, they were not always found. Animals were perfused, and whole brains were harvested and processed as described below.
Analysis of electrophysiological signals.
Spike2 (CED) software was used to record FPs. For PF-evoked responses, P1-N1 and P2-N2 values were determined and used as a measure of presynaptic and postsynaptic responses, respectively (Eccles et al., 1966a). Both components were normalized to those of 12-week-old FVB animals. Processing of CF-evoked electrophysiological responses was accomplished in several steps. The recording depth with the largest initial negativity (CF-N1) was quantified as the peak value of the trough relative to baseline and was used for comparison between animals. Responses for every animal were normalized to the average CF-N1 value in 12-week-old FVB mice.
Histology.
Animals were transcardially perfused with PBS, pH 7.4, until the fluid discharged was clear, at which point 4% formalin was used. The entire brain was removed and postfixed in 4% formalin overnight at room temperature, and was later transferred to PBS and placed at 4°C. Tissue was dehydrated in 30% sucrose for ∼48 h before sectioning for lesioned brains. Using a freezing microtome, whole brains were cryostatically sectioned into 40-μm-thick coronal slices for identification of CIO lesions. Nissl staining was used to visualize lesions. Images of lesioned sections were captured by SPOT software (Diagnostic Instruments) under 4× and 10× magnification on a standard light microscope.
Immunostaining.
Following perfusion, 50 μm sagittal sections were cut from cerebella on a vibratome and stained as previously described (Duvick et al., 2010). Briefly, sections were incubated in 2% normal donkey serum and 0.3% Triton X-100 in 1× PBS for 1 h. Blocked slices were then incubated for 48 h at 4°C in blocking solution containing primary antibodies, goat calbindin antibody (SC-7691, Santa Cruz Biotechnology) at 1:500 and mouse vesicular glutamate transporter type 2 (VGLUT2) antibody (MAB5504, Millipore) at 1:1000. Following four washes in 1× PBS, sections were exposed to secondary antibodies in blocking solution for 48 h at 4°C. Donkey secondary Cy2 and Cy5 were applied at 1:500 (Jackson Immunoresearch). Finally, sections were rinsed four times in 1× PBS and mounted onto slides with glycerol-gelatin (Sigma) containing 4 mg/ml n-propyl gallate. Fluorescently labeled sections were imaged using an Olympus Fluoview 1000 IX2 inverted microscope.
Quantification of molecular layer thickness and CF innervation distance.
To assess the thickness of the molecular layer and the distance along the PC dendrite that a CF ascends, 20× images were measured using Fluoview Viewer 1.7 software (Olympus). The thickness of the molecular layer was taken from the primary fissure and was calculated as the distance from the base of the PC soma to the tip of the dendritic arbor near the pial surface, as previously done (Zu et al., 2004; Duvick et al., 2010). The maximal extent along which CFs contacted the PC dendritic arbor from the base of the PC soma was calculated relative to the thickness of the molecular layer (Duvick et al., 2010). Six measurements per section from three sections taken from three animals per genotype were used for both measurements, resulting in a comparison of 54 individual measurements from three animals for each genotype.
Conditional ATXN1[82Q] transgene expression.
To accomplish cessation of Pcp2/tTA(tg/+); TRE-ATXN1[82Q]-S776(tg/tg) transgene expression in ATXN1[82Q]Cd animals (Zu et al., 2004; Serra et al., 2006), doxycycline was first dissolved in 1.5 ml of sterilized water to a final concentration of 257 mg/ml, frozen, and stored at −80°C. Three aliquots of doxycycline were added to 400 ml of 20% sucrose in deionized water to bring the final concentration of doxycycline to 2 mg/ml. Solutions were made fresh and were changed twice per week. Bottles were covered in aluminum foil to reduce exposure to light, and thus limit decomposition of doxycycline. Perinatal administration began at birth (P0) by providing the mother with the solution. Upon weaning (P21), each cage of treated animals received a bottle containing the doxycycline solution. Treatment lasted through the fifth postnatal week of life (P35). At the end of the treatment period, the drinking solution was changed back to water.
Gene expression analysis—Northern blotting.
Expression of the Pcp2/tTA-ATXN1[82Q] transgene was tested in two groups of animals, and testing was performed as previously described (Zu et al., 2004). The first group was used to determine whether doxycycline treatment prevented transgene expression and consisted of two animals that were killed at the end of treatment (P35). The second group contained two animals that had undergone treatment but survived for 1 week after the transgene was turned on. Upon removal of the whole brain, tissue was snap-frozen in liquid N2 and stored at −80°C until processing. RNA was isolated from one half of each homogenized mouse cerebellum using Trizol reagent (Invitrogen) according to the manufacturer's protocol. RNA was loaded onto an agarose gel and electrophoresed in the presence of glyoxal. After transferring to a nylon membrane, the RNA was probed using an ATXN1 cDNA. Blots were subsequently probed using a GAPDH cDNA probe to control for total amounts of RNA loaded per well.
Statistical analysis.
Statistical analyses using a standard one-way ANOVA or a within-subjects ANOVA followed by a Bonferroni post hoc analysis were performed to determine whether there were any significant differences in the PF-mediated signal, CIO-evoked responses, molecular layer thickness, and CF innervation distance between transgenic animals, and between transgenic and WT/FVB mice. The degrees of freedom for the standard ANOVA include the first value based on the number of genotypes (N), and the second value determined by both N and the total number of observations (n) reported as F(N − 1, n − N). The within-subjects ANOVA was used whenever multiple observations occurred within every animal in a given analysis and permitted for a more robust comparison between genotypes for any given measurement, as it takes into account variability within and between genotypes. The degrees of freedom for the within-subjects ANOVA (subject nested within genotype) are reported with the first factor being the number of genotypes (N − 1) and the second factor calculated by subtracting the number of genotypes from the total number of subjects (T), resulting in F(N − 1, T − N). Corrected p values were based on the number of genotypes compared for each statistical analysis and were used for each dataset. All data are reported as the mean ± SEM.
Results
Altered CF terminal localization in 12-week-old ATXN1[82Q] mice
Previously, we showed abnormal CF terminal placement along the PC dendritic arbor in symptomatic 12-week-old ATXN1[82Q] mice (Duvick et al., 2010). The current data confirmed and extended those findings in WT/FVB, ATXN1[30Q], and ATXN1[82Q] animals, and also documented normal CF innervation territories in nonataxic Atxn1−/− and ATXN1[82Q]-K772T mice (Fig. 1A). In each unaffected line, VGLUT2-positive puncta were spaced regularly along the primary and secondary portions of the highly branched PC dendritic arbor, projecting ∼80% of the entire distance of the molecular layer (Fig. 1A). In affected ATXN1[82Q] mice, however, CF terminals showed a significant decrement in the innervation distance, projecting along 72% of the thickness of the molecular layer (F(4,10) = 24.84, p < 0.0001; Bonferroni post hoc test, p < 0.0001 for ATXN1[82Q] mice compared with other genotypes) (Fig. 1C). Thinning of the molecular layer, a sign of neuropathology in ATXN1 mice (Zu et al., 2004; Serra et al., 2006; Duvick et al., 2010), also occurred in ATXN1[30Q] and ATXN1[82Q] animals. Although significant, thinning was more moderate in ATXN1[30Q] mice compared with ATXN1[82Q] animals (F(4,10) = 9.73, p = 0.002; Bonferroni post hoc test, p < 0.0001 for all comparisons to ATXN1[30Q] and ATXN1[82Q] mice and p = 0.008 between ATXN1[30Q] and ATXN1[82Q] mice; corrected α = 0.01) (Fig. 1B). Thus, by two morphological measures, the most severe pathology was observed in symptomatic ATXN1[82Q] mice.
Figure 1.

Reduced CF translocation and molecular layer thinning in 12-week-old ATXN1[82Q] mice. A, Immunofluorescently labeled sagittal cerebellar sections show calbindin-positive PCs (red) and VGLUT2-positive CF terminals (green). Images were taken at 20×. Scale bar, 50 μm. B, Molecular layer (ML) thickness at the primary fissure. C, CF terminal translocation measured as a percentage of total molecular layer thickness. N = 3 animals; n = 54 measurements per genotype. All results are reported as the mean ± SEM. Colors in boxes below graphs correspond to statistically significant differences (p < 0.01 for all Bonferroni post hoc comparisons) between the bar immediately superior and the box of the specified color, while a lack of color denotes no significant difference.
Abnormal CF–PC synaptic transmission in 6- and 12-week-old ATXN1[82Q] mice
Although we previously described a reduction in the CF extension in the molecular layer (Duvick et al., 2010), the functional status of the CF–PC circuitry was not assessed. To determine the efficacy of the CF–PC and PF–PC circuitry in early and mid-stages of the disease state, before overt neuropathological changes, we used two physiological measures. Changes in flavoprotein autofluorescence evoked by CIO or PF stimulation are primarily due to activation of postsynaptic targets (Reinert et al., 2004; Gao et al., 2006; Reinert, 2006). The response consists of a rapid increase in fluorescence (i.e., the “light phase”) resulting from the oxidation of mitochondrial flavoproteins and is followed by a longer-duration decrease in fluorescence that is caused by their subsequent reduction (Reinert et al., 2004, 2007). This study focused on the light phase because it mostly reflects the activation of PCs.
We first examined 12-week-old animals to determine the functional status of the CF–PC circuit in mid-stage disease. Stimulation of the CIO produced intense, well defined parasagittal bands of flavoprotein autofluorescence in the cerebellar cortex of 12-week-old WT/FVB, ATXN1[30Q], ATXN1[82Q]-K772T, and Atxn1−/− mice, as expected for the well defined geometry of CF projections in mice (Voogd and Glickstein, 1998; Sugihara et al., 2001; Sugihara and Shinoda, 2004; Sugihara, 2006; Sugihara and Quy, 2007) (Fig. 2A) (data not shown). The single animal (Fig. 2A, top and middle rows) and compilation images for each genotype (Fig. 2A, bottom row) demonstrate that the spatial pattern of activity evoked by CIO stimulation was highly reproducible and geometrically similar in all animals. Moreover, the composite optical response from each genotype illustrated that the medial band was the most commonly elicited and most intense of all bands. Although a similar pattern of activity was evoked in 12-week-old ATXN1[82Q] mice, the amplitude was greatly reduced (Fig. 2A). Temporal profiles of the optical response demonstrated sustained activity for the duration of stimulation in all control animals, but the amplitude was again markedly reduced in ATXN1[82Q] mice (Fig. 2B).
Figure 2.
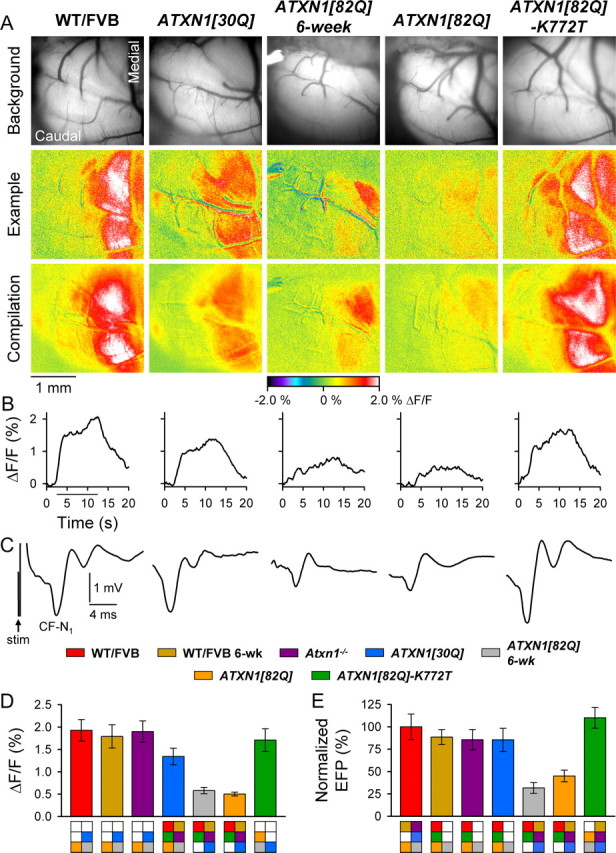
Reduced response to CIO stimulation in 6- and 12-week-old ATXN1[82Q] mice. A, Background images of exposed cerebella (top row), pseudocolored images from individual animals (middle row), and compilation images from each genotype (bottom row) demonstrate characteristic response patterns to CIO stimulation. B, Time courses for single trials illustrate typical changes in flavoprotein autofluorescence over the duration of CIO stimulation (horizontal bar). C, Representative FPs evoked by CIO stimulation for each genotype. The stimulation artifact is shown only for WT/FVB. D, E, Quantification of CF-mediated flavoprotein autofluorescence responses and CF-N1 of the FP. WT/FVB: N = 11 animals; n = 60 observations for both autofluorescent flavoprotein imaging (AFI) and FPs; 6-week-old WT/FVB mice: N = 5, n = 40 for AFI; and N = 4, n = 32 for FPs; Atxn1−/− mice: N = 4, n = 32; ATXN1[30Q] mice: N = 8, n = 60 for AFI; and N = 7, n = 51 for FPs; 6-week-old ATXN1[82Q] mice: N = 4, n = 32; 12-week-old ATXN1[82Q] mice: N = 4, n = 32; ATXN1[82Q]-K772T mice: N = 4, n = 32. Boxes denote significant differences.
We next reasoned that for any functional alterations to underlie behavioral abnormalities in affected mice, they will necessarily present either before or nearly simultaneously with the onset of motor symptoms. Thus, we examined 6-week-old ATXN1[82Q] animals, an age when a mild rotarod deficit first becomes detectable (Clark et al., 1997). The CIO-induced response in those animals was nearly indistinguishable from that in 12-week ATXN1[82Q] mice (Fig. 2A), indicating reduced PC responsiveness to CF input. Evoked responses in 6-week-old FVB mice were normal and were qualitatively similar to those of 12-week-old WT/FVB mice (data not shown).
The optical responses to CIO stimulation were quantified for the medial band in Crus II (see Materials and Methods). The responses to CIO stimulation demonstrated a significant genotype effect (F(6,282) = 46.28, p < 0.0001) (Fig. 2D). The response amplitude was weakest in affected 6- and 12-week-old ATXN1[82Q] mice (p < 0.007 for all Bonferroni post hoc comparisons to all other genotypes; corrected α = 0.007), but there was no difference between 6- and 12-week-old ATXN1[82Q] mice (p > 0.007) (Fig. 2D). The response intensity was significantly greater in all control animals compared with ATXN1[82Q] mice, although there were differences among them. The response amplitude was greatest in 6- and 12-week-old WT/FVB and 12-week-old Atxn1−/− and ATXN1[82Q]-K772T mice (p > 0.007 for all Bonferroni post hoc comparisons), and was followed in intensity by ATXN1[30Q] animals (p < 0.007 for all Bonferroni post hoc comparisons with other control animals) (Fig. 2D).
Because the autofluorescence response is downstream of neuronal activity (Reinert et al., 2007), we also examined the response to CIO stimulation using Ca2+ imaging and electrophysiology. Similar spatial patterns were obtained in 12-week-old WT/FVB and ATXN1[82Q]Cd mice by Ca2+ imaging (Fig. 3). Robust bands were observed in WT/FVB animals, while weak or no signals were evoked in ATXN1[82Q]Cd mice. Quantification of the Ca2+ signal revealed a significant decrease from 1.15 ± 0.23% in WT/FVB animals to 0.26 ± 0.06% ΔF/F in ATXN1[82Q]Cd mice (F(1,42) = 110.97, p < 0.0001). The Ca2+ imaging findings suggested that the decreased response in ATXN1[82Q]Cd animals was a result of abnormal CF activation of PCs rather than an altered downstream flavoprotein autofluorescence response.
Figure 3.
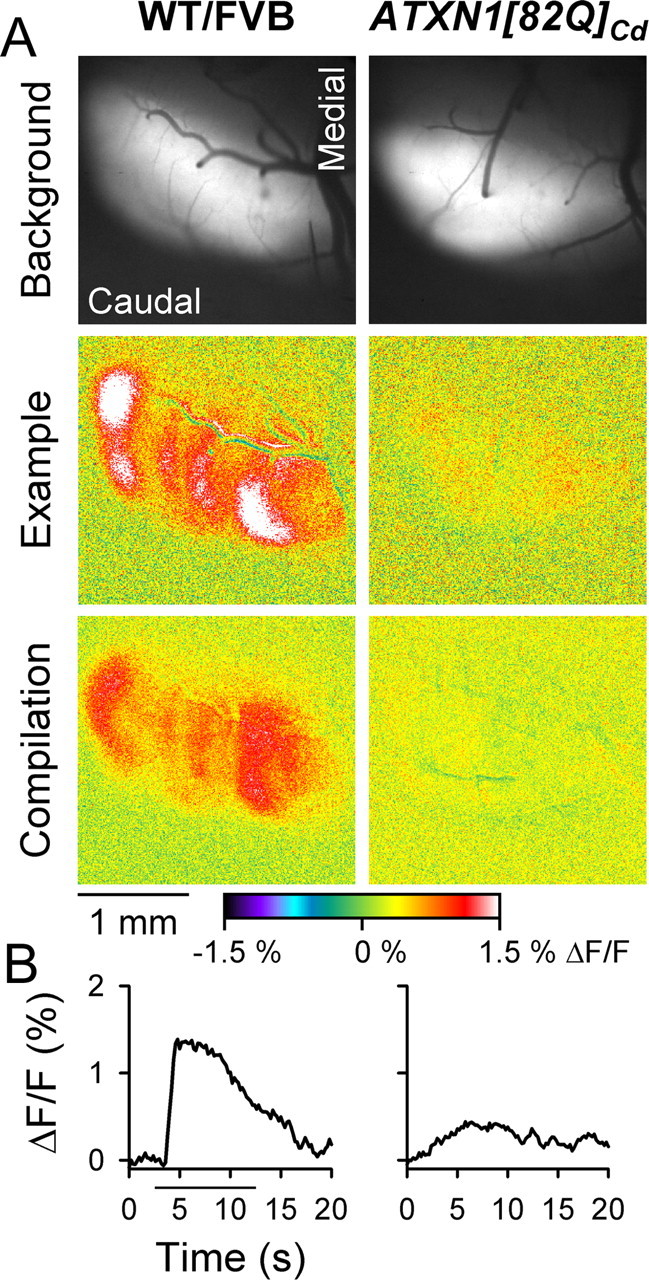
Diminished Ca2+ responses to CIO stimulation in ATXN1[82Q]Cd animals. A, Background fluorescence of Oregon Green-stained cerebella (top row) and pseudocolored images demonstrate changes in [Ca2+]i following CIO stimulation in single animals (middle rows) and compilations (bottom row) from 12-week-old WT/FVB and ATXN1[82Q]Cd mice. B, Time courses of fluorescence changes from single animals to CIO stimulation (horizontal bar).
Guided by the optical responses, the FPs evoked by CIO stimulation were recorded throughout the medial band at different depths, from the surface to a final depth of ∼400–500 μm, in ∼100 μm steps. The depth at which CF-N1 was maximal was used for quantitative comparisons, as this component reflects the initial activation of PCs by CFs (Eccles et al., 1966b). Although the characteristic negative-positive potential was observed in all animals, there were fundamental differences in the waveform between genotypes (Fig. 2C). Whereas the waveforms were similar in the nonataxic mice, regardless of age, there was a reduction in the amplitude of CF-N1 as well as the later components in ataxic ATXN1[82Q] animals at both 6 and 12 weeks of age (Fig. 2C) (data not shown). The differences in FP responses between genotypes generally mirrored the optical imaging data (F(6,31) = 11.32, p < 0.0001). Specifically, the CF-N1 amplitudes in 12-week-old WT/FVB and ATXN1[82Q]-K772T mice were indistinguishable and were greater than in all other genotypes (p = 0.08 for WT/FVB vs ATXN1[82Q]-K772T, and p < 0.004 for all other Bonferroni post hoc comparisons). Although CF-N1 was slightly smaller in 6-week-old WT/FVB and 12-week-old ATXN1[30Q] and Atxn1−/− animals (p > 0.36 for Bonferroni post hoc comparisons among the three genotypes), the CF-N1 amplitudes in 6- and 12-week-old ATXN1[82] mice were indistinguishable and were the most severely diminished to ∼30–40% that of WT/FVB animals (p = 0.09 for 6- vs 12-week-old ATXN1[82Q] mice, and p < 0.004 for Bonferroni post hoc comparisons with all other genotypes; corrected α = 0.007) (Fig. 2E).
When possible, lesions were used to mark stimulation sites in the CIO. No systematic differences were found in electrode placement between genotypes (data not shown). Although the stimulation occurred throughout the CIO complex in both the rostrocaudal and mediolateral extents, the data were consistent with the anatomical projections of CIO neurons to Crus I and II and paramedian lobule in mice, including the principle olive, dorsomedial cell group, and subnuclei of the medial nucleus (Sugihara and Quy, 2007).
Expression of the ATXN1 transgene is driven by the Pcp2 regulatory region, which drives expression of endogenous Pcp2 specifically in PCs in the cerebellum but not in the inferior olive (Lein et al., 2007). We verified by immunofluorescent detection that ATXN1[82Q] expression was restricted to PCs (data not shown). Also, GFP was not detected in the inferior olive in Pcp2-GFP mice. Therefore, it is highly unlikely that mutant ATXN1 was expressed in the inferior olive and that the deficits reflect altered physiology of inferior olivary neurons.
Together, the findings lead to four conclusions. First, expression of the expanded form of ATXN1 had the most detrimental impact on the CF–PC circuit, as affected ATXN1[82Q] mice demonstrated the smallest responses to CIO stimulation. Both the Ca2+ imaging and the FPs establish that the decreased flavoprotein responses reflect abnormal CF activation of PCs rather than downstream alterations of the flavoprotein signal. Second, loss of Atxn1 function did not drastically alter CF–PC synaptic transmission, as the optical response was indistinguishable from WT/FVB animals and the FP was reduced only minimally in Atxn1−/− mice. Third, mutant ATXN1 had to enter the nucleus to alter CF–PC synapses, which is consistent with previous results (Klement et al., 1998). Last, although overexpression of the nonpathogenic ATXN1[30Q] transgene affected the efficacy CF–PC synaptic transmission, the impact was considerably less severe than that of mutant ATXN1.
Responses to PF stimulation are unaltered in 6- and 12-week-old ATXN1[82Q] mice
Surface stimulation of the cerebellar cortex evoked a beam of increased fluorescence in Crus II in 12-week-old WT/FVB, ATXN1[30Q], and ATXN1[82Q] mice (Fig. 4A). Similar responses were obtained in 6-week-old WT/FVB and ATXN1[82Q] mice as well as all other 12-week-old control animals (data not shown). Qualitatively, the responses had several common characteristics. First, the evoked beams spanned the folium from the electrode tip to the lateral most exposed portion of the cortex in the transverse plane and extended ∼200 μm parasagittally (Fig. 4A). Second, following stimulation onset, the light phase was rapidly evoked and maintained throughout the duration of stimulation for both low- and high-frequency stimuli (10 and 100 Hz, respectively) in all mice (Fig. 4B) (100 Hz data not shown). Although high-frequency stimulation consistently elicited larger-amplitude responses than did low-frequency stimulation, peak changes in fluorescence were quantitatively indistinguishable between all genotypes under all baseline conditions (10 Hz: F(6,175) = 0.31, p = 0.93; 100 Hz: F(6,122) = 0.41, p = 0.87) (Fig. 4D) (data not shown).
Figure 4.
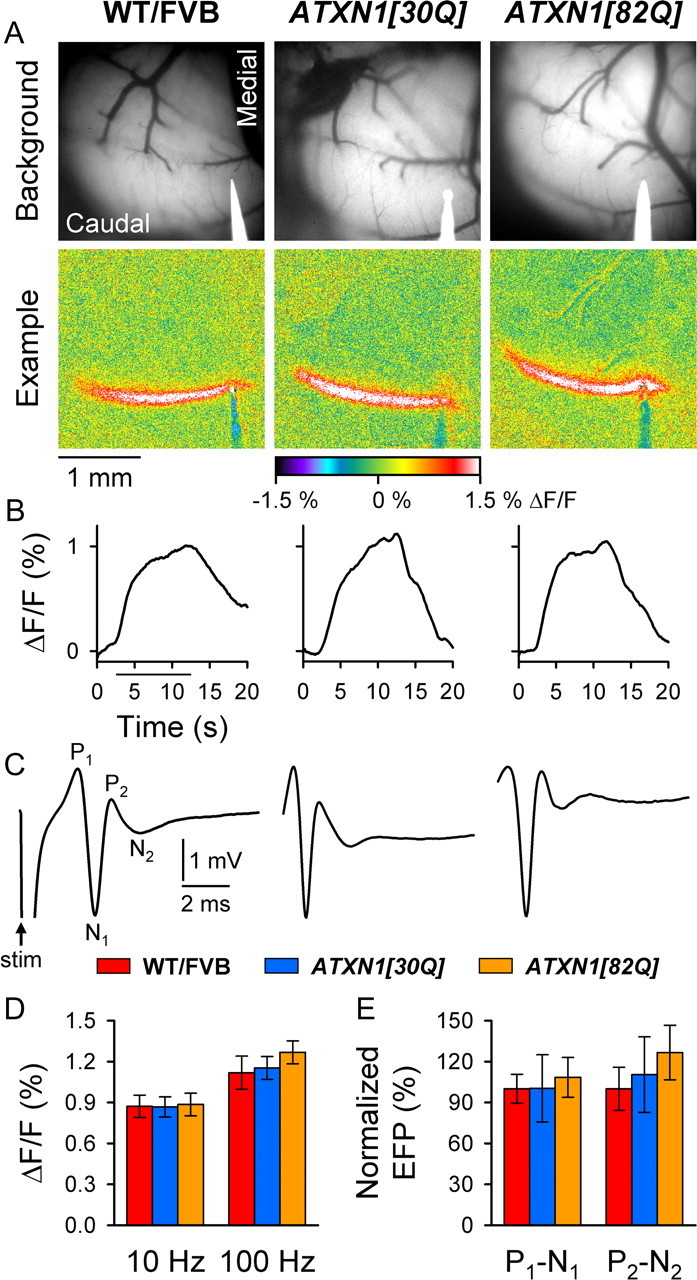
Responses to PF stimulation are indistinguishable in all genotypes. A, Background images of exposed cerebella (top row) and pseudocolored images from individual animals (bottom row) demonstrate characteristic PF-mediated responses to low-frequency (10 Hz) cerebellar cortical surface stimulation. B, Time courses of low-frequency, PF-mediated changes in flavoprotein autofluorescence. C, FPs demonstrate the characteristic P1-N1-P2-N2 waveform following surface stimulation. The stimulation artifact is shown only for WT/FVB mice. D, E, Quantification of flavoprotein autofluorescence responses and FPs to PF stimulation. WT/FVB mice: N = 25 animals, n = 75 observations for 10 Hz; N = 13 animals, n = 39 observations for 100 Hz; and N = 12, n = 35 for FPs; ATXN1[30Q] mice: N = 21, n = 63 for 10 Hz; N = 16, n = 48 for 100 Hz; and N = 8, n = 28 for FPs; 12-week-old ATXN1[82Q] mice: N = 7, n = 21 for autofluorescent flavoprotein imaging; and N = 4, n = 30 for FPs. stim, Stimulation.
The efficacy of PF–PC synaptic transmission was examined electrophysiologically by recording PF-mediated FPs. The characteristic P1-N1-P2-N2 PF response to PF stimulation was observed in all genotypes, and the example traces are qualitatively similar (Fig. 4C) (data not shown). Both the presynaptic P1-N1 and postsynaptic P2-N2 responses were indistinguishable in all mice examined (F(6,198) = 0.63, p = 0.71 and F(6,198) = 1.24, p = 0.31, respectively) (Fig. 4E and data not shown). The results demonstrate that the basic properties of PF–PC synaptic transmission were unaltered in control and ATXN1[82Q] mice through 12 weeks of age. Importantly, the autofluorescence flavoprotein response is sufficiently sensitive to detect modest abnormalities in PF–PC synaptic transmission in the tottering mouse (Chen et al., 2009), as found previously using traditional electrophysiological techniques (Matsushita et al., 2002).
Efficacy of PF–PC synaptic transmission declines in aged ATXN1[82Q] mice
Reasoning that progressive PC pathology and neuronal loss in aged mice should eventually result in decreased PF–PC synaptic transmission, we assessed whether the responses to PF stimulation declined in older animals expressing expanded ATXN1. Optical imaging and FP recordings were again used to examine the efficacy of PF–PC synaptic transmission in 40-week-old mice (Fig. 5), an age at which overt PC pathology is evident in ATXN1[82Q]Cd mice (Zu et al., 2004). Both the low- and high-frequency PF-evoked optical responses were significantly reduced in 40-week-old ATXN1[82Q]Cd mice compared with 40-week-old control animals (Fig. 5D) and all 12-week-old animals (compare Figs. 5D, 4D). This decline occurred after 28 weeks of age, as additional experiments in both 20- and 28-week-old animals showed no change in the intensity of the PF-mediated optical response (data not shown) (F(9,87) = 2.15, p = 0.03 for 10 Hz; F(9,68) = 4.00, p = 0.0004 for 100 Hz; Bonferroni post hoc test; adjusted α = 0.005, p < 0.005 for comparisons between ATXN1[82Q]Cd mice and other genotypes).
Figure 5.
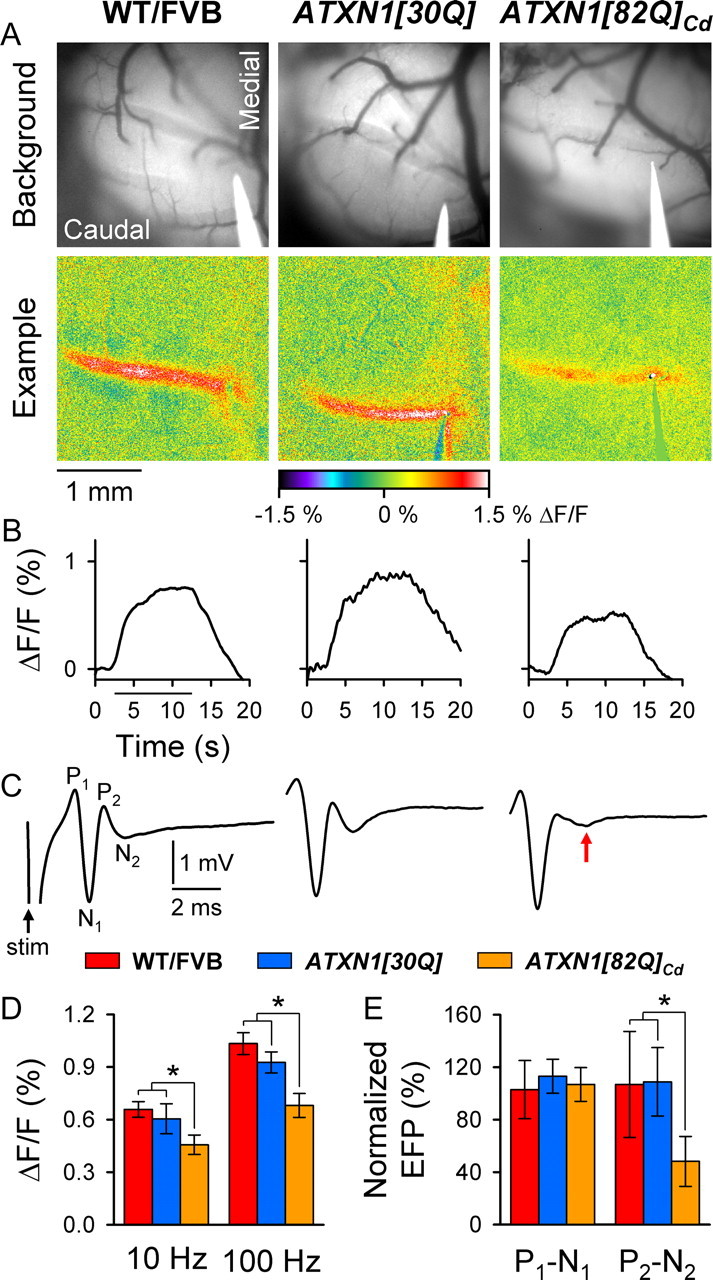
Responses to PF stimulation decline most significantly in 40-week-old ATXN1[82Q]Cd mice. A, Background images of exposed cerebella (top row) and pseudocolored images from individual animals (bottom row) demonstrate characteristic PF-mediated responses to low-frequency PF stimulation. B, Time courses of the changes in flavoprotein autofluorescence evoked by PF stimulation. C, Representative PF-mediated FP traces illustrate typical P1-N1-P2-N2 responses. The red arrow indicates a reduced postsynaptic (P2-N2) component in ATXN1[82Q]Cd mice. D, Quantification of flavoprotein autofluorescence responses following low- and high-frequency (100 Hz) PF stimulation. E, Comparison of the presynaptic and postsynaptic components of the PF-mediated FP. WT/FVB mice: N = 9 animals, n = 27 observations for autofluorescent flavoprotein imaging (AFI); and N = 5 animals, n = 33 for FPs; ATXN1[30Q] mice: N = 4, n = 12 for AFI; and N = 3, n = 24 for FPs; ATXN1[82Q]Cd mice: N = 9, n = 27 for AFI; and N = 3, n = 24 for FPs. *p < 0.00625.
The reduction in the optical response to PF stimulation in ATXN1[82Q]Cd mice was corroborated in the FP recordings (Fig. 5C, red arrow), as the postsynaptic P2-N2 component decreased significantly (F(7,202) = 4.00, p = 0.0004, Bonferroni post hoc test; adjusted α = 0.006, p < 0.006) (Fig. 5E). Importantly, the presynaptic P1-N1 component showed no change in ATXN1[82Q]Cd mice (F(7,202) = 0.32, p = 0.95) (Fig. 5E), implying that there was no change in PF excitability. In both control lines, there were no significant differences in either the presynaptic or postsynaptic components between 12 and 40 weeks (Bonferroni post hoc test, p > 0.006 for both P1-N1 and P2-N2) (Fig. 5E). These results indicate a specific loss of PC activation in aged ATXN1[82Q]Cd mice, while the PF response was unaltered.
CF–PC morphology is normal when ATXN1[82Q] is not expressed during cerebellar development
Preventing expression of ATXN1[82Q] through the second or third postnatal week mitigates the disease process in ATXN1[82Q]Cd mice and reduces their susceptibility to the effects of the mutant protein later in life (Serra et al., 2006). Therefore, we tested whether ATXN1[82Q] specifically impacted the CF–PC synapse during early postnatal cerebellar development. To accomplish this, transgene expression was blocked for the first 5 postnatal weeks, then was permitted for the subsequent 12 weeks. Thus, starting from birth (P0) through P35, doxycycline was administered to a group of ATXN1[82Q]Cd animals, after which the drug was removed and transgene expression commenced for 12 weeks. Northern blot analysis confirmed a lack of ATXN1[82Q] mRNA through the end of postnatal week 5 and initiation of expression within a week following the removal of doxycycline (Fig. 6A).
Figure 6.
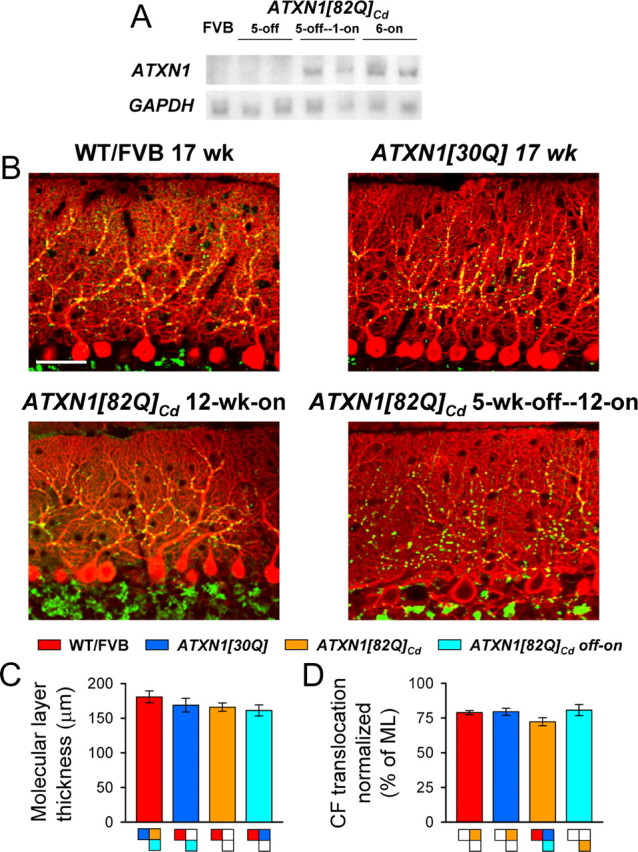
CF translocation is normal in 5-week-off—12-week-on ATXN1[82Q]Cd mice. A, Northern blot probed for ATXN1 transgene expression (top row) and GAPDH (bottom row) in 5-week-gene-off, 5-week-gene-off—1-week-gene-on, 6-week-gene-on ATXN1[82Q]Cd mice. B, Immunofluorescently stained sagittal cerebellar sections visualize calbindin-positive PCs (red) and VGLUT2-positive CF terminals (green) in 17-week-old control mice (top row) and 12-week-gene-on ATXN1[82Q]Cd and 5-week-off—12-week-on ATXN1[82Q]Cd animals (bottom row). Scale bar, 50 μm. C, Molecular layer (ML) thickness at the primary fissure. D, CF translocation measured as a percentage of molecular layer thickness. For all genotypes: N = 3 animals, n = 54 observations. Boxes denote significant differences (p < 0.01).
Using 17-week-old WT/FVB and ATXN1[30Q] mice as controls, molecular layer thickness and CF terminal placement were examined to determine whether the pathological and morphological abnormalities observed in 12-week-old ATXN1[82Q] animals (Fig. 1) were prevented in the 5-week-gene-off—12-week-gene-on mice. Sagittal cerebellar sections immunofluorescently colabeled for calbindin and VGLUT2 demonstrated proper alignment of PC somata and complex dendritic arborization in normal 17-week-old WT/FVB and control ATXN1[30Q] mice, as well as discrete CF terminal puncta properly contacting primary and secondary PC dendrites (Fig. 6B). Sections taken from 12-week-gene-on ATXN1[82Q]Cd mice, however, revealed a thinned molecular layer and incomplete CF terminal translocation, similar to those found in constitutively expressing 12-week-old ATXN1[82Q] mice (compare Figs. 6B, 1A). In the ATXN1[82Q]Cd gene-off—gene-on mice, PC dendritic arborization, molecular layer thickness, and CF translocation were similar to levels in 17-week-old ATXN1[30Q] animals (Fig. 6B). Quantification of molecular layer thickness demonstrated modest decreases in 17-week-old ATXN1[30Q], gene-off—gene-on ATXN1[82Q]Cd, and 12-week-old ATXN1[82Q]Cd mice compared with 17-week-old WT/FVB animals (F(3,8) = 4.92, p = 0.03, Bonferroni post hoc test; p < 0.0001 for FVB vs all other genotypes; p = 0.25 for ATXN1[30Q] vs 12-week- old ATXN1[82Q]Cd mice; p = 0.003 for ATXN1[30Q] vs gene-off—gene-on ATXN1[82Q]Cd mice; and p = 0.07 for 12-week-old ATXN1[82Q]Cd, gene-off—gene-on ATXN1[82Q]Cd mice; corrected α = 0.01) (Fig. 6C). Translocation of CF terminals was most depressed in 12-week-old ATXN1[82Q]Cd mice, while translocation was normal in gene-off—gene-on animals (Fig. 6D) (F(3,8) = 11.16, p = 0.003, Bonferroni post hoc test; p < 0.0001 for 12-week-old ATXN1[82Q]Cd mice vs all other genotypes; and p > 0.06 for comparisons between other genotypes). Thus, keeping the mutant transgene off during postnatal cerebellar development resulted in normal CF terminal translocation in ATXN1[82Q]Cd mice.
CF–PC synaptic transmission improves when ATXN1[82Q] is not expressed during cerebellar development
We examined the integrity of the CF–PC and PF–PC circuits using flavoprotein autofluorescence optical imaging and FP recordings in gene-off—gene-on animals. In 17-week-old WT/FVB and ATXN1[30Q] mice, CIO stimulation evoked parasagittal bands of optical activity similar to those found in 12-week-old animals. Conversely, bands of lower amplitude were elicited in 12-week-gene-on ATXN1[82Q]Cd mice (compare Figs. 2A, 7A). When the transgene was kept off during development, though, the optical response to CIO stimulation improved (Fig. 7A; compare 12-week-old ATXN1[82Q]Cd and 5-week-gene-off-12-week-gene-on mice). Improvement was also evident in the time course of the optical response (Fig. 7B). The FPs confirmed the increased CF activation of PCs, as the responses from gene-off—gene-on animals were virtually indistinguishable from control ATXN1[30Q] mice (Fig. 7C). Quantification of both the optical response (F(3,14) = 22.03, p < 0.0001, Bonferroni post hoc test; p < 0.0001 for gene-off—gene-on vs 12-week-gene-on mice) (Fig. 7D) and CF-N1 demonstrated increased CF–PC synaptic transmission in the 5-week-gene-off—12-week-gene- on ATXN1[82Q]Cd animals compared with the 12-week-old ATXN1[82Q]Cd mice (F(3,14) = 9.84, p = 0.0009, Bonferroni post hoc test; p < 0.0001 for gene-off—gene-on vs 12-week-gene-on mice) (Fig. 7E). The lesion data established similar electrode placement in the CIO for all animals in which the CIO was stimulated (data not shown).
Figure 7.
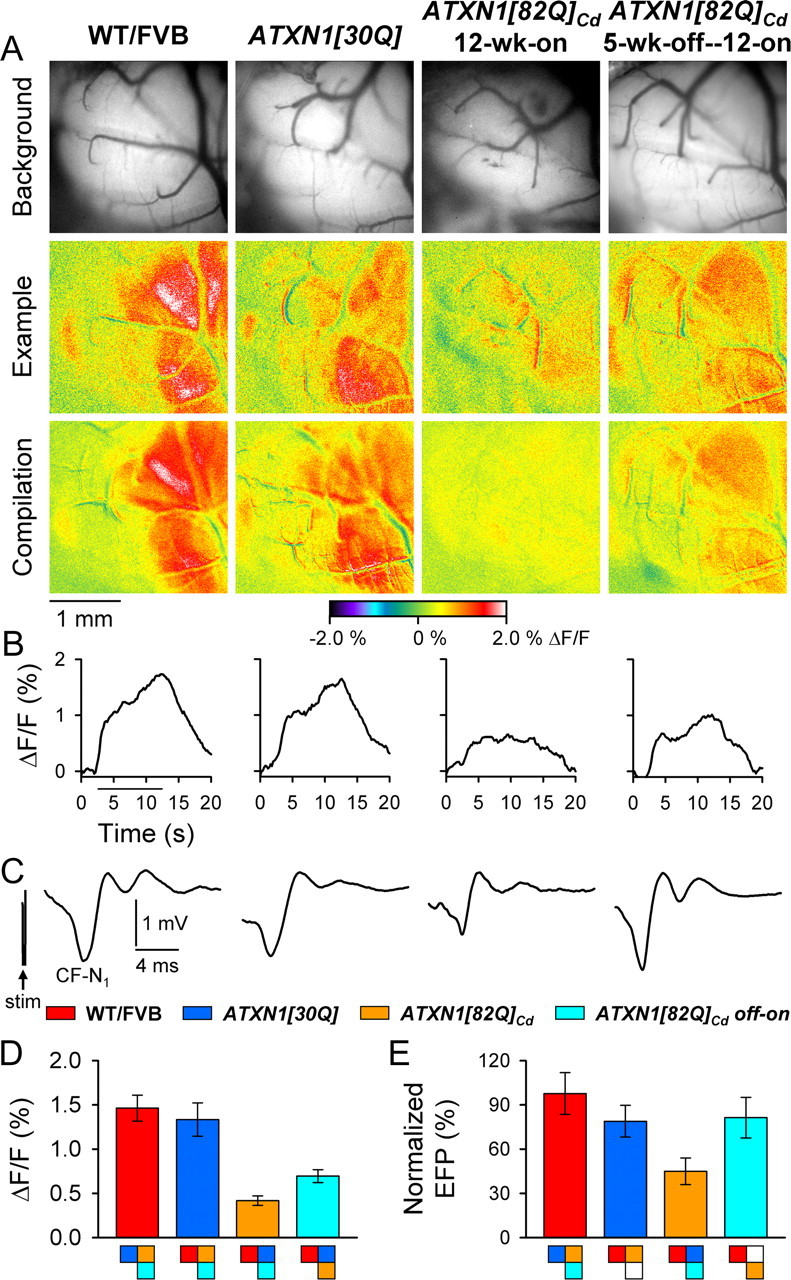
CF–PC synaptic transmission improves in 5-week-off—12-week-on ATXN1[82Q]Cd mice. A, Background images of exposed cerebella (top row), pseudocolored images from individual animals (middle row), and compilation images from each genotype (bottom row) demonstrate characteristic response patterns following CIO stimulation. B, Time courses of the changes in flavoprotein fluorescence in the cerebellar cortex evoked by CIO stimulation. C, Example traces illustrate characteristic CIO-mediated FPs. D, E, Quantification of flavoprotein autofluorescence responses and CF-N1. WT/FVB mice: N = 5 animals, n = 41 observations for both autofluorescent flavoprotein imaging and FPs; ATXN1[30Q]: N = 4, n = 31; 12-week-on ATXN1[82Q]Cd mice: N = 6, n = 25; 5-week-off—12-week-on ATXN1[82Q]Cd mice: N = 3, n = 24. Boxes denote significant differences (p < 0.01).
In these animals, we confirmed that the responses to PF stimulation remained unaltered. By both optical imaging and FP recordings, PF-mediated synaptic transmission was indistinguishable both qualitatively and quantitatively between all 12- and 17-week-old mice and gene-off—gene-on animals (F(3,24) = 0.17, p = 0.92 for 10 Hz flavoprotein autofluorescence; F(8,186) = 0.25, p = 0.98 for P1-N1; F(8,186) = 0.51, p = 0.85 for P2-N2) (data not shown). Together, these results show that the CF–PC synapse was selectively altered by ATXN1[82Q] early in the disease process, and that early postnatal cerebellar development is a critically sensitive time period during which mutant ATXN1 interferes with the CF–PC synapse.
Discussion
Using three physiological approaches, this study assessed the functional integrity of the CF–PC and PF–PC circuits in affected and unaffected ATXN1 mice. In both constitutive and conditionally symptomatic ATXN1[82Q] mice (Burright et al., 1995; Zu et al., 2004), there was a significant reduction in PC activation by CFs following CIO stimulation at 6 weeks of age, an early-stage disease time point, before detectable changes evoked by PF stimulation. A similar reduction in the efficacy of CF–PC synaptic transmission was present at 12 weeks of age, a mid-stage time point in ATXN1[82Q] mice (Clark et al., 1997). Two aspects of ATXN1[82Q] expression required for disease, entry into the nucleus of PCs (Klement et al., 1998) and expression during postnatal cerebellar development (Serra et al., 2006), were also necessary for the diminished response to CIO stimulation. Abnormalities in CF activation of PCs were not detected in Atxn1−/− mice that fail to manifest the ataxia and PC pathology seen in ATXN1[82Q]-expressing animals (Matilla et al., 1998).
In contrast, the imaging and electrophysiological responses to PF stimulation were unaltered at 6 or 12 weeks of age. A decline in PF–PC synaptic transmission does not occur until between 28 and 40 weeks of age, a time at which significant PC pathology occurs (Zu et al., 2004). Therefore, the reductions in flavoprotein autofluorescence and FP responses provide a pathophysiological and functional correlate to the morphological changes in CF–PC synapses reported here and previously (Duvick et al., 2010). While we cannot rule out the possibility that more subtle changes in PF–PC synaptic transmission occur earlier than 40 weeks in ATXN1[82Q] mice, as Hourez et al. (2011) showed using a single-cell approach, our data suggest that CF–PC synapses are more vulnerable to the effects of mutant ATXN1 than PF–PC synapses early in the disease process, suggesting that reduced CF–PC synaptic transmission contributes to the onset of motoric abnormalities. It is well established that loss of CF input alters the normal physiology and synaptic plasticity of the cerebellar cortex (Lamarre et al., 1971; Llinás and Volkind, 1973; Ito et al., 1982), and lesions of the inferior olive produce classical cerebellar motoric deficits (Murphy and O'Leary, 1971; Horn et al., 2010). Moreover, it is likely that alterations in PF–PC synaptic transmission occur during disease progression and contribute to cerebellar dysfunction. More broadly, these findings demonstrate that a pathogenic protein expressed in a specific population of neurons can cause pronounced dysfunction in a select circuit.
Reconciling results from single-cell and systems-level approaches
Using whole-cell patch-clamp recordings along with fluorometric measurements of changes in intracellular Ca2+ and Na+ following afferent stimulation, Inoue et al. (2001) reported that the basic electrophysiological and Ca2+ handling properties of ATXN1[82Q] PCs in a cerebellar slice preparation are comparable to PCs from WT/FVB mice. The observation that PC responses to PF stimulation are qualitatively normal is in agreement with our present findings in vivo. In contrast, a recent study using a single-cell approach both in a slice preparation and in vivo demonstrated both reduced intrinsic PC simple spike firing and responses to PF activation in presymptomatic ATXN1[82Q] mice (Hourez et al., 2011). One potential reason for the discrepancies between the previous studies and this one is the difference in the single-cell versus circuit-level approaches. Although we cannot exclude the possibility that a cohort of PCs responded abnormally to PF input, the aggregate response of several hundred PCs analyzed for any given PF stimulation using our methods did not reveal any substantial alterations in early-symptomatic ATXN1[82Q] mice. Furthermore, neither of the previous studies systematically examined the activation of PCs by CFs, though the recent report did identify abnormalities in complex spike duration (Hourez et al., 2011). The present findings, however, report a marked reduction in PC responses to CIO stimulation. Finally, immunofluorescent labeling of CF terminals detected a regression of CF synapses in affected mice in the most distal portion of the dendritic tree of PCs. Interestingly, Inoue et al. (2001) proposed that changes in the cerebellar neuronal circuitry may provide the mechanistic basis for ataxia in ATXN1[82Q] mice, a prediction supported by the present findings.
Nature of the deficiency in CF–PC synaptic transmission in ATXN1[82Q] mice
The paucity of expression in the inferior olive and the PC-specific nature of the transgene leads us to conclude that the underlying insult occurs initially in postsynaptic PCs. However, the results do not rule out an effect on the presynaptic CFs and a presynaptic contribution to the reduction in the response. As shown both in the present and previous studies (Duvick et al., 2010), CF extension along the more distal PC dendrites is reduced. The evidence suggests that proper PC physiology is needed for normal CF morphology and function. For example, similar to the present results, CFs fail to completely innervate their normal territory if either electrical or AMPA receptor-mediated activity is chronically blocked in adult mice (Kakizawa et al., 2005) and in P/Q-type Ca2+ α1A knock-out mice (α1A−/−) (Jun et al., 1999; Miyazaki et al., 2004). Such mice demonstrate that altering cerebellar cortical activity particularly affects presynaptic CF morphology and function, and results in motoric deficits. Whether the CF phenotype found in ATXN1[82Q]-expressing mice is a result of regression, as is the case when activity is blocked in the adult, or from an alteration in a developmental program, remains uncertain. Because CF extension is normal when ATXN1[82Q] expression is prohibited during postnatal cerebellar development, our results support the latter.
A number of possible mechanisms could contribute to the decreased CIO-evoked flavoprotein signal and FP response in ATXN1[82Q]-expressing mice. The observations that several genes involved in glutamate signaling and Ca2+ homeostasis are downregulated at early (Lin et al., 2000; Serra et al., 2004) and mid-disease stages (Serra et al., 2004) suggests that aberrant Ca2+ processing in PCs underlies the onset of ataxia in ATXN1[82Q]-expressing mice. Indeed, Ca2+ imaging in ATXN1[82Q]Cd mice revealed decreased PC responses to CIO stimulation. Also, the decreased flavoprotein autofluorescence responses might be argued to reflect a deficit in Ca2+ homeostasis, as Ca2+ influx activates oxidative metabolism (Chance, 1965; Budd and Nicholls, 1996; Reinert et al., 2007). However, the evidence suggests that the deficits are, at least in part, upstream of the Ca2+ response and reflect an abnormality in CF–PC synaptic transmission. First, the electrophysiological recordings demonstrate a postsynaptic deficit in the response to CF input. Second, the PF stimulation results serve as an internal control, showing no discernable abnormalities in general mitochondrial function or PF–PC synaptic transmission in ATXN1[82Q]Cd mice through 28 weeks of age. The results, however, do not rule out a role for changes in Ca2+ homeostasis or alterations downstream of the CF–PC synapse in the pathophysiology of SCA1. The finding that the flavoprotein autofluorescence response to CIO stimulation is reduced in ATXN1[30Q] mice and is not completely restored to control levels in 5-week-off—12-week-on ATXN1[82Q]Cd animals, while the electrophysiological responses are less affected, suggests transgene overexpression and translocation of either form of ATXN1 into the nucleus may impact other aspects of PC physiology or intracellular signaling.
The reduction in CF–PC synaptic transmission depends on the following two requirements for disease in mice: entrance of ATXN1[82Q] into the nucleus and expression during postnatal cerebellar development. Moreover, loss of Atxn1 had no effect on CF–PC synaptic transmission. Thus, due to the ability of ATXN1 to associate with RNA (Yue et al., 2001) and alter transcriptional activity (Lam et al., 2006), and its potential role in RNA processing (Irwin et al., 2005; Lim et al., 2008; de Chiara et al., 2009), it is plausible that the functional and morphological deficits are due to alterations in gene expression and/or RNA processing of factors particularly important to the CF–PC synapse. Furthermore, how presynaptic CFs are affected could be explained by such phenomena as the transneuronal action of insulin-like growth factor type I, which plays an important role in the refinement of CF–PC synapses in the developing cerebellum (Kakizawa et al., 2003). Interestingly, altered insulin-like growth factor type I signaling has been reported in ATXN1[82Q] mice, though how such changes impact PC physiology or cerebellar development in those mice remains unclear (Gatchel et al., 2008).
Ramifications for other polyglutamine diseases
While neuronal dysfunction is a common theme in the pathophysiology of polygutamine diseases (Tang et al., 2003; Chen et al., 2008; Liu et al., 2009), how such alterations impact the function of neuronal circuits is largely unknown. Our results suggest that abnormal physiology in specific circuits of effected neurons may provide the substrate for functional alterations. Although an effected neuron may receive multiple inputs, it is possible to preferentially impact a specific type of synapse. In that way, the mutant protein is exerting its toxic effect specifically, rather than indiscriminately altering neuronal physiology. Such changes may thus influence the output of the affected neuronal circuits and result in behavioral abnormalities. For SCA1, the abnormalities at the CF–PC synapse are likely to contribute to disease initiation and motoric deficits, and highlight the importance of identifying factors unique to the CF–PC synapse that contribute to its dysfunction.
Footnotes
This work was supported in part by National Institutes of Health Grants NS062561 (J.A.B.), NS048944 (T.J.E.), NS022920 (H.T.O), and NS062158 (T.J.E, H.T.O.).
We thank Dr. Nathan D. Jorgensen for his early efforts in this collaboration between the Orr and Ebner laboratories.
The authors declare no competing financial interests.
References
- Budd SL, Nicholls DG. A reevaluation of the role of mitochondria in neuronal Ca2+ homeostasis. J Neurochem. 1996;66:403–411. doi: 10.1046/j.1471-4159.1996.66010403.x. [DOI] [PubMed] [Google Scholar]
- Burright EN, Clark HB, Servadio A, Matilla T, Feddersen RM, Yunis WS, Duvick LA, Zoghbi HY, Orr HT. SCA1 transgenic mice: a model for neurodegeneration caused by an expanded CAG trinucleotide repeat. Cell. 1995;82:937–948. doi: 10.1016/0092-8674(95)90273-2. [DOI] [PubMed] [Google Scholar]
- Chance B. The energy-linked reaction of calcium with mitochondria. J Biol Chem. 1965;240:2729–2748. [PubMed] [Google Scholar]
- Chen G, Popa LS, Wang X, Gao W, Barnes J, Hendrix CM, Hess EJ, Ebner TJ. Low frequency oscillations in the cerebellar cortex of the tottering mouse. J Neurophysiol. 2009;101:234–245. doi: 10.1152/jn.90829.2008. [DOI] [PMC free article] [PubMed] [Google Scholar]
- Chen X, Tang TS, Tu H, Nelson O, Pook M, Hammer R, Nukina N, Bezprozvanny I. Deranged calcium signaling and neurodegeneration in spinocerebellar ataxia type 3. J Neurosci. 2008;28:12713–12724. doi: 10.1523/JNEUROSCI.3909-08.2008. [DOI] [PMC free article] [PubMed] [Google Scholar]
- Clark HB, Burright EN, Yunis WS, Larson S, Wilcox C, Hartman B, Matilla A, Zoghbi HY, Orr HT. Purkinje cell expression of a mutant allele of SCA1 in transgenic mice leads to disparate effects on motor behaviors, followed by a progressive cerebellar dysfunction and histological alterations. J Neurosci. 1997;17:7385–7395. doi: 10.1523/JNEUROSCI.17-19-07385.1997. [DOI] [PMC free article] [PubMed] [Google Scholar]
- de Chiara C, Menon RP, Strom M, Gibson TJ, Pastore A. Phosphorylation of S776 and 14–3-3 binding modulate ataxin-1 interaction with splicing factors. PLoS One. 2009;4:e8372. doi: 10.1371/journal.pone.0008372. [DOI] [PMC free article] [PubMed] [Google Scholar]
- Duvick L, Barnes J, Ebner B, Agrawal S, Andresen J, Lim J, Geisler G, Zoghbi HY, Orr HT. SCA1-like disease in mice expressing wild-type ataxin-1 with a serine to aspartic acid replacement at residue 776. Neuron. 2010;67:929–935. doi: 10.1016/j.neuron.2010.08.022. [DOI] [PMC free article] [PubMed] [Google Scholar]
- Eccles JC, Llinás R, Sasaki K. Parallel fibre stimulation and the responses induced thereby in the Purkinje cells of the cerebellum. Exp Brain Res. 1966a;1:17–39. doi: 10.1007/BF00235207. [DOI] [PubMed] [Google Scholar]
- Eccles JC, Llinás R, Sasaki K. The excitatory synaptic action of climbing fibres on the purinje cells of the cerebellum. J Physiol. 1966b;182:268–296. doi: 10.1113/jphysiol.1966.sp007824. [DOI] [PMC free article] [PubMed] [Google Scholar]
- Ekerot CF, Garwicz M, Schouenborg J. Topography and nociceptive receptive fields of climbing fibres projecting to the cerebellar anterior lobe in the rat. J Physiol. 1991;441:257–274. doi: 10.1113/jphysiol.1991.sp018750. [DOI] [PMC free article] [PubMed] [Google Scholar]
- Gao W, Chen G, Reinert KC, Ebner TJ. Cerebellar cortical molecular layer inhibition is organized in parasagittal zones. J Neurosci. 2006;26:8377–8387. doi: 10.1523/JNEUROSCI.2434-06.2006. [DOI] [PMC free article] [PubMed] [Google Scholar]
- Gatchel JR, Watase K, Thaller C, Carson JP, Jafar-Nejad P, Shaw C, Zu T, Orr HT, Zoghbi HY. The insulin-like growth factor pathway is altered in spinocerebellar ataxia type 1 and type 7. Proc Natl Acad Sci U S A. 2008;105:1291–1296. doi: 10.1073/pnas.0711257105. [DOI] [PMC free article] [PubMed] [Google Scholar]
- Horn KM, Pong M, Gibson AR. Functional relations of cerebellar modules of the cat. J Neurosci. 2010;30:9411–9423. doi: 10.1523/JNEUROSCI.0440-10.2010. [DOI] [PMC free article] [PubMed] [Google Scholar]
- Hourez R, Servais L, Orduz D, Gall D, Millard I, de Kerchove d'exaerde A, Cheron G, Orr HT, Pandolfo M, Schiffmann SN. Aminopyridines correct early dysfunction and delay neurodegeneration in a mouse model of spinocerebellar ataxia type 1. J Neurosci. 2011 doi: 10.1523/JNEUROSCI.0905-11.2011. in press. [DOI] [PMC free article] [PubMed] [Google Scholar]
- Inoue T, Lin X, Kohlmeier KA, Orr HT, Zoghbi HY, Ross WN. Calcium dynamics and electrophysiological properties of cerebellar Purkinje cells in SCA1 transgenic mice. J Neurophysiol. 2001;85:1750–1760. doi: 10.1152/jn.2001.85.4.1750. [DOI] [PubMed] [Google Scholar]
- Irwin S, Vandelft M, Pinchev D, Howell JL, Graczyk J, Orr HT, Truant R. RNA association and nucleocytoplasmic shuttling by ataxin-1. J Cell Sci. 2005;118:233–242. doi: 10.1242/jcs.01611. [DOI] [PubMed] [Google Scholar]
- Ito M, Sakurai M, Tongroach P. Climbing fibre induced depression of both mossy fibre responsiveness and glutamate sensitivity of cerebellar Purkinje cells. J Physiol. 1982;324:113–134. doi: 10.1113/jphysiol.1982.sp014103. [DOI] [PMC free article] [PubMed] [Google Scholar]
- Jun K, Piedras-Rentería ES, Smith SM, Wheeler DB, Lee SB, Lee TG, Chin H, Adams ME, Scheller RH, Tsien RW, Shin HS. Ablation of P/Q-type Ca2+ channel currents, altered synaptic transmission, and progressive ataxia in mice lacking the α1A-subunit. Proc Natl Acad Sci U S A. 1999;96:15245–15250. doi: 10.1073/pnas.96.26.15245. [DOI] [PMC free article] [PubMed] [Google Scholar]
- Kakizawa S, Yamada K, Iino M, Watanabe M, Kano M. Effects of insulin-like growth factor I on climbing fibre synapse elimination during cerebellar development. Eur J Neurosci. 2003;17:545–554. doi: 10.1046/j.1460-9568.2003.02486.x. [DOI] [PubMed] [Google Scholar]
- Kakizawa S, Miyazaki T, Yanagihara D, Iino M, Watanabe M, Kano M. Maintenance of presynaptic function by AMPA receptor-mediated excitatory postsynaptic activity in adult brain. Proc Natl Acad Sci U S A. 2005;102:19180–19185. doi: 10.1073/pnas.0504359103. [DOI] [PMC free article] [PubMed] [Google Scholar]
- Klement IA, Skinner PJ, Kaytor MD, Yi H, Hersch SM, Clark HB, Zoghbi HY, Orr HT. Ataxin-1 nuclear localization and aggregation: role in polyglutamine-induced disease in SCA1 transgenic mice. Cell. 1998;95:41–53. doi: 10.1016/s0092-8674(00)81781-x. [DOI] [PubMed] [Google Scholar]
- Lamarre Y, de Montigny C, Dumont M, Weiss M. Harmaline-induced rhythmic activity of cerebellar and lower brain stem neurons. Brain Res. 1971;32:246–250. doi: 10.1016/0006-8993(71)90174-0. [DOI] [PubMed] [Google Scholar]
- Lam YC, Bowman AB, Jafar-Nejad P, Lim J, Richman R, Fryer JD, Hyun ED, Duvick LA, Orr HT, Botas J, Zoghbi HY. ATAXIN-1 interacts with the repressor Capicua in its native complex to cause SCA1 neuropathology. Cell. 2006;127:1335–1347. doi: 10.1016/j.cell.2006.11.038. [DOI] [PubMed] [Google Scholar]
- Lein ES, Hawrylycz MJ, Ao N, Ayres M, Bensinger A, Bernard A, Boe AF, Boguski MS, Brockway KS, Byrnes EJ, Chen L, Chen L, Chen TM, Chin MC, Chong J, Crook BE, Czaplinska A, Dang CN, Datta S, Dee NR, et al. Genome-wide atlas of gene expression in the adult mouse brain. Nature. 2007;445:168–176. doi: 10.1038/nature05453. [DOI] [PubMed] [Google Scholar]
- Lim J, Crespo-Barreto J, Jafar-Nejad P, Bowman AB, Richman R, Hill DE, Orr HT, Zoghbi HY. Opposing effects of polyglutamine expansion on native protein complexes contribute to SCA1. Nature. 2008;452:713–718. doi: 10.1038/nature06731. [DOI] [PMC free article] [PubMed] [Google Scholar]
- Lin X, Antalffy B, Kang D, Orr HT, Zoghbi HY. Polyglutamine expansion down-regulates specific neuronal genes before pathologic changes in SCA1. Nat Neurosci. 2000;3:157–163. doi: 10.1038/72101. [DOI] [PubMed] [Google Scholar]
- Liu J, Tang TS, Tu H, Nelson O, Herndon E, Huynh DP, Pulst SM, Bezprozvanny I. Deranged calcium signaling and neurodegeneration in spinocerebellar ataxia type 2. J Neurosci. 2009;29:9148–9162. doi: 10.1523/JNEUROSCI.0660-09.2009. [DOI] [PMC free article] [PubMed] [Google Scholar]
- Llinás R, Volkind RA. The olivo-cerebellar system: functional properties as revealed by harmaline-induced tremor. Exp Brain Res. 1973;18:69–87. doi: 10.1007/BF00236557. [DOI] [PubMed] [Google Scholar]
- Matilla A, Roberson ED, Banfi S, Morales J, Armstrong DL, Burright EN, Orr HT, Sweatt JD, Zoghbi HY, Matzuk MM. Mice lacking ataxin-1 display learning deficits and decreased hippocampal paired-pulse facilitation. J Neurosci. 1998;18:5508–5516. doi: 10.1523/JNEUROSCI.18-14-05508.1998. [DOI] [PMC free article] [PubMed] [Google Scholar]
- Matsushita K, Wakamori M, Rhyu IJ, Arii T, Oda S, Mori Y, Imoto K. Bidirectional alterations in cerebellar synaptic transmission of tottering and rolling Ca2+ channel mutant mice. J Neurosci. 2002;22:4388–4398. doi: 10.1523/JNEUROSCI.22-11-04388.2002. [DOI] [PMC free article] [PubMed] [Google Scholar]
- Miyazaki T, Hashimoto K, Shin HS, Kano M, Watanabe M. P/Q-type Ca2+ channel α1A regulates synaptic competition on developing cerebellar Purkinje cells. J Neurosci. 2004;24:1734–1743. doi: 10.1523/JNEUROSCI.4208-03.2004. [DOI] [PMC free article] [PubMed] [Google Scholar]
- Murphy MG, O'Leary JL. Neurological deficit in cats with lesions of the olivocerebellar system. Arch Neurol. 1971;24:145–157. doi: 10.1001/archneur.1971.00480320073007. [DOI] [PubMed] [Google Scholar]
- Orr HT, Zoghbi HY. Trinucleotide repeat disorders. Annu Rev Neurosci. 2007;30:575–621. doi: 10.1146/annurev.neuro.29.051605.113042. [DOI] [PubMed] [Google Scholar]
- Orr HT, Chung MY, Banfi S, Kwiatkowski TJ, Jr, Servadio A, Beaudet AL, McCall AE, Duvick LA, Ranum LP, Zoghbi HY. Expansion of an unstable trinucleotide CAG repeat in spinocerebellar ataxia type 1. Nat Genet. 1993;4:221–226. doi: 10.1038/ng0793-221. [DOI] [PubMed] [Google Scholar]
- Palay SL, Chan-Palay V. Cerebellar cortex, cytology and organization. New York: Springer; 1974. [Google Scholar]
- Reinert KC. Graduate school. Minneapolis, MN: University of Minnesota; 2006. Autofluorescence imaging in the cerebellar cortex in vivo; p. 195. [Google Scholar]
- Reinert KC, Dunbar RL, Gao W, Chen G, Ebner TJ. Flavoprotein autofluorescence imaging of neuronal activation in the cerebellar cortex in vivo. J Neurophysiol. 2004;92:199–211. doi: 10.1152/jn.01275.2003. [DOI] [PubMed] [Google Scholar]
- Reinert KC, Gao W, Chen G, Ebner TJ. Flavoprotein autofluorescence imaging in the cerebellar cortex in vivo. J Neurosci Res. 2007;85:3221–3232. doi: 10.1002/jnr.21348. [DOI] [PubMed] [Google Scholar]
- Serra HG, Byam CE, Lande JD, Tousey SK, Zoghbi HY, Orr HT. Gene profiling links SCA1 pathophysiology to glutamate signaling in Purkinje cells of transgenic mice. Hum Mol Genet. 2004;13:2535–2543. doi: 10.1093/hmg/ddh268. [DOI] [PubMed] [Google Scholar]
- Serra HG, Duvick L, Zu T, Carlson K, Stevens S, Jorgensen N, Lysholm A, Burright E, Zoghbi HY, Clark HB, Andresen JM, Orr HT. RORα-mediated Purkinje cell development determines disease severity in adult SCA1 mice. Cell. 2006;127:697–708. doi: 10.1016/j.cell.2006.09.036. [DOI] [PubMed] [Google Scholar]
- Stosiek C, Garaschuk O, Holthoff K, Konnerth A. In vivo two-photon calcium imaging of neuronal networks. Proc Natl Acad Sci U S A. 2003;100:7319–7324. doi: 10.1073/pnas.1232232100. [DOI] [PMC free article] [PubMed] [Google Scholar]
- Sugihara I. Organization and remodeling of the olivocerebellar climbing fiber projection. Cerebellum. 2006;5:15–22. doi: 10.1080/14734220500527385. [DOI] [PubMed] [Google Scholar]
- Sugihara I, Quy PN. Identification of aldolase C compartments in the mouse cerebellar cortex by olivocerebellar labeling. J Comp Neurol. 2007;500:1076–1092. doi: 10.1002/cne.21219. [DOI] [PubMed] [Google Scholar]
- Sugihara I, Shinoda Y. Molecular, topographic, and functional organization of the cerbellar cortex: a study with combined aldolaseC and olivocerebellar labeling. J Neurosci. 2004;24:8771–8785. doi: 10.1523/JNEUROSCI.1961-04.2004. [DOI] [PMC free article] [PubMed] [Google Scholar]
- Sugihara I, Wu HS, Shinoda Y. The entire trajectories of single olivocerebellar axons in the cerebellar cortex and their contribution to cerebellar compartmentalization. J Neurosci. 2001;21:7715–7723. doi: 10.1523/JNEUROSCI.21-19-07715.2001. [DOI] [PMC free article] [PubMed] [Google Scholar]
- Sullivan MR, Nimmerjahn A, Sarkisov DV, Helmchen F, Wang SS. In vivo calcium imaging of circuit activity in cerebellar cortex. J Neurophysiol. 2005;94:1636–1644. doi: 10.1152/jn.01013.2004. [DOI] [PubMed] [Google Scholar]
- Tang TS, Tu H, Chan EY, Maximov A, Wang Z, Wellington CL, Hayden MR, Bezprozvanny I. Huntingtin and huntingtin-associated protein 1 influence neuronal calcium signaling mediated by inositol-(1,4,5) triphosphate receptor type 1. Neuron. 2003;39:227–239. doi: 10.1016/s0896-6273(03)00366-0. [DOI] [PMC free article] [PubMed] [Google Scholar]
- Voogd J, Glickstein M. The anatomy of the cerebellum. Trends Neurosci. 1998;21:370–375. doi: 10.1016/s0166-2236(98)01318-6. [DOI] [PubMed] [Google Scholar]
- Wang X, Chen G, Gao W, Ebner T. Long-term potentiation of the responses to parallel fiber stimulation in mouse cerebellar cortex in vivo. Neuroscience. 2009;162:713–722. doi: 10.1016/j.neuroscience.2009.01.071. [DOI] [PMC free article] [PubMed] [Google Scholar]
- Yue S, Serra HG, Zoghbi HY, Orr HT. The spinocerebellar ataxia type 1 protein, ataxin-1, has RNA-binding activity that is inversely affected by the length of its polyglutamine tract. Hum Mol Genet. 2001;10:25–30. doi: 10.1093/hmg/10.1.25. [DOI] [PubMed] [Google Scholar]
- Zu T, Duvick LA, Kaytor MD, Berlinger MS, Zoghbi HY, Clark HB, Orr HT. Recovery from polyglutamine-induced neurodegeneration in conditional SCA1 transgenic mice. J Neurosci. 2004;24:8853–8861. doi: 10.1523/JNEUROSCI.2978-04.2004. [DOI] [PMC free article] [PubMed] [Google Scholar]