

Abstract
Correlated firing among populations of neurons is present throughout the brain and is often rhythmic in nature, observable as an oscillatory fluctuation in the local field potential. Although rhythmic population activity is believed to be critical for normal function in many brain areas, synchronized neural oscillations are associated with disease states in other cases. In the globus pallidus (GP in rodents, homolog of the primate GPe), pairs of neurons generally have uncorrelated firing in normal animals despite an anatomical organization suggesting that they should receive substantial common input. In contrast, correlated and rhythmic GP firing is observed in animal models of Parkinson's disease (PD). Based in part on these findings, it has been proposed that an important part of basal ganglia function is active decorrelation, whereby redundant information is compressed. Mechanisms that implement active decorrelation, and changes that cause it to fail in PD, are subjects of great interest. Rat GP neurons express fast, transient voltage-dependent sodium channels (NaF channels) in their dendrites, with the expression level being highest near asymmetric synapses. We recently showed that the dendritic NaF density strongly influences the responsiveness of model GP neurons to synchronous excitatory inputs. In the present study, we use rat GP neuron models to show that dendritic NaF channel expression is a potential cellular mechanism of active decorrelation. We further show that model neurons with lower dendritic NaF channel expression have a greater tendency to phase lock with oscillatory synaptic input patterns like those observed in PD.
Introduction
Information coding in the mammalian brain is believed to be a population phenomenon in which correlated activity of neural subpopulations is critical for signal transmission. Correlated population activity in many brain areas has a rhythmic character that produces an oscillatory signal in local field potential (LFP) or EEG recordings. Oscillatory neural synchronization is believed to play a critical role in many brain processes (Buzsáki and Draguhn, 2004; Fries, 2009), and impaired synchronization may contribute to clinical symptoms in schizophrenia, autism, and Alzheimer's disease (Uhlhaas and Singer, 2006). In the basal ganglia, however, correlated activity between neurons in behaving animals is low in the normal state but elevated in Parkinson's disease (PD) (Israel and Bergman, 2008). The globus pallidus (GP in rodents, GPe in primates), a basal ganglia nucleus composed primarily of GABAergic projection neurons, has an anatomical organization suggesting that neighboring GP neurons should receive substantial shared input based on the size and orientation of their dendritic arbors relative to their afferent fibers (Percheron et al., 1984; Percheron and Filion, 1991; Yelnik, 2002). However, functional studies show that the activity of both distant and neighboring pairs of GP neurons is generally uncorrelated in normal animals (Nini et al., 1995; Heimer et al., 2002; Bar-Gad et al., 2003; Mallet et al., 2008b). These findings have contributed to the hypothesis that there is a mechanism of active decorrelation in the basal ganglia (Bar-Gad et al., 2003), whereby redundant information is compressed into a compact representation. The uncorrelated nature of GP activity breaks down in PD, in which synchronized oscillatory activity emerges in multiple basal ganglia nuclei, including the GP and its principal source of excitation, the subthalamic nucleus (STN). Abnormally high synchronization and oscillatory activity in the GP and STN have been observed in parkinsonian patients (Levy et al., 2002; Silberstein et al., 2003; Kühn et al., 2005, 2008), monkeys (Nini et al., 1995; Raz et al., 2000; Heimer et al., 2002; Soares et al., 2004), and rats (Sharott et al., 2005; Mallet et al., 2008a,b).
In rats, GP neuron dendrites express fast, transient, voltage-dependent Na+ channels (NaF channels) with a distribution that is enriched near sites of excitatory synaptic input, and slice recordings indicate that excitatory synaptic inputs can trigger propagating dendritic action potentials under some circumstances (Hanson et al., 2004). This may also be true in other species but remains to be investigated. We recently showed that, in multicompartmental GP neuron models, high dendritic NaF channel expression resulted in exquisite sensitivity to synchronous excitatory events occurring close together in the dendritic tree (Edgerton et al., 2010), raising the possibility that dendritic NaF channel expression could modulate the propagation of synchronous oscillations through the basal ganglia network. In the present study, we used the same set of model neurons and developed a novel method of generating artificial parkinsonian spike trains from neurophysiological data to determine how dendritic NaF channel expression would affect GP neuron responses to parkinsonian input patterns.
Materials and Methods
Simulations
Simulations were performed using GENESIS 2.3 (www.genesis-sim.org/GENESIS) and analyzed with Matlab (MathWorks). Most simulations were run on the Emory High Performance Computing Cluster (Sun Microsystems). Approximately 1 s of simulated data could be generated per minute on each processor core.
Model properties
The model neurons used in this study were derived from a combined electrophysiology and modeling database study (Günay et al., 2008) and have been described in detail previously (Edgerton et al., 2010). The code necessary to run simulations with the models is available for download from ModelDB (http://senselab.med.yale.edu/modelDB/, accession number 136315). The models were designed to match the electrophysiological properties of GP neurons recorded in brain slices prepared from male Sprague Dawley rats, ages P16–P21. Only the synaptic inputs differed between this study and our previous one with these models. The passive biophysical parameters of the model neurons were CM = 0.024 F/m2, RM = 1.47 Ωm2, and RA = 1.74 Ωm. A canonical axon was connected to the soma to allow for axonal spike initiation and realistic axonal current sinks and sources. This axon was adapted from Shen et al. (1999), with an initial segment, three myelinated internodal segments and two unmyelinated nodes of Ranvier. The myelinated compartments had no active conductances and had the following passive parameter values: CM = 0.00024 F/m2, RM = 10 Ωm2, RA = 1.74 Ωm.
The model neurons contained nine different types of ion channels (eight voltage-dependent, one calcium-dependent) based on experimental data. Except for the simulations in which the density of HCN and SK channel expression was varied, the nine model neurons that were used in this study differed from one another in only one respect: the distribution of NaF channels in their dendrites. The model neuron with the most NaF conductance had a uniform density of NaF channels throughout the soma and dendrites, whereas the remaining variants had a declining proximal–distal gradient of NaF channels determined by the following equation:
where gNaF(i) is the conductance density of NaF in dendritic compartment i, xi is the path distance (in micrometers) separating compartment i from the soma, and L is a length constant that determines the steepness of the gradient. The model neurons with dendritic gNaF gradients had the following values for the parameter L (in μm): 500, 250, 150, 100, 75, 50, 25, and 10. For one part of the study, the levels of SK and HCN channel expression were systematically varied to assess the contributions of these channels to the model neuron response properties. In these simulations, the persistent sodium channel density (gNaP) was reduced by ∼20% so that the GP neurons would be quiescent when HCN channels were absent. This was done because of a recent report that, in dopamine-depleted rodent GP neurons, HCN channel expression is reduced and the neurons become quiescent in the absence of stimulation (Chan et al., 2011). The original HCN channel parameters were based on whole-cell recordings from GP neurons in brain slices (Chan et al., 2004), a method that involves washout of soluble cytoplasmic elements. HCN channels are strongly modulated by cAMP and cGMP, with binding of these nucleotides shifting the half-activation voltage of the channels to the right by 10–25 mV and resulting in greater channel activity in the physiological voltage range (Wahl-Schott and Biel, 2009). To ensure that the HCN channel activity was not underestimated, we right-shifted the half-activation voltage of the channels by +20 mV for this part of the study. The ion channel density parameters for all of the nine-channel model simulations are summarized in Table 1.
Table 1.
Ion channel densities in the model GP neurons used in this study
| Channel | Soma (S/m2) | Dendrite (S/m2) | Axon (S/m2)a |
|---|---|---|---|
| NaF | 500 | 500b | 1750 |
| NaP | 1.015c | 1.523 | 3.55 |
| Kv2 | 20 | 20 | 100 |
| Kv3 | 40 | 40 | 200 |
| Kv4 | 50d | 100d | 500 |
| KCNQ | 2 | 2 | 10 |
| CaHVA | 0.3 | 0.3–0.9e | 0 |
| SKf | 64 | 0.12 | 0 |
| HCN | 0.7g | 0.7g | 0 |
aAxonal channels were present in the initial segment and internodal segments only.
bRefers to the model with uniform dendritic gNaF.
cFor Figure 10, these values were decreased to 0.8 (soma) and 1.2 (dendrite).
dForty percent rapidly inactivating, 60% slowly inactivating.
eA total of 0.3 for large-diameter dendrites, 0.6 for medium, 0.9 for small.
fFor Figure 10, density values were multiplied by 0 (−), 1 (+), or 2.5 (++).
gMixture of homomeric HCN2 (5 of 7 of total) and heteromeric HCN1/HCN2 (2 of 7 of total). For Figure 10, the baseline density was increased from 0.7 to 3.5 S/m2, and this value was multiplied by 0 (−), 1 (+), or 10 (++) in the different simulations.
Simplified two-channel models
The models described above contained nine different ion channel types because of experimental evidence that all of those channel types are expressed in rat GP neurons. Although those models have the obvious benefit of incorporating known features of the real biological system, they bring about the question of whether the results we observed are limited to the complex ion channel context that we used or whether the results are more generally applicable. To address this question, we used an additional set of models that contained the minimal set of ion channels necessary to examine the effect of dendritic NaF channel expression: NaF channels and delayed rectifier potassium channels (Kv2 subtype). These simplified models were also first described in a previous publication (Edgerton et al., 2010). The ion channel density parameters are summarized in Table 2.
Table 2.
Ion channel densities in the simplified two-channel models
aAxonal channels were present in the initial segment and internodal segments only.
b Refers to the model with uniform dendritic gNaF.
Simple synaptic inputs
For the simulations using artificial sinusoidal input patterns described in Figures 1–4, synaptic conductances were modeled as generic AMPA synapses (rise time, 1 ms; decay time, 3 ms; reversal potential, 0 mV; unitary amplitude, 250 pS) or GABAA synapses (rise time, 1 ms; fall time, 12 ms; reversal potential, −80 mV; unitary amplitude, 250 pS) uniformly distributed throughout the dendritic tree and activated with random timing. The dendritic compartments in the model were not all the same size, so uniform synapse distributions were implemented by making each compartment receive synaptic input at rates that were proportional to the membrane surface area of the compartment. The mean synaptic conductance density of each synapse type (AMPA or GABAA) was therefore uniform across all dendritic compartments. This choice of input properties is taken from our previous study (Edgerton et al., 2010) and allows for a direct comparison with our previous findings. As noted below, more biophysically accurate synaptic parameters may be desirable for realistic parkinsonian input patterns. When these more complex synaptic properties were tested with simple sinusoidal input patterns, no noteworthy differences were seen (results not shown because of space limitations).
Figure 1.

High dendritic gNaF reduced the sensitivity of the model GP neuron to sinusoidal oscillations in the input. In the examples shown, both the oscillation rate and the average model neuron firing rates were 20 Hz. Whether the oscillation was present in the excitatory synaptic inputs (A, B) or the inhibitory synaptic inputs (C, D), the oscillations were reflected much more strongly in the output of the model neurons with lower dendritic gNaF levels. Simulations were 100 s long. Raster plots and histograms were constructed by dividing the data into 100 equal segments and discarding the first segment. For the simulations in A and B, the average excitation rate was 10,220 events/s for all models (with 10% oscillation amplitude). The inhibitory input was non-oscillatory and had the following average rates (events/s): 4982 for the axonal spiking model, 6336 for the mixed spiking model, and 16,199 for the dendritic spiking model. For the simulations in C and D, the average inhibition rate was 3066 events/s for all models (with 25% oscillation amplitude). The excitatory input was non-oscillatory and had the following average rates (events/s): 7052 for the axonal spiking model, 5391 for the mixed spiking model, and 2351 for the dendritic spiking model.
Figure 2.
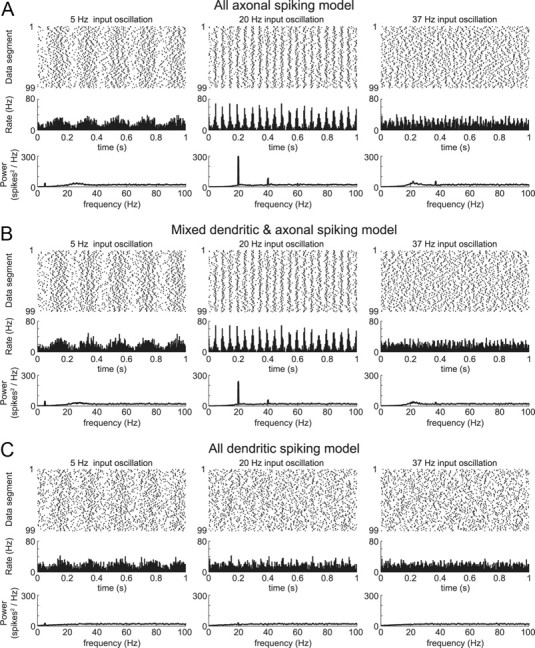
Model neuron sensitivity to input oscillations was rate dependent. With each model neuron spiking at a mean rate of 20 Hz, the excitatory input was made to oscillate at 5, 20, or 37 Hz (oscillation amplitude = 10%). The axonal spiking model (A) and mixed spiking model (B) were much more sensitive to the 20 Hz input oscillation than to the 5 or 37 Hz oscillations. The dendritic spiking model was the least oscillatory in all cases and did not show a clear frequency preference (C). The synaptic input rates for these simulations were the same as for Figure 1A.
Figure 3.

Oscillation sensitivity in the model neurons with lower dendritic gNaF was maximal when the oscillation frequency matched the spike rate of the model neuron. To determine under what conditions the model neurons were most oscillatory, each one was subjected to oscillating excitation (A) or inhibition (B) at five different oscillation frequencies: 5, 13, 20, 28, and 37 Hz. For each of these oscillation frequencies, the model neurons were driven to fire at the same five frequencies by adjusting the amount of counterbalancing random (non-oscillatory) synaptic input while keeping the oscillatory inputs the same. For each simulation, the degree to which the input oscillation was reflected in the output spike train was measured as the percentage of the total power in the output spectrum (from 0.1 to 100 Hz) that was at the oscillation frequency ± 1 Hz. The model neurons with low (A1, B1) and intermediate (A2, B2) dendritic gNaF both showed a tendency to oscillate most strongly when their output firing rate matched the input oscillation frequency, suggesting a resonance effect. This was the case for all five oscillation rates tested, but the effect was larger at higher frequencies. The high dendritic gNaF model (A3, B3) was relatively insensitive to the oscillations regardless of frequency. C, To look for intrinsic resonance in the model neurons, simulations were run in which the synaptic input timing took the form of a uniformly random distribution (white noise). The model neurons were again tuned to multiple output spike rates by varying either the amount of excitation or the amount of inhibition. Power spectra are shown for 5, 20, and 37 Hz to demonstrate that the model neurons with lower dendritic gNaF (C1, C2) had much more of their output power concentrated near the mean firing frequency compared with the high dendritic gNaF model (C3) but only at the higher firing frequencies. Gray lines are from simulations with fixed excitation rates across models, and black lines are from simulations with fixed inhibition rates across models.
Figure 4.
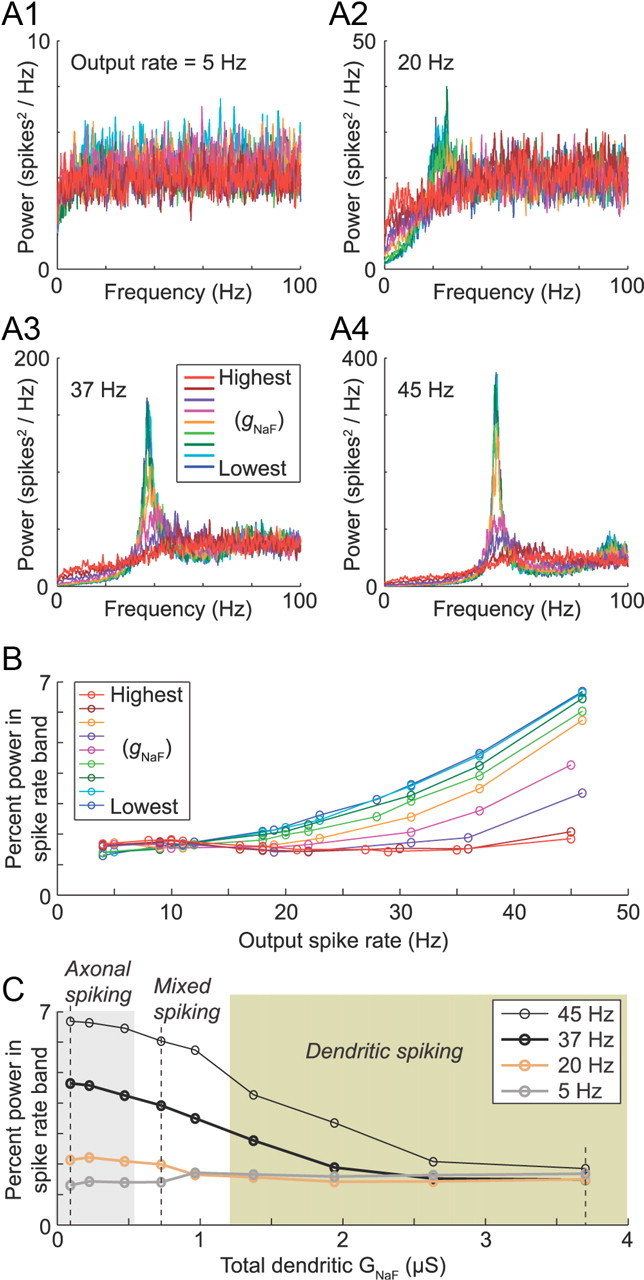
Intrinsic resonance was examined across all of the original nine model neurons using synaptic inputs with uniformly random timing. At the lowest spike rate examined (5 Hz; A1), all of the model neurons had relatively flat power spectra. For higher spike rates, however, decreasing dendritic gNaF was accompanied by a progressive concentration of output power near the mean firing frequency (A2–A4). This is summarized in B, which shows the relationship between the mean spike rate and the percentage of the total output power concentrated near to it (within ±5 Hz) for all model neurons. In C, the percentage power in the firing rate band is plotted against total dendritic gNaF for four different firing rates. The three main example models (axonal spiking, mixed spiking, and dendritic spiking) are marked by dashed vertical lines. Shaded boxes show that model neurons had >90% axonal spike initiation (gray box to left) and that had >90% dendritic spike initiation (beige box to right). From this plot, it can be predicted that, for GP neurons, a reduction in dendritic gNaF will enhance the tendency to oscillate at or near their mean firing rates regardless of whether spike initiation is occurring primarily in the axon, dendrites, or a mixture of both.
Sinusoidal input oscillations
For the sinusoidal input oscillations in Figures 1–4, input timing was random but the input rates of either the AMPA synapses or the GABAA synapses were made to fluctuate above and below their baseline values in a repeating sine wave. For AMPA oscillations, sinusoidal input rates fluctuated by ±10% of their baseline values, such that a synapse with an average rate of 20 events/s would have an average instantaneous rate of 22 Hz at the peak and 18 Hz at the trough of each oscillation cycle. For GABAA oscillations, input rates varied by ±25% of their baseline values. All of the oscillatory inputs were given the same oscillation frequency and phase. For simulations in which the AMPA inputs were oscillatory, the GABAA inputs were given constant input rates (randomly timed but with a constant average rate throughout the simulation) that were adjusted independently for each model neuron to obtain matching output spike rates. For simulations in which the GABAA inputs were oscillatory, the AMPA inputs had constant rates that were adjusted for each model neuron to achieve the target output spike rates.
Parkinsonian synaptic inputs
For GP neurons in parkinsonian animals, the input is much more complex than the sinusoidal rate modulations, and it is possible that dendritic NaF channels would have different effects under more realistic input conditions. One major difference is that the oscillations that are visible in EEG and LFP recordings do not have a consistent cycle duration but instead show cycle expansions and compressions that can be quite substantial. Furthermore, individual STN neurons in animal models of PD typically have bursty firing patterns that are quite different from the randomly timed patterns in our sinusoidal oscillations (Bergman et al., 1994; Mallet et al., 2008a). To test our initial results under more realistic input conditions, the remaining simulations all had the following input properties.
Synaptic conductances.
Three different types of synaptic inputs were simulated, all using α function conductance waveforms. Glutamatergic STN input parameters were estimated from published miniature EPSC recordings (Chen et al., 2006; Hashimoto and Kita, 2008; Chen et al., 2009): rise time = 1 ms, decay time = 4 ms, EAMPA = 0 mV, and gsyn = 0.33 nS. For striatal inhibitory inputs, rise time = 0.8 ms, decay time = 5 ms, EGABA = −80 mV, and gsyn = 0.75 nS (Sims et al., 2008). For inhibitory collateral inputs from other GP neurons, rise time = 0.5 ms, decay time = 5 ms, EGABA = −80 mV, and gsyn = 0.8 nS (Sims et al., 2008).
Synapse distributions.
Synapses were added to the model neurons based on the study by Falls et al. (1983), in which two of the main dendrites from a single rat GP neuron were reconstructed using serial thin sectioning, and the synaptic boutons were classified and counted for each dendrite (Falls et al., 1983). Using the data in Table 1 of that study as a guide and adjusting for the dendritic tree size of our model neuron, a total of 800 STN synapses, 5510 striatal synapses, and 115 GP collateral synapses were incorporated into the model (Table 3). STN synapses were excluded from the soma and proximal dendritic trunk (first two to three compartments of each primary dendrite) and were randomly placed in the remaining dendritic compartments with equal probability per square micrometer of surface area. For most experiments, simulations were run with 10 different random STN synapse distributions, and the results were averaged. For the raster plots shown in Figures 7 and 8, 100 different random STN distributions were used.
Table 3.
Synapse distributions for parkinsonian input patterns
| Location | Surface area (μm2) | STN | Striatal | GP–GP |
|---|---|---|---|---|
| Dendrite 1 trunka | 72 | 0 | 39 | 30 |
| Dendrite 1 remainder | 1848 | 202b | 1350 | 0 |
| Dendrite 2 trunka | 77 | 0 | 40 | 30 |
| Dendrite 2 remainder | 1543 | 164b | 1122 | 0 |
| Dendrite 3 trunka | 120 | 0 | 40 | 30 |
| Dendrite 3 remainder | 4012 | 434b | 2913 | 0 |
| Soma | 564 | 0 | 125 | 25 |
| Dendritic trunk totals | 269 | 0 | 119 | 90 |
| Dendritic remainder totals | 7134 | 800 | 5385 | 0 |
| Combined totals | 7967 | 800 | 115 |
aFor each of the three primary dendrites, the trunk was composed of the first two to three compartments (approximately 17 linear micrometers).
bSTN synapse numbers in the table are the mean values for 100 different random distributions.
Figure 7.

Dendritic sodium channels reduce phase locking to parkinsonian excitatory input patterns. A, Raster plots (top) show model neuron output spike times for simulations where the input correlation was weak (correlation parameter CP = 0.0045) or moderate (CP = 0.022). Binned spike histograms (bottom) are from the CP = 0.022 trials only. The model neuron with the lowest gNaF density (A1) showed much more consistent firing times from trial to trial than that with uniformly high dendritic gNaF (A2), indicative of a greater response to the common component of the input. B, Power ratios for the CP = 0.022 trials (output spike power spectra for CP = 0.022 trials divided by power spectra for CP = 0 trials) for six different dendritic gNaF levels. The beta frequency oscillations in the input were reflected in the output spiking more prominently for model neurons with lower dendritic gNaF. C, Phase histograms for the CP = 0.022 trials show what percentage of the model output spikes occurred at each phase of the input driver signal (20° per bin). D, E, Summary statistics of the spike phase distributions for the six model neurons at different CP values. The circular mean spike phase (D) showed little dependence on CP but demonstrated that model neurons with lower dendritic gNaF tended to fire earlier in the oscillation cycle than those with higher dendritic gNaF. Error bars represent 95% confidence limits. Phase synchronization (E) increased as a function of CP and was highest for the model neurons with lower dendritic gNaF, meaning they were more tightly phase locked to the oscillatory input than model neurons with higher dendritic gNaF. Error bars in E represent 95% confidence intervals generated by a bootstrap procedure (see Materials and Methods). For B–E, data are shown for the following model neurons (from highest to lowest dendritic gNaF): uniform, gradient 250, 150, 75, 25, 10 μm. For the raster plots in A, each line represents a different simulation trial. Each trial had the same common oscillatory driver signal but different random seeds for inhibition, different random locations of STN synapses, and a different randomly selected set of parkinsonian spike trains used to drive the STN inputs. Inhibitory striatal synapses had random timing with average rates that were adjusted to achieve output spiking of 28 Hz when the correlation parameter was 0.
Figure 8.

When the parkinsonian STN inputs were made inhibitory and the randomly timed striatal inputs made excitatory, model neurons with lower dendritic gNaF again showed a greater tendency to phase lock with the shared oscillatory input. A, Raster plots (top) for the model neurons with the lowest (A1) and highest (A2) dendritic gNaF levels during simulations in which the input correlation was weak (CP = 0.0045) or moderate (CP = 0.022). Binned spike histograms (bottom) are from the CP = 0.022 trials only. B, Power ratios for the CP = 0.022 trials from the same six model neurons analyzed in Figure 7. C, Spike phase histograms for the CP = 0.022 trials (20° per bin) show an approximately antiphasic relationship between output spiking and the inhibitory input oscillations. D, Plots of the circular mean for each spike phase distribution show that, despite the switch from in-phase to anti-phase, model neurons with lower dendritic gNaF still tended to fire earlier in the oscillation cycle than those with higher dendritic gNaF. E, Phase locking to the input was again higher in model neurons with lower dendritic gNaF than model neurons with higher dendritic gNaF. For these simulations, the synapses that were STN AMPA synapses in the preceding section retained the same locations and timing but became GABAA synapses, and the striatal GABAA synapses became AMPA synapses but had their average rates adjusted to achieve model output of 28 Hz at CP = 0.
Parkinsonian input patterns.
STN spike trains recorded from hemi-parkinsonian rats under urethane anesthesia were kindly provided by Drs. N. Mallet and P. J. Magill (Medical Research Council Anatomical Neuropharmacology Unit, Oxford University, Oxford, UK). The spike trains were all taken from periods when the EEG signal indicated a brain state of spontaneous “activation” (Mallet et al., 2008a,b). From the 13 original STN spike trains, we constructed 2080 simulated trains (160 per template spike train) that reproduce the overall statistical properties of their original template but have independent event timing (see Fig. 5). To generate the simulated spike trains, we used a novel approach based on the weighted context tree algorithm (Willems et al., 1995). Our approach was implemented by a C++ program (by J.R.E.) with a Matlab interface. The detailed step-by-step procedure for generating the spike trains is described in the next section. The generation of the weighted context tree involved one modification from the original method of Willems et al.: rather than having the context (i.e., spiking history) for any given time in a spike train be simply the D time bins preceding that point (where D is the tree depth parameter), the spiking history was represented by a hybrid context in which individual context symbols could represent more than one time bin. An example of this process is shown in Figure 5B, and the hybrid binning parameters we used are listed in Table 4.
Figure 5.

Parkinsonian STN spike trains. A, Raster plot showing a short segment of the spike trains of 13 different STN neurons recorded from urethane-anesthetized hemi-parkinsonian rats during a brain state of spontaneous activation (provided by Drs. N. Mallet and P. J. Magill). The bottom two neurons were recorded simultaneously from the same electrode, whereas all others were recorded from different animals. Each spike train served as a template for the generation of new artificial spike trains using our context tree approach (see Materials and Methods). Different colors were used simply to facilitate visualization of the individual spike trains and do not have meaning. B, Schematic of the context tree process for estimating the probability that a spike will occur in the next time bin (green box) based on the preceding spiking history. First, the spike train (blue raster at top) is converted into a binned binary representation (2 ms bin widths, bins shown as alternating black and gray boxes). The recent spiking history for any given time bin is described by a hybrid context. In the example shown, the hybrid context had high temporal resolution for recent spiking history (the first 10 context symbols were the 10 most recent bins) and lower temporal resolution for more distant spiking history (5 bins per context symbol for the last 7 symbols). The hybrid binning rule for this example would thus be [10 × 1 bin, 7 × 5 bins]. Because the context was binary, multiple spikes within a single hybrid bin (e.g., red asterisk) were represented the same as a single spike. The context is read backward starting from the most recent symbol. See Table 4 for the hybrid binning rules used in this study. C–F, To illustrate the performance of the method, each of the top four recorded spike trains in A is compared with the artificial spike trains generated from it. For each of the four examples, the similarity between the original data (same color as in A) and 10 artificially generated spike trains based on that template data (blue) is illustrated using raster plots (C), interspike interval histograms (D), autocorrelation histograms (E), and power spectra (F). Our method was able to generate artificial spike trains that preserved the statistics of the template data for a wide range of spike rates and patterns.
Table 4.
Parameters for the context-tree weighting spike train algorithm
| Set | Bin width (ms) | Context strategy (30 symbols per context) (symbols × bins per symbol, from most recent to farthest back in time) | Total # bins in context | Context duration (ms) |
|---|---|---|---|---|
| 1 | 2 | 4 × 1 bin, 4 × 2 bins, 4 × 3 bins, 4 × 4 bins, 14 × 5 bins | 110 | 220 |
| 2 | 2 | 5 × 1 bin, 5 × 2 bins, 20 × 5 bins | 115 | 230 |
| 3 | 3 | 8 × 1 bin, 5 × 2 bins, 17 × 5 bins | 103 | 309 |
| 4 | 3 | 10 × 1 bin, 20 × 5 bins | 110 | 330 |
At any point in a spike train, the spiking history immediately preceding that time point forms the context. Each context contained 30 binary symbols. The value of the symbol was 0 if there were no spikes in any of the bins represented by the symbol, and 1 if there was a spike in any of the bins.
The method generates new spike trains that individually have the same beta frequency power as their original templates but, as a population, have no phase relationship to one another and so would not produce an oscillatory LFP. To generate simulated spike trains with a common underlying oscillation, we used a “driver” signal that represented the population oscillation. The driver signal was generated by first replacing each spike in one original STN spike train with a Gaussian waveform (amplitude = 1, width at half-amplitude = 20 ms, linear summation between overlapping Gaussian waveforms) and then normalizing the driver to have mean = 1 and variance of CP, where CP was a user-determined correlation parameter controlling the strength of the population oscillation. As shown in Figure 6, this method allowed us to generate groups of simulated spike trains with realistic statistics that displayed differing levels of population synchrony.
Figure 6.
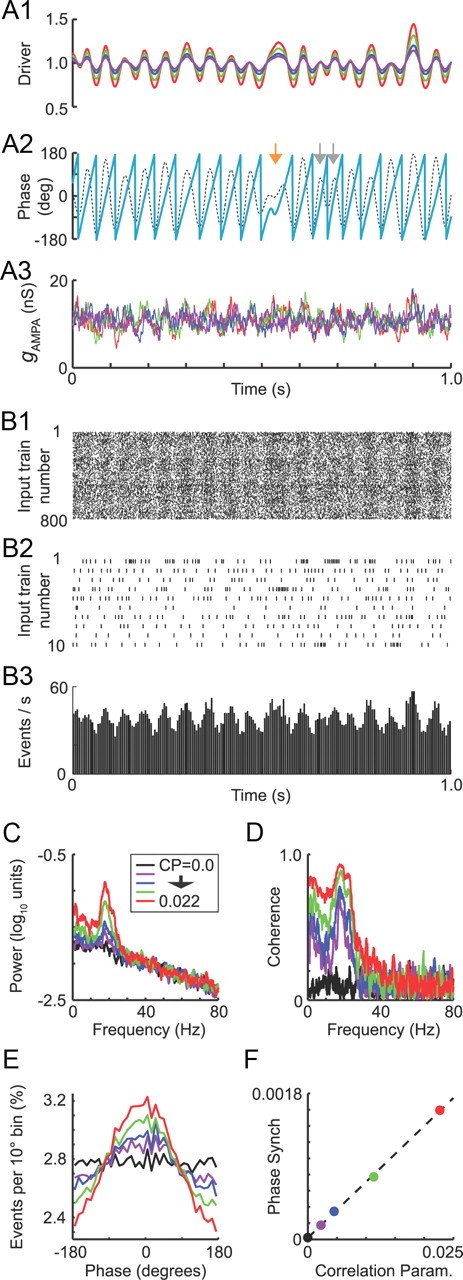
Generation of correlated parkinsonian input trains using the oscillatory driver signal. A, One second of example data showing the different-sized driver signals (A1) used to generate oscillatory inputs, the phase (A2, cyan trace) of the driver signal obtained from a Hilbert transform of a 15–30 Hz bandpass-filtered version (dashed black line) and the summed conductance of all 800 AMPA synapses (A3) for one simulation with each driver signal. Each driver signal had a mean of 1 and variance equal to the correlation parameter CP. The variability of the oscillation cycle durations is illustrated in A2 by the presence of an elongated cycle (orange arrow) followed by two compressed cycles (gray arrows) in the phase trace. B, Raster plots (B1, B2) and a binned spike histogram (B3) for the artificial spike trains with the highest correlation level used (CP = 0.022, red trace in other panels). B1 shows all 800 inputs, and B2 shows only the first 10 rows of B1 so that the spiking patterns can be observed in greater detail. The histogram in B3 has bin widths of 5 ms. Data in B are from the same time segment as in A. C, Power spectra for longer versions (100 s each) of the AMPA conductance traces shown in A3. D, Coherence spectra between the AMPA conductance traces and the driver signal. E, Overlaid phase histograms showing where the AMPA input events occurred with respect to the driver phase for each driver signal amplitude (histograms were constructed with 10° bins and normalized so that the y-axis displays the percentage of all AMPA events per phase bin). F, Phase synchronization of AMPA input events (all 800 synapses combined) measured as a function of the correlation parameter value. Dashed black line is a linear fit with slope = 0.069 and y-intercept 1.9e-5.
Step-by-step procedure for generating artificial spike trains.
For each template spike train, simulated spike trains were generated through the following steps. (1) The template spike train was binned at high time resolution (1–3 ms per bin), with 0 meaning that no spike occurred in the time bin and 1 meaning that a spike did occur.
(2) A weighted context tree was generated from the binned template according to two user-defined parameters: the tree depth D and the hybrid context rule that converted the binned spike train into a hybrid spiking history context (see Fig. 5B and Table 4). The context tree stored all unique spiking patterns up to length D that were present in the template spike train. For each unique spiking pattern, the program would find all instances of that pattern in the template spike train, count how often the pattern was found and how often it was followed immediately (in the first time bin after the pattern) by a spike, and store these values in the node of the context tree that represented the pattern. The estimate of the spiking probability for the next time bin following any unique spiking pattern x would thus be simply the fraction of times that pattern x immediately preceded a spike in the template data:
 |
(3) A seed sequence was randomly selected from the template data and used as the starting point for the generation of a new spike train. The seed sequence itself was not included in the new train but provided the initial probability estimates.
(4) The new binned spike train was generated one bin at a time, with the recent spiking history (initially the seed sequence) being used to determine the probability that a spike would occur in the present time bin. Because the newly generated artificial spike trains contained some spiking patterns that were not present anywhere in the template spike train or that were present too few times in the template to provide a reasonable probability estimate, sampling constraints were introduced. First, the minimum number of times that a pattern had to be observed in the template spike train to be included was three. If a full-length context was observed fewer than three times in the template, the tail end of the context (the most distant part of the spiking history) would be progressively truncated until a context substring that satisfied the sampling constraint was reached. The final value that was used for the context-dependent spiking probability was the average over all substrings of the context that had at least three observations and were at least 10 symbols in length (up to the maximum of D = 30), or if none of the context substrings met these requirements, then the longest context that had at least three observations was used. The actual spike probability for any given time bin i immediately following context x was the product of two things: (1) the spike probability given context x, and (2) the value of the driver vector at time bin x:
 |
A random number was drawn from a uniform distribution spanning [0,1], and if the random number was less than or equal to Pspike(x), the new bin contained a 1; otherwise the new bin contained a 0. The recent history was then updated to reflect this outcome, and the value of the next bin was selected using the same procedure.
(5) The synthetic spike trains were then converted from binned representations to actual spike times by randomly jittering spikes within their bins except when the spike occurred shortly after a preceding spike (within 10 ms). In these cases, the spike time within the bin was chosen randomly from the autocorrelation distribution of the template spike train at the appropriate lag time to preserve the refractory period of the spike train.
Synaptic release probability.
Although our synthetic spike trains should be an accurate representation of STN activity in parkinsonian rats, translating these spike trains into presynaptic input patterns requires that the synaptic vesicle release probability (Pr) be considered. Short-term plasticity at the rat STN–GP synapse has been quantitatively characterized (Hanson and Jaeger, 2002), so we used the plasticity parameters from that study to convert our synthetic STN spike trains into actual synaptic input trains for the GP neuron model. This required an estimate of the initial synaptic Pr (Pr for a synapse that has been inactive long enough to have no residual plasticity in effect), which has not been determined for STN-to-GP synapses to our knowledge. For rat Schaeffer collateral to CA1 synapses, the initial Pr is typically in the range of 0.05–0.4, although highly variable (Hessler et al., 1993; Rosenmund et al., 1993; Dobrunz and Stevens, 1997), so we used a value of 0.2. We also assumed that, when an STN neuron was firing at its average firing rate, short-term potentiation and depression would approximately balance out to produce a steady-state average Pr of 0.2. For each of the 13 STN spike train templates, we started with the plasticity parameters from Hanson and Jaeger that would produce a steady-state release probability closest to 0.2 for that spike train and adjusted the plasticity rates as needed to achieve a 0.2 average steady-state Pr. Each event in each synthetic spike train was then assigned a Pr based on the spiking history preceding it, and the spike event was either kept as a successful release or rejected as a release failure at random but with the appropriate history-dependent probability. The parameter values used for each template spike train are listed in Table 5. Because the accuracy of our initial and steady-state Pr values cannot be confirmed, we also ran simulations using the artificial spike trains without any Pr adjustment (i.e., Pr = 1.0 for all spikes). The main conclusions of the study—that dendritic NaF channel expression promotes decorrelation and insensitivity to global input oscillations—were not affected by this change in basal release probability.
Table 5.
Parameters for short-term plasticity function
| Template spike train | IncF | TauF | F bound | IncD | TauD |
|---|---|---|---|---|---|
| 1 | 1.54 | 0.15 | 5 | 0.85 | 0.7 |
| 2 | 1.34 | 0.235 | 5 | 0.85 | 0.7 |
| 3 | 1.4 | 0.241 | 5 | 0.9 | 0.491 |
| 4 | 1.34 | 0.37 | 5 | 0.86 | 0.7 |
| 5 | 1.4 | 0.24 | 5 | 0.86 | 0.505 |
| 6 | 1.34 | 0.36 | 5 | 0.87 | 0.7 |
| 7 | 1.4 | 0.24 | 5 | 0.85 | 0.5 |
| 8 | 1.6 | 0.2 | 5 | 0.82 | 0.728 |
| 9 | 1.34 | 0.325 | 5 | 0.87 | 0.71 |
| 10 | 1.34 | 0.3 | 5 | 0.85 | 0.7 |
| 11 | 1.4 | 0.245 | 5 | 0.87 | 0.505 |
| 12 | 1.4 | 0.245 | 5 | 0.89 | 0.49 |
| 13 | 1.4 | 0.25 | 5 | 0.89 | 0.66 |
Parameters for the short-term plasticity model of Hanson and Jaeger (2002).
Data analysis
Simulation data were analyzed using Matlab. Power spectra were computed using multitaper spectral estimation, which uses a series of orthogonal data tapers to make the spectral estimate more accurate and allows for the computation of confidence intervals from a single trial (Thomson, 1982; Bokil et al., 2006). This was implemented through the freely available Chronux package, version 2.00 (Mitra and Bokil, 2008; Bokil et al., 2010) (http://www.chronux.org). Spike trains were converted into binary representations with bin widths of 1 ms, and their power spectra were estimated with the Chronux mtspectrumpb.m and mtspectrumsegpb.m functions. Coherence between binned event trains and the oscillatory driver signal was computed using the Chronux coherencycpb.m and coherencysegcpb.m functions.
Phase locking of the model neurons to the oscillatory parkinsonian inputs was assessed using spike phase distribution analysis. To construct spike phase distributions, the instantaneous phase at each point in the driver signal was obtained by bandpass filtering the signal from 15 to 30 Hz and then taking a Hilbert transform of the filtered signal (example shown in Fig. 6A). The time at which each output spike occurred could then be converted into a phase of the underlying oscillation, although the oscillation cycle duration was not constant. A concentration of spikes at specific phases indicates phase locking, whereas a flat phase distribution indicates a lack thereof. To compare phase locking across models and conditions, we used phase synchronization (Tass et al., 1998), a measure that uses Shannon entropy to quantify how non-uniform a phase distribution is (because the null hypothesis that the measured variable—spike times in this case—is not phase dependent would predict a uniform distribution of spike times with respect to the driver signal phase). This measure is bounded between 0 and 1, with 0 meaning that spikes occurred with equal probability at all phases, and 1 meaning that all spikes occurred at the same driver signal phase. Phase synchronization was computed from spike phase histograms with 10° bins. Because phase synchronization measures the non-uniformity of a histogram, it is sensitive to the number of observations in the sample: for the same uniform phase distribution, a smaller sample size will have a more “noisy” histogram than a larger one as a result of averaging effects, and for this reason phase synchronization tends to decrease as the sample size increases. In the case of the present study, this caused an artificial decrease in phase synchronization for simulations with higher spike rates. In cases in which we compared phase locking across different firing rates, we used the phase synchronization ratio, defined as the observed phase synchronization divided by the expected (random chance) phase synchronization for the trial. The expected phase synchronization assumed no relationship between the spike times and the underlying oscillation and was estimated by randomly shuffling the original spike train 100 times, computing the phase synchronization for each shuffled version, and averaging the 100 values. To generate 95% confidence intervals for phase synchronization, we used a bootstrap procedure. From the distribution of spike phases for each simulation, 100 sample populations were drawn randomly with replacement. Confidence intervals were then estimated from the 100 sample populations using the bias corrected and accelerated percentile method (Efron, 1987) (Matlab bootci.m function). To compute the circular mean of the phase distributions (which takes into account the fact that 10° and 350° should average to 0°, not 170°), we used CircStat, a freely available toolbox for Matlab (Berens, 2009).
Results
High dendritic NaF channel expression reduced sensitivity to sinusoidal input oscillations
We showed previously that model GP neurons with a high dendritic gNaF level that supports dendritic spike initiation are more sensitive to synchronous excitation than are similar model neurons with low dendritic gNaF and axonal spike initiation (Edgerton et al., 2010). As a result, we expected that the models with high dendritic gNaF would be more likely to transmit synchronous input oscillations through to their targets, and we hypothesized that abnormally high dendritic gNaF expression could be a factor in the abnormal pallidal synchronization that is observed in animal models of Parkinson's disease.
To test this hypothesis, we first ran simulations in which either the excitatory or inhibitory background synapses all fired in a weakly oscillatory pattern with a constant frequency and phase (sine-wave oscillation; see Materials and Methods). We focused on three of the model neurons for these simulations: the model with uniform dendritic gNaF expression, in which virtually all action potentials recorded at the soma originate in the dendrites (“dendritic spiking model”); the L75 model (declining gNaF with distance from the soma, length constant = 75 μm), in which approximately half of the action potentials initiate in the dendrites and the other half in the axon initial segment (“mixed spiking model”); and the L10 model, in which all action potentials initiate in the axon initial segment (“axonal spiking model”). We initially tested an oscillatory rate modulation at a frequency of 20 Hz because the abnormal oscillations observed in the STN of rats rendered parkinsonian with 6-OHDA are around this frequency in the beta band (Mallet et al., 2008a,b). The oscillating component of the input (Fig. 1, excitation in A,B, inhibition in C,D) was identical for each model, whereas the non-oscillatory input was varied to make each model fire at 20 Hz on average. Contrary to our expectations, the axonal spiking and mixed spiking model neurons transmitted the oscillations much more faithfully than the dendritic spiking model regardless of whether the oscillation was carried by the excitatory or the inhibitory inputs (Fig. 1). It is noteworthy that, in the case of oscillating inhibition, the spiking dendrite model needed less than half as much excitatory input as the other two models to achieve a 20 Hz spike rate (see Fig. 1 legend). This meant that the total combined synaptic input was substantially more oscillatory for the spiking dendrite model than for the other two in this case, yet the output of the spiking dendrite model was the least oscillatory of the three. In comparing the mixed spiking model to the axonal spiking model, the difference was modest but the axonal spiking model had more power in the 20 Hz band for both input conditions than the mixed spiking model (Fig. 1B,D).
In the previous experiment, the oscillation frequency of the input and the mean firing rate of the target neuron were the same (20 Hz). It is possible that resonance between the intrinsic spiking mechanism and the synaptic input could contribute to the oscillatory response of the model neuron and that differences in resonance could explain the different oscillatory responses of the three models. To examine how the frequency of the input oscillation affected the degree to which the model neurons responded to it, we tested inputs with sinusoidal oscillations at frequencies of 5, 20, and 37 Hz, again with the model neurons all firing at 20 Hz. The results showed a strong frequency dependence for both the axonal spiking and mixed spiking model neurons: they were much more sensitive to the 20 Hz input oscillation than to those at 5 and 37 Hz (Fig. 2A,B). The dendritic spiking model neuron was relatively insensitive to all of the oscillation frequencies (Fig. 2C). These results support the hypothesis that resonance between the intrinsic spiking mechanism and the oscillating input contributes to the responses of the axonal spiking and mixed spiking models and indicate that spiking dendrites disrupted this interaction when the model neuron was firing at 20 Hz. However, because the intrinsic spiking mechanism can operate stably at a wide range of frequencies, it is possible that the spiking dendrite model may show enhanced resonance at a different firing rate. To determine how well each model neuron would transmit input oscillations as a function of both spike rate and input oscillation frequency, we analyzed the response of each model neuron to all combinations of five different values for the oscillatory input and output spiking rates: 5, 13, 20, 28, and 37 Hz. The results showed that the axonal and mixed spiking model neurons were always most sensitive to input oscillations when the model spike rate matched the oscillation frequency, whether the oscillatory input was excitatory (Fig. 3A) or inhibitory (Fig. 3B). At low spike rates, the effect was small and the tendency to oscillate was weak; as the spike rate increased, the oscillatory tendency became much stronger in both of these models. In contrast, the dendritic spiking model was insensitive to the oscillatory input under all of the conditions tested and showed little or no frequency dependence.
We observed previously that the variability of spike timing during random synaptic bombardment was consistently higher in the model neurons with higher levels of dendritic gNaF (Edgerton et al., 2010). This suggested that the added dendritic NaF channels were enabling synaptic inputs to more completely dominate the intrinsic axo-somatic pacemaking mechanism, a hypothesis that is compatible with the results described above using oscillatory inputs. To look in more detail at resonance in the model neurons, we used random, non-oscillatory synaptic input trains to drive the model neurons to spike at different firing rates and plotted the power spectra for each model at each rate (Fig. 3C). The results were completely consistent with what we observed in the presence of input oscillations: although the input times were random and non-oscillatory in these simulations, the axonal spiking and mixed spiking model neurons showed clear peaks in their output power spectra centered around the mean spike rate, and the peaks grew larger as the firing rate got faster; at the same time, there were no peaks in the power spectra for the dendritic spiking model under any input conditions tested.
The preceding results showed very clear differences between the dendritic spiking model and the other two but only modest differences between the axonal and mixed spiking model neurons. To gain a better sense of how the transition from strongly oscillatory (axonal and mixed spiking models) to relatively non-oscillatory output (dendritic spiking model) occurred as a function of the dendritic gNaF expression level, we repeated the random-input simulations shown in Figure 3C for all nine model neurons with varying dendritic NaF gradients. Power spectral analysis of the output spike trains from these simulations (Fig. 4) showed that, at low spike rates (13 Hz and below), there was little difference between the models. At 20 Hz, the models with axonal or mixed spiking clearly showed peaks in their power spectra near the mean firing rate, whereas the purely dendritic spiking models continued to have flat spectra. At spike rates above the 25–35 Hz average observed in rat GP neurons (Urbain et al., 2000; Mallet et al., 2008b), there was a smooth progression across the nine model neurons: as the dendritic gNaF level increased, the tendency of the model neuron to oscillate at its mean firing frequency diminished (Fig. 4C).
The weighted context tree method produced artificial parkinsonian spike trains with appropriate properties and adjustable oscillation strengths
Although the dendritic NaF channel expression level had a large effect on the tendency of model neurons to transfer sinusoidal input oscillations to their targets, it is not clear that responses to parkinsonian oscillations, which have variable cycle times and thus a mixture of frequency components, would be affected similarly. Furthermore, although rat GP neurons do have mean firing rates in the beta frequency range, GPe neurons in nonhuman primates have faster mean firing rates in both normal animals (50–70 Hz: DeLong, 1971; Heimer et al., 2002; Soares et al., 2004; Elias et al., 2007) and in animals with MPTP-induced Parkinsonism (45 Hz: Heimer et al., 2002; Soares et al., 2004). Finally, in parkinsonian animals, the STN firing pattern shows a higher degree of bursting and synchrony than normal, and our previous study showed that bursts of excitation to single dendritic branches are particularly effective at activating the model neurons with robust dendritic spiking (Edgerton et al., 2010). For these reasons, the absence of bursting in our sinusoidal inputs may have underestimated the response of the spiking dendrite model to parkinsonian oscillations.
To more accurately simulate parkinsonian input patterns, we developed a method to generate artificial spike trains based on neurophysiological recordings from parkinsonian rats (see Materials and Methods). This strategy used the weighted context tree method (Willems et al., 1995) to estimate the probability that a spike would occur in the next time bin (usually 1–3 ms) of a spike train given the recent history of that spike train. Using this approach, we were able to take 13 spike trains recorded from STN neurons in hemi-parkinsonian rats (Fig. 5A) (spike trains kindly provided by Drs. N. Mallet and P. J. Magill) (Mallet et al., 2008a,b) and generate an arbitrarily large population of artificial spike trains that each reproduced the firing pattern (Fig. 5B), interspike interval distribution (Fig. 5C), autocorrelation distribution (Fig. 5D), and power spectrum (Fig. 5E) of whichever original spike train was used as the template.
Although the method did an excellent job of reproducing the statistics of the template spike trains, the artificial spike trains did not have any underlying correlation with one another that would simulate the type of synchronized oscillatory activity that is a hallmark of PD. To introduce an underlying population oscillation that was shared by the artificial spike trains, we used a driver signal to represent the population oscillation. The driver signal was a smoothed STN spike train (see Materials and Methods) from a hemi-parkinsonian rat that was strongly correlated with the network beta oscillations present in the cortical EEG from the same animal. The strength of the population oscillation was proportional to the amount of fluctuation (variance) in the driver signal, so the driver signal variance served as the parameter that could be adjusted by the experimenter (correlation parameter CP = driver signal variance).
To test different underlying oscillation strengths, we used a set of driver signals that differed in their variance but had the same phase and waveform (Fig. 6A1). Even at the highest value of the correlation parameter (CP = 0.022) (Fig. 6, red traces), the total summed AMPA conductance generated by one example set of 800 artificial spike trains was only moderately oscillatory (Fig. 6A3). Raster plots and binned spike histograms for the CP = 0.022 example spike trains are shown in Figure 6B. Analysis of the summed AMPA conductance traces from Figure 6A3 revealed that, as the correlation parameter value increased, the beta frequency peak in the AMPA conductance power spectrum grew larger (Fig. 6C), the coherence between the driver signal and the synaptic conductance increased, particularly in the beta frequency band (Fig. 6D), spikes in the artificial trains became more and more concentrated near the driver signal phase of 0° rather than being unrelated to the driver signal phase (Fig. 6E), and phase synchronization (Tass et al., 1998) between the driver signal and the spikes in the artificial spike trains increased linearly with the correlation parameter, at least over the range of values tested (Fig. 6F).
Dendritic NaF channels reduced phase locking to parkinsonian input patterns
We tested six of the model GP neurons with the parkinsonian input trains that we created. The excitatory STN synaptic inputs came from the parkinsonian artificial spike trains and were identical across models, whereas the inhibitory striatal inputs were randomly timed and had rates that were adjusted to make the models fire at specific mean frequencies. For each model and at each CP value, 100 simulations were run using different random locations of STN synapses, different random combinations of artificial parkinsonian spike trains, and different random seeds for the timing of the inhibitory synapses (Fig. 7). The model neurons were firing at ∼28–30 Hz, similar to the mean firing rate for GP neurons in awake rats (Ruskin et al., 1999; Urbain et al., 2000, 2002). Consistent with the results of the sinusoidal input simulations, the model neurons with lower levels of dendritic gNaF expression were clearly more sensitive to the underlying oscillation than model neurons with high dendritic gNaF expression. This is visibly apparent in the raster plots and binned spike histograms shown for the models with the lowest and highest dendritic gNaF levels (Fig. 7A). Quantitative analysis revealed three different effects of dendritic gNaF in these simulations: (1) the beta oscillation present in the excitatory input was much less apparent in the output spike train when dendritic gNaF was high (Fig. 7B); (2) output spikes occurred at a later phase of the beta cycle, on average, with higher dendritic gNaF (Fig. 7C,D); and (3) phase locking between output spikes and the driver signal beta oscillation was weaker for higher levels of dendritic gNaF expression (Fig. 7E).
These findings suggested that dendritic expression of NaF channels could serve as a cellular mechanism of active decorrelation for a population of neurons with shared input, because the common component of the input was not as consistently reflected in the output when dendritic gNaF was high. The results also indicated that the dendritic NaF channel expression level could have a major impact on the extent to which a population of target neurons would phase lock to an oscillatory input. To determine whether these results would generalize to a broader range of conditions, we asked two additional questions: would the effects of dendritic gNaF be different if the oscillatory inputs were inhibitory rather than excitatory, and would the firing rate of the model neuron have the same effect with parkinsonian oscillations that it did with sinusoidal oscillations.
Although the artificial parkinsonian spike trains were derived from STN neurons in hemi-parkinsonian rats, the question of whether dendritic NaF channel expression would have the same effects on inhibitory oscillations is clearly relevant not just for GP neurons, which will receive oscillatory inhibition in PD attributable to the presence of GP–GP collateral synapses (Falls et al., 1983; Kita and Kitai, 1994; Sato et al., 2000; Sadek et al., 2007), but also for the STN neurons that receive oscillatory inhibition from GP and the target neurons in the thalamus and brainstem that receive oscillatory inhibition from the basal ganglia output nuclei in PD. To address this question, we repeated the simulations of Figure 7 but made all of the AMPA synapses into GABA synapses and all of the striatal GABA synapses into AMPA synapses. The results with oscillatory inhibition were very similar to oscillatory excitation: when dendritic gNaF was low, spike timing more consistently reflected the driver signal across trials (Fig. 8A), the power spectra showed a greater proportional increase in output beta oscillations (Fig. 8B), spikes tended to occur at earlier phases of the beta cycle (Fig. 8C,D), and output spiking was more tightly phase locked to the population oscillation (Fig. 8E). The main difference when the oscillatory input was inhibitory was that the phase relationship between output spiking and the driver signal was reversed (Fig. 8C,D). It is noteworthy that, in these simulations, the proportion of the total synaptic input (AMPA + GABAA) that was oscillatory was greatest in the model neurons with high dendritic gNaF, because they required less excitation to achieve the target spike rate of 28–30 Hz. This demonstrates that the results of Figure 7 were not simply attributable to the fact that the low-gNaF model neurons received a synaptic input combination that was proportionally more oscillatory and shows that dendritic NaF channel expression can serve as a general cellular mechanism to reduce the tendency of a brain structure to transmit oscillatory inputs to its downstream targets.
To assess the rate dependence of our results, we adjusted the randomly timed synaptic input rates (striatal rates in which STN inputs were oscillatory, STN rates in which striatal inputs were oscillatory) to achieve output spike rates of 5, 13, 20, 28, 37, and 55 Hz for each model neuron. The rate 55 Hz was the highest frequency the model neurons with steeply declining gNaF gradients (L = 50 μm or less) could achieve before entering a state of depolarization block, in which cumulative sodium channel inactivation prevented spiking. This is consistent with our slice recordings showing that many rat GP neurons enter depolarization block at sustained frequencies >50 Hz (Edgerton et al., 2010). Although they were able to fire at 55 Hz, the spikes were abnormally short and wide, suggesting that the model neurons were at the very edge of their functional range. The spike rate tuning was done with the CP = 0 (uncorrelated) artificial spike trains; spike rates were allowed to fluctuate from these targets with the correlated spike trains. The effects of the dendritic gNaF level were similar whether the artificial parkinsonian spike trains were connected to excitatory or inhibitory synapses (Fig. 9). The phase synchronization ratio (a normalized version of phase synchronization that corrects for a spike rate bias in the measure; see Materials and Methods) peaked near the frequency of the underlying oscillation for most of the model neurons and then declined as the spike rate became higher. This is not surprising because, when the spike rate is less than or equal to the oscillation rate, spikes can occur exclusively at the peak of each oscillation cycle, but at higher spike rates, spikes must occur over a wider range of phases because there is more than one spike per oscillation cycle. Low dendritic gNaF expression was associated with higher phase synchronization (Fig. 9A,B) for all spike rates except when the low gNaF models were pushed to the brink of depolarization block. The average phase at which spikes occurred was consistently earlier in the beta cycle for models with low dendritic gNaF, although the difference between the models increased as the spike rate increased (Fig. 9C,D). The proportional increase in beta power due to the input oscillation was greatest in the model neurons with low dendritic gNaF at all spike rates, but this difference was greatest at higher spike rates (Fig. 9E,F). In summary, although the spike rate did influence the magnitudes of the different measures, the effects of the dendritic NaF channel density on phase locking and oscillation transfer were consistent across rates and for both excitatory and inhibitory synapses. This somewhat counterintuitive result can be understood when considering that the total net synaptic current is a balanced mix of excitatory and inhibitory ongoing activity and that the presence of modulation in either signal has a similar net effect on modulating total synaptic current. An alternative way that inhibition could act similarly to excitation would be by triggering rebound spike initiation, but we confirmed that inhibition was acting to suppress spike initiation in our model neurons because adding a group of inhibitory synapses to any region of the model always resulted in reduced firing overall and reduced spike initiation at the site of the added inhibitory inputs (data not shown).
Figure 9.
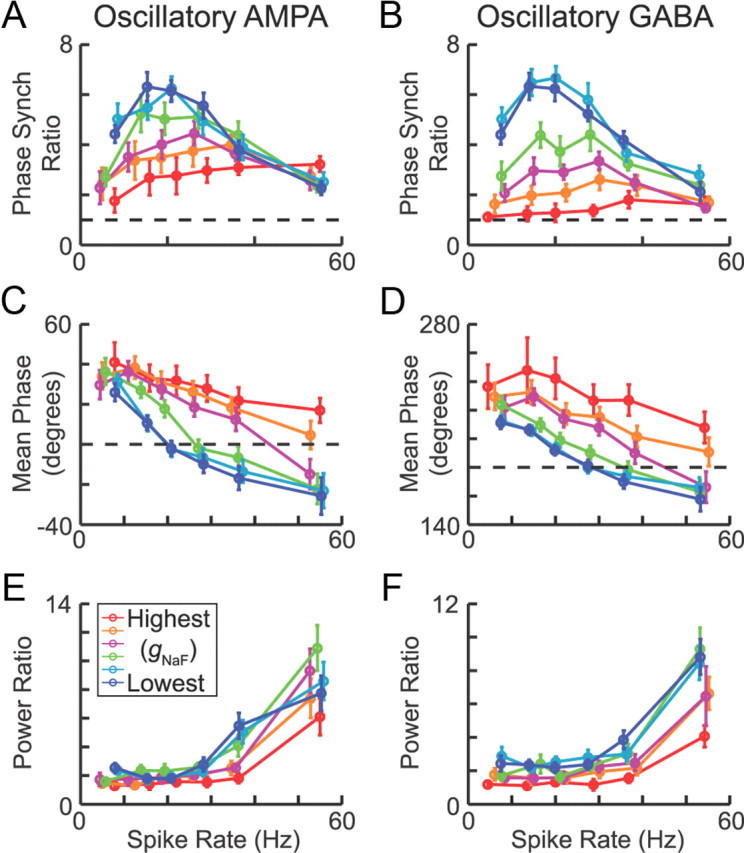
Effects of spike rate on phase locking and oscillations in the GP models. Similar results were observed whether the parkinsonian inputs were excitatory AMPA synapses (left column) or inhibitory GABAA synapses (right column). A, B, Phase locking decreased at higher spike rates as the additional spikes were distributed more broadly across each beta cycle, but synchronization was significantly higher in the models with low dendritic gNaF in all cases except when the model neurons were driven to fire at 55 Hz with parkinsonian AMPA inputs. The rate 55 Hz was the upper limit that could be achieved before the models with low dendritic gNaF were in a state of complete depolarization block. The data are plotted as the observed phase synchronization for the spike trains divided by the phase synchronization expected by random chance to correct for the firing rate bias in this measure (see Materials and Methods). Black dashed lines show the chance level. C, D, The circular mean phase at which spikes occurred during the beta cycle was always earlier in the models with lower dendritic gNaF, but the difference grew as the spike rate increased. The dashed black line is at 0° in C and 180° in D. E, F, Finally, the model neurons with low dendritic gNaF showed larger proportional increases in power at the predominant frequency of the driver signal (16–19 Hz) than model neurons with higher gNaF, and this effect was greatest at higher spike rates. In all panels, the error bars represent 95% confidence intervals.
Similar decorrelating effects of dendritic NaF channels at different HCN and SK channel expression densities
Previous electrophysiological and modeling studies have focused on the potential contributions of HCN (Chan et al., 2004) and SK (Deister et al., 2009) channels to spike timing variability and neuronal synchronization in the rodent GP. Furthermore, it was recently demonstrated that dopamine depletion can cause a downregulation of HCN channel expression in rodent GP neurons, with a concomitant loss of spontaneous pacemaking when synaptic excitation was absent (Chan et al., 2011). To investigate the relationship between HCN, SK, and dendritic NaF channel effects on phase locking in our GP neuron models, we systematically varied the HCN and SK channel densities in the axonal spiking and dendritic spiking model neurons. The original model neurons showed only small changes in their spontaneous firing rates when the HCN channels were removed, consistent with previous research using HCN channel antagonists (Chan et al., 2004). Because a more recent study (Chan et al., 2011) suggested a greater role for HCN channels in driving spontaneous pacemaking, we reduced the persistent sodium channel density by ∼20% and increased the baseline activity of the HCN channels in these simulations by right-shifting their activation curves (see Materials and Methods).
With these modifications, HCN channels were essential for spontaneous pacemaking activity in the absence of any stimulation (Fig. 10A–C), whereas the SK channel density only moderately affected spontaneous firing but substantially influenced the firing frequency during depolarizing current injection (Fig. 10A–C), consistent with experimental data (Deister et al., 2009). The model neurons were then stimulated with the same parkinsonian excitation patterns used in Figures 7 and 9, with inhibition adjusted to achieve average firing rates of 28 Hz. For each dendritic gNaF level, we tested three SK densities (none, baseline, or 2.5 times baseline) and three HCN densities (none, baseline, and 10 times baseline) in all nine combinations (see Materials and Methods). We used three measures for these comparisons: (1) the relative increase in oscillatory output at 16–19 Hz, which is a measure of how strongly the model neuron transmitted the parkinsonian oscillation; (2) phase synchronization of spikes with the oscillatory driver signal, which indicates how closely the model neuron spike times were locked to the shared component of the input; and (3) the relative power within ±5 Hz of the mean spike frequency, which gives insight into how strongly the intrinsic pacemaker mechanisms in the model neurons contributed to output spike timing.
Figure 10.
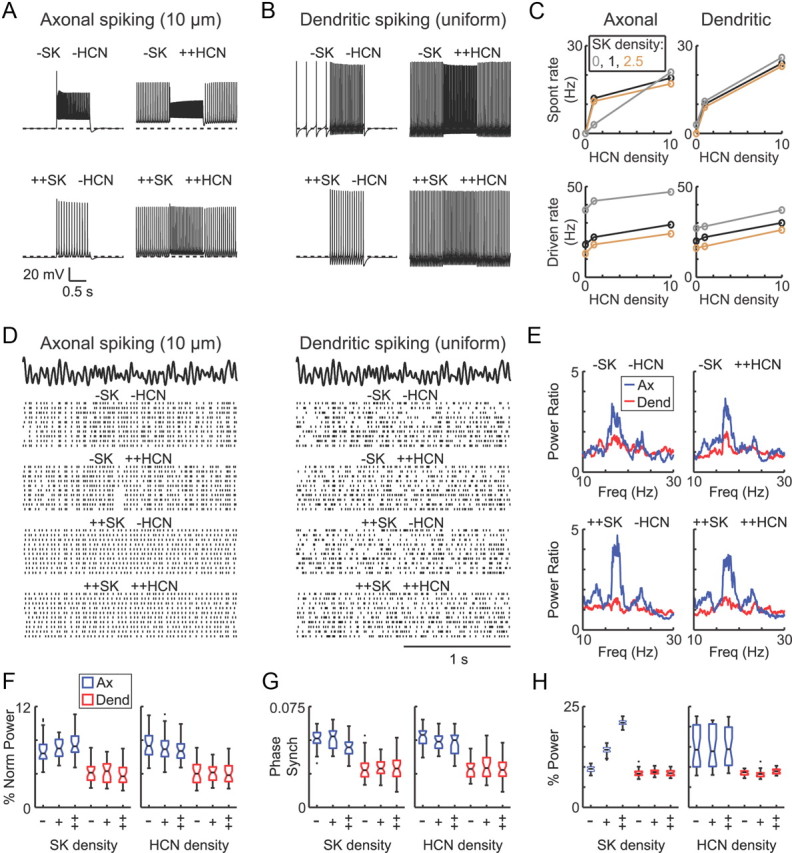
Effects of SK and HCN channels on the functioning of the model neurons. A–C, Effects of different SK and HCN channel expression levels under slice conditions (no synaptic input). To increase the functional impact of the HCN channels, we used model neurons in which the half-activation voltage for HCN channels was right-shifted by 20 mV and the density of the persistent sodium channels was reduced by ∼20% for these simulations. All other model properties were unchanged. Three expression levels were tested for each channel type: no expression (−), moderate expression (+; 1 S/m2 for HCN, 4 S/m2 for SK), and high (++; 10 S/m2 for both). The spontaneous firing rate was highly sensitive to the HCN expression level whether the dendritic gNaF level was low (A, left column in C) or uniformly high (B, right column in C), whereas the SK density had smaller effects on the spontaneous rate. The firing rate during a somatic current injection of +100 pA was affected by both channel types in both model neurons (C, bottom row). D–H, Effects of SK and HCN expression on responses to the same parkinsonian excitation patterns used in Figures 7 and 9 (CP = 0.022). D, Raster plots show that the trial-to-trial responses were more consistent in the model neuron with low dendritic gNaF than the uniform gNaF model, especially when the SK channel density was low. E, The beta frequency oscillation in the input was transferred more strongly by the axonal spiking than the dendritic spiking model neuron regardless of the HCN and SK channel expression levels. F, The relative increase in the spike train power spectrum from 16 to 19 Hz, which captures the beta oscillation in the input, was significantly greater for the axonal spiking model than the dendritic spiking model for all SK and HCN combinations but did not differ significantly as a function of the SK or HCN channel density in either model. G, Phase synchronization with the oscillatory input signal was significantly higher in the axonal spiking model than the dendritic spiking model for each SK and HCN combination. For the axonal spiking model neuron, phase synchronization was significantly reduced at the highest SK channel expression level compared with the zero and moderate SK groups. H, In the axonal spiking model, increased SK channel expression caused the output power to be concentrated near the average spike frequency. The inhibitory inputs were randomly timed and adjusted to achieve output spike rates of 28 Hz. Statistical comparisons were done using the Kruskal–Wallis test for multiple-group comparisons, followed by pairwise comparisons with the Wilcoxon's rank-sum (Mann–Whitney U) test. Box plots in F–H show the group median (black bar in middle), 95% confidence intervals for the median (notches), upper and lower quartiles (box boundaries), data within 1.5 times the interquartile range (whiskers), and statistical outliers (black dots beyond the whiskers).
Both SK and HCN channels affected the mean spike rates of the model neurons in the presence of synaptic input, so compensatory adjustments to the inhibitory input rate were necessary to achieve the same target spike rate of 28 Hz. For all values of SK and HCN expression, the model neuron with low dendritic NaF channel expression showed more consistent spike timing from trial to trial (Fig. 10D) and a greater relative increase in power at the input oscillation frequency (Fig. 10E,F) compared with the model neuron with high dendritic gNaF. To assess the contributions of HCN and SK channels, the 90 trials for each gNaF level (nine combinations of HCN and SK, with 10 trials for each combination) were grouped by either the HCN or SK density and compared (Fig. 10F–H). When HCN was used as the grouping variable, there were no significant differences (p > 0.05, Kruskal–Wallis one-way ANOVA) in the relative increase in power at the input oscillation frequency (Fig. 10F), the phase synchronization of the output spikes with the driver signal (Fig. 10G), or the relative power at the average model spike frequency ± 5 Hz (Fig. 10H). When the SK density served as the grouping variable, there were no significant differences in the relative increase in power at 16–19 Hz (Fig. 10F), and the high dendritic gNaF model showed no significant differences in phase synchronization, but the model neuron with low dendritic gNaF expression showed a small but significant decrease in phase synchronization when SK was high compared with the zero and medium levels (Fig. 10G). This effect can also be observed in the raster plots in Figure 10D, which show less consistent trial-to-trial spike firing at the highest SK density for this model neuron. Finally, the uniform gNaF model again showed no significant effect of the SK channel density on the output power near to the mean spike frequency, whereas the model neuron with low dendritic gNaF expression showed a very strong positive effect of SK channel expression on this measure (Fig. 10H). These results support three main conclusions: (1) the effects of dendritic NaF channel expression are robust for a wide range of HCN and SK channel expression levels; (2) even when HCN channel activity was essential for spontaneous pacemaking and strongly regulated the firing rate under “slice” conditions, the channels did not substantially affect the phase locking or oscillatory properties of the model neurons in the presence of parkinsonian synaptic input patterns; and (3) SK channels had little effect on the synaptic response properties of the model neuron with high dendritic NaF channel expression but caused the model neuron with low dendritic gNaF expression to fire more regularly and to oscillate at its mean firing frequency. This resulted in a small reduction in phase locking with the irregular 16–19 Hz parkinsonian input oscillation.
Dendritic NaF channels have similar decorrelating effects in simpler model neurons
The preceding results were all obtained in model neurons with nine ion channel types because of experimental evidence that each type is expressed in rat GP neurons. Although including all of these channel types has the obvious benefit of greater biological realism, it also greatly increases the model parameter space and may therefore increase the probability of obtaining results that are only valid for a specific and limited set of model parameters. One way to address this concern is to verify the main conclusions across a range of parameter combinations, as we did in the last section by varying the SK and HCN channel densities. Another approach is to reduce the parameter space by removing most of the model complexity, leaving only those components that are essential to the mechanism that is being studied. For this purpose, we applied oscillatory synaptic inputs to simplified model neurons that expressed only two types of ion channels: fast sodium channels and the delayed rectifier Kv2 (Table 2). With sinusoidal input oscillations, the model neurons with low levels of dendritic gNaF again showed the greatest tendency to transmit the oscillation (Fig. 11A,B). As we observed in the nine-channel models, the effect of dendritic gNaF was greatest when the input oscillation rate was similar to the model neuron spike rate (Fig. 11C); however, the model neurons with low dendritic gNaF showed a greater tendency to transmit input oscillations over all firing rates tested, ranging from 5 to 80 Hz. When the excitatory inputs were driven by the artificial parkinsonian spike trains, model neurons with lower dendritic gNaF expression levels showed the largest proportional increases in oscillatory beta frequency power (Fig. 11D) and significantly higher phase synchronization with the oscillatory driver signal (Fig. 11E) compared with those with high dendritic gNaF. Furthermore, because the two-channel model neurons did not enter depolarization block even at frequencies as high as 80 Hz, these results demonstrate that the decorrelating effects of dendritic gNaF still apply at high firing rates in model neurons that are capable of very fast firing. One difference between the two-channel models and their nine-channel counterparts was that dendritic gNaF expression did not cause a consistent shift in the mean phase of spiking relative to the driver signal oscillation (Fig. 11F), indicating that the effect of dendritic NaF channels on the phase relationship between output spiking and input oscillations is modified by the other ion channels present in the neuron.
Figure 11.

Dendritic NaF channels reduced the sensitivity to oscillatory input in the two-channel models for both sinusoidal (A–C) and parkinsonian (D–F) inputs. A, Raster plots are shown for models with five different dendritic gNaF distributions responding to sinusoidal oscillations in the excitatory inputs at 20 Hz (A1) or 5 Hz (A2). The inhibitory input rate was adjusted to make the model neurons fire at 20 Hz in each case. B, Power spectra are shown for oscillation frequencies of 5, 13, 20, 28, and 37 Hz, all with the model spike rate being 20 Hz. Like the more complex models with nine different channel types, the two-channel models showed an inverse relationship between the level of dendritic gNaF and the tendency to transmit global input oscillations. C, Plots of the percentage of spectral power within ±1 Hz of the oscillation frequency demonstrate that the two-channel models showed resonance between the intrinsic pacemaker and the oscillatory input, similar to the nine-channel models. Although the effect of dendritic gNaF was largest when the spike rate matched the input oscillation, the models with the lowest dendritic gNaF density showed the greatest tendency to transmit the input oscillations at all firing rates tested. D–F, When artificial parkinsonian spike trains were used for the excitatory synaptic inputs, the two-channel models with the lowest dendritic gNaF expression transmitted the oscillatory pattern most strongly (D) and showed the greatest phase locking to the input (E). Unlike the nine-channel models, no significant differences were observed between the two-channel models in the mean phase at which spikes tended to occur relative to the input oscillation (F).
Reduced input averaging as a mechanism of decorrelation
A possible explanation for why model neurons with lower dendritic NaF channel expression were more sensitive to the oscillations can be proposed by considering what triggers spike initiation in each model. In the low dendritic gNaF models (L10 and L25), all action potentials initiated in the axon initial segment. Spike timing would therefore be dictated by the combination of the axo-somatic pacemaker and the weighted sum of all excitatory and inhibitory synaptic inputs filtered by the dendritic tree. Signals that were disproportionately represented in the input population, such as correlated rate changes or synchronized oscillations, would be reflected most strongly in the output spiking of the neuron. With high dendritic gNaF expression, spike initiation can occur at multiple locations and is more sensitive to the activity of small groups of neighboring synapses rather than the global weighted sum of the synaptic input. Although the individual inputs still reflected the underlying oscillation, the stochastic nature of synapses makes their activity more loosely tied to the oscillation than is the global population average. To illustrate this concept, we compared the summed conductance trace representing all 800 AMPA synapses with the summed conductance traces of small groups of 10 AMPA synapses (Fig. 12). The inputs were from the CP = 0.022 pool. The oscillation in the driver signal (Fig. 12A1) was clearly visible in the globally summed conductance trace (Fig. 12A2) but much less apparent in the summed conductance traces of small groups of synapses (Fig. 12A3, 10 synapses per group, randomly selected). This was confirmed by power spectral (Fig. 12B) and coherence (Fig. 12C) analysis. Furthermore, this analysis does not take into account the effects of dendritic low-pass filtering, which increases with distance and will therefore have a greater effect on the somatic input average than on spatially localized dendritic input events.
Figure 12.
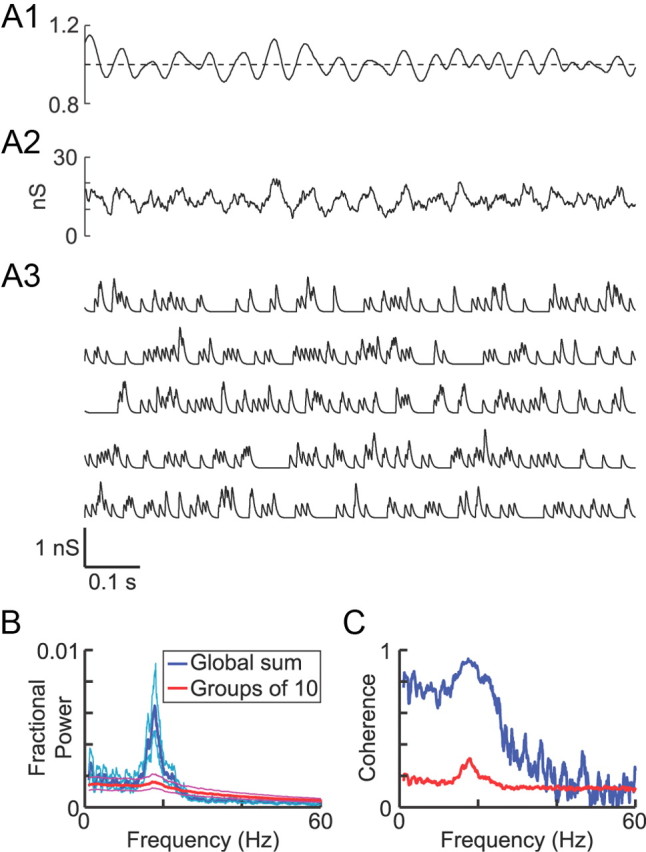
The oscillation is conveyed more strongly by the global average of the inputs than by local groups. A, One second of example data from the parkinsonian inputs with CP = 0.022. The oscillatory nature of the driver signal (A1) is more visible in the total summed conductance for all 800 AMPA synapses (A2) than in the summed conductance traces of randomly selected groups of 10 AMPA synapses (A3; 5 different groups of 10 synapses each). Compared with the summed conductance of 10 synapses, the 800-synapse conductance sum had an increase in relative beta frequency power (B) and coherence with the driver signal (C). In B and C, the plots for 10-synapse groups reflect the average of 80 different randomly selected groups. The dashed lines in B are 95% confidence intervals generated by a jackknife procedure.
Discussion
The results of this study demonstrate that a high density of dendritic NaF channels can serve as a cellular mechanism of active decorrelation and reduce the tendency of model GP neurons to propagate input oscillations to their targets. Conversely, a low density of dendritic NaF channels favors correlated responses to shared input and increases phase locking with input oscillations. These findings were valid whether the oscillatory synaptic inputs were excitatory or inhibitory and whether the spiking pattern of individual synapses was random timing with a sinusoidal rate modulation or parkinsonian bursting activity with an underlying oscillation more like a local field potential. The results were also consistent across a range of ion channel contexts.
There are two different cellular mechanisms contributing to our results. First, for oscillations near to the firing frequency of the target neuron, resonance between the oscillatory input and the intrinsic pacemaker that controls spontaneous GP firing causes strong phase locking of the target neuron to the input. This mechanism is strengthened by SK channel expression but is disrupted by high expression of dendritic NaF channels because local dendritic spike initiation reduces the impact of intrinsic pacemaking. Second, even when the input oscillation does not match the neural firing rate or does not have a consistent cycle duration, dendritic NaF channels still disrupt phase locking of the target neuron to the underlying oscillation. This result most likely reflects the shift in spike initiation from the axon initial segment, in which spike timing reflects the global weighted sum of synaptic input throughout the soma and dendrites, to local dendritic branches in which small groups of neighboring synapses can trigger spikes. For this reason, oscillations (or non-oscillatory shared input signals) that are reflected in the global input average should be better detected by GP neurons with low dendritic gNaF expression. Conversely, an oscillation carried by a small number of highly correlated inputs would be detected better by a neuron with high dendritic gNaF if the oscillatory inputs were clustered together and excitatory (Edgerton et al., 2010). However, the prominent beta oscillations present in local field potential recordings from the GPe of parkinsonian patients (Silberstein et al., 2003) and rats (Mallet et al., 2008b) indicate that, in PD, oscillatory inputs to GP are prevalent in the input population as a whole and not confined to a small number of adjacent synapses.
The quantitative expression density of NaF channels in GP dendrites has not been determined for either normal or parkinsonian animals, so one limitation of the present study is that we only demonstrate a possible biological mechanism of active decorrelation and cannot determine how important dendritic NaF channel expression is to active decorrelation in biological GP neurons. However, NaF channel proteins are present in rat GP dendrites, and there is evidence that excitatory synaptic inputs can trigger propagating dendritic sodium spikes in rat GP neurons (Hanson et al., 2004). Furthermore, it has been demonstrated in other neuron types that the NaF current density is subject to regulation through multiple pathways and on multiple timescales (Surmeier et al., 1992; Cantrell et al., 1997; Cantrell and Catterall, 2001; Herzog et al., 2003; Hu et al., 2005; Xu et al., 2005), indicating that the dendritic gNaF expression level in GP dendrites could be dynamic. Given these findings, two reasonable and testable hypotheses emerge from the present study: (1) that dendritic NaF channel expression in GP neurons is an important contributor to the lack of correlated activity between neighboring pairs of GP neurons in normal animals; and (2) that a decrease in the dendritic NaF channel expression density contributes to the emergence of network oscillations in PD.
It has been reported that dopamine receptor agonists induce Fos expression in the rat GP (Ruskin and Marshall, 1995), providing direct evidence for dopaminergic effects on gene expression in GP neurons. Application of dopamine or dopamine receptor agonists to rat GP neurons in slices has been found to depolarize the neurons and increase their firing rates (Nakanishi et al., 1985), alter mGluR signaling (Poisik et al., 2007), and suppress GABAergic IPSCs, at least partly through postsynaptic mechanisms (Nakanishi et al., 1985; Shin et al., 2003). Furthermore, dopamine depletion was shown recently to downregulate HCN channel expression in rat and mouse GP neurons and to cause the neurons to lose their normal pacemaking function (Chan et al., 2011). The same study found that somatic sodium channel currents were not altered and that GP neuron sodium channel mRNA levels were not consistently changed by dopamine depletion, but whether or not dendritic sodium channel expression is altered remains an open question. The loss of pacemaking activity in the neurons indicates that HCN channels were not the only GP ion channels affected by dopamine depletion, because acutely blocking HCN channels causes only a moderate change in the spontaneous firing rate (Chan et al., 2004); a decrease in dendritic sodium channel expression would further reduce excitability and could explain the discrepancy between acute HCN channel block effects and the downregulation of HCN channels in dopamine-depleted animals.
In a previous study with this set of model GP neurons (Edgerton et al., 2010), we showed that higher dendritic NaF channel expression resulted in increased sensitivity to clustered synchronous excitation and greater relative effectiveness of distal synaptic inputs (both excitatory and inhibitory). Because there is evidence of increased receptive field sizes and reduced specificity of GP neuron responses in parkinsonian animals (Filion et al., 1988) in addition to the elevated GP synchrony observed in PD, we hypothesized that upregulation of dendritic NaF channels in PD could contribute to some of the symptoms. In the present study, we developed a novel method to construct artificial spike trains that preserve the statistical properties of STN neurons recorded in hemi-parkinsonian rats. When we applied the parkinsonian input patterns to the model neurons, dendritic NaF channel expression had the opposite effect from what we had originally predicted because the oscillatory pattern was present throughout the population, not just in a small number of clustered excitatory inputs. As such, the results of this study are more consistent with a high density of dendritic gNaF in normal GP neurons and a lower density in PD. This would not account for the increased receptive field sizes observed in GP neurons of MPTP-treated parkinsonian monkeys, but the monkeys also show reduced neural response specificity in the motor cortex (Goldberg et al., 2002) and corticostriatal connections (Helmich et al., 2010), which could explain the receptive field alterations seen in GP.
Several previous studies have addressed mechanisms that are likely to influence GP neuron synchronization. The GP and STN are reciprocally connected and are both composed of tonically active projection neurons, creating a suitable architecture for the generation or propagation of synchronous oscillations (Bevan et al., 2002). Network modeling work has demonstrated that sparse connectivity between the GP and STN, strong collateral inhibition between GP neurons, and weak levels of tonic inhibition from the striatum would all favor uncorrelated, irregular activity in the network, whereas increased striatal inhibition or a weakening of collateral inhibition between GP neurons would promote synchronous oscillations (Terman et al., 2002). Increased striatal inhibition combined with strengthened STN rebound bursts also favored a switch from uncorrelated activity to synchronous oscillations in the same network model (Best et al., 2007). Using a different network model, Holgado et al. (2010) found that the coupling strengths and conduction delays between GP and STN, as well as the relative strengths of the cortical input to STN and the striatal input to GP, could all critically influence whether or not beta oscillations emerged in the network. At the cellular level, electrophysiological studies and modeling studies have demonstrated that HCN channels (Chan et al., 2004) and SK channels (Deister et al., 2009; Schultheiss et al., 2010) can make GP neurons more likely to synchronize in response to common input. In the present study, SK channels reduced the firing rate of all model neurons but only affected phase locking and oscillatory activity when dendritic NaF expression was low. In the model with low dendritic gNaF, SK channels promoted clock-like firing at the mean spike rate and thereby reduced phase locking of the model neuron to input oscillations at different frequencies. In the model with high dendritic gNaF, distributed dendritic spike initiation dominated over the intrinsic axo-somatic pacemaker such that SK channels did not affect phase locking or oscillatory output. HCN channels affected the firing rate but did not significantly affect phase locking or oscillatory firing in any of our simulations with synaptic input, although we attempted to exaggerate the functional importance of the channels. Thus, the dendritic NaF channel expression level was a stronger determinant of input phase-locking properties than either the HCN or SK channel density in our model GP neurons. Ultimately, many different mechanisms probably contribute to the regulation of correlated and oscillatory firing in GP neurons. Our results point to dendritic NaF channel expression as an attractive candidate for additional study.
Footnotes
This work was supported by NINDS Grants 5R01-NS039852 (D.J.) and F32 NS051020 (J.R.E.). Neural spike trains from hemi-parkinsonian rats were graciously provided by Drs. N. Mallet and P. J. Magill (Medical Research Council Anatomical Neuropharmacology Unit, Oxford University, Oxford, UK).
References
- Bar-Gad I, Heimer G, Ritov Y, Bergman H. Functional correlations between neighboring neurons in the primate globus pallidus are weak or nonexistent. J Neurosci. 2003;23:4012–4016. doi: 10.1523/JNEUROSCI.23-10-04012.2003. [DOI] [PMC free article] [PubMed] [Google Scholar]
- Berens P. CircStat: a MATLAB toolbox for circular statistics. J Stat Software. 2009;31:1–21. [Google Scholar]
- Bergman H, Wichmann T, Karmon B, DeLong MR. The primate subthalamic nucleus. II. Neuronal activity in the MPTP model of parkinsonism. J Neurophysiol. 1994;72:507–520. doi: 10.1152/jn.1994.72.2.507. [DOI] [PubMed] [Google Scholar]
- Best J, Park C, Terman D, Wilson C. Transitions between irregular and rhythmic firing patterns in excitatory-inhibitory neuronal networks. J Comput Neurosci. 2007;23:217–235. doi: 10.1007/s10827-007-0029-7. [DOI] [PubMed] [Google Scholar]
- Bevan MD, Magill PJ, Terman D, Bolam JP, Wilson CJ. Move to the rhythm: oscillations in the subthalamic nucleus-external globus pallidus network. Trends Neurosci. 2002;25:525–531. doi: 10.1016/s0166-2236(02)02235-x. [DOI] [PubMed] [Google Scholar]
- Bokil H, Tchernichovsky O, Mitra PP. Dynamic phenotypes: time series analysis techniques for characterizing neuronal and behavioral dynamics. Neuroinformatics. 2006;4:119–128. doi: 10.1385/NI:4:1:119. [DOI] [PubMed] [Google Scholar]
- Bokil H, Andrews P, Kulkarni JE, Mehta S, Mitra PP. Chronux: A platform for analyzing neural signals. J Neurosci Methods. 2010;192:146–151. doi: 10.1016/j.jneumeth.2010.06.020. [DOI] [PMC free article] [PubMed] [Google Scholar]
- Buzsáki G, Draguhn A. Neuronal oscillations in cortical networks. Science. 2004;304:1926–1929. doi: 10.1126/science.1099745. [DOI] [PubMed] [Google Scholar]
- Cantrell AR, Catterall WA. Neuromodulation of Na+ channels: an unexpected form of cellular plasticity. Nat Rev Neurosci. 2001;2:397–407. doi: 10.1038/35077553. [DOI] [PubMed] [Google Scholar]
- Cantrell AR, Smith RD, Goldin AL, Scheuer T, Catterall WA. Dopaminergic modulation of sodium current in hippocampal neurons via cAMP-dependent phosphorylation of specific sites in the sodium channel α subunit. J Neurosci. 1997;17:7330–7338. doi: 10.1523/JNEUROSCI.17-19-07330.1997. [DOI] [PMC free article] [PubMed] [Google Scholar]
- Chan CS, Shigemoto R, Mercer JN, Surmeier DJ. HCN2 and HCN1 channels govern the regularity of autonomous pacemaking and synaptic resetting in globus pallidus neurons. J Neurosci. 2004;24:9921–9932. doi: 10.1523/JNEUROSCI.2162-04.2004. [DOI] [PMC free article] [PubMed] [Google Scholar]
- Chan CS, Glajch KE, Gertler TS, Guzman JN, Mercer JN, Lewis AS, Goldberg AB, Tkatch T, Shigemoto R, Fleming SM, Chetkovich DM, Osten P, Kita H, Surmeier DJ. HCN channelopathy in external globus pallidus neurons in models of Parkinson's disease. Nat Neurosci. 2011;14:85–92. doi: 10.1038/nn.2692. [DOI] [PMC free article] [PubMed] [Google Scholar]
- Chen L, Yung KK, Yung WH. Neurotensin selectively facilitates glutamatergic transmission in globus pallidus. Neuroscience. 2006;141:1871–1878. doi: 10.1016/j.neuroscience.2006.05.049. [DOI] [PubMed] [Google Scholar]
- Chen L, Cui QL, Yung WH. Neurokinin-1 receptor activation in globus pallidus. Front Neurosci. 2009;3:58. doi: 10.3389/neuro.23.002.2009. [DOI] [PMC free article] [PubMed] [Google Scholar]
- Deister CA, Chan CS, Surmeier DJ, Wilson CJ. Calcium-activated SK channels influence voltage-gated ion channels to determine the precision of firing in globus pallidus neurons. J Neurosci. 2009;29:8452–8461. doi: 10.1523/JNEUROSCI.0576-09.2009. [DOI] [PMC free article] [PubMed] [Google Scholar]
- DeLong MR. Activity of pallidal neurons during movement. J Neurophysiol. 1971;34:414–427. doi: 10.1152/jn.1971.34.3.414. [DOI] [PubMed] [Google Scholar]
- Dobrunz LE, Stevens CF. Heterogeneity of release probability, facilitation, and depletion at central synapses. Neuron. 1997;18:995–1008. doi: 10.1016/s0896-6273(00)80338-4. [DOI] [PubMed] [Google Scholar]
- Edgerton JR, Hanson JE, Günay C, Jaeger D. Dendritic sodium channels regulate network integration in globus pallidus neurons: a modeling study. J Neurosci. 2010;30:15146–15159. doi: 10.1523/JNEUROSCI.2662-10.2010. [DOI] [PMC free article] [PubMed] [Google Scholar]
- Efron B. Better bootstrap confidence intervals. J Am Stat Assoc. 1987;82:171–185. [Google Scholar]
- Elias S, Joshua M, Goldberg JA, Heimer G, Arkadir D, Morris G, Bergman H. Statistical properties of pauses of the high-frequency discharge neurons in the external segment of the globus pallidus. J Neurosci. 2007;27:2525–2538. doi: 10.1523/JNEUROSCI.4156-06.2007. [DOI] [PMC free article] [PubMed] [Google Scholar]
- Falls WM, Park MR, Kitai ST. An intracellular HRP study of the rat globus pallidus. II. Fine structural characteristics and synaptic connections of medially located large GP neurons. J Comp Neurol. 1983;221:229–245. doi: 10.1002/cne.902210210. [DOI] [PubMed] [Google Scholar]
- Filion M, Tremblay L, Bédard PJ. Abnormal influences of passive limb movement on the activity of globus pallidus neurons in parkinsonian monkeys. Brain Research. 1988;444:165–176. doi: 10.1016/0006-8993(88)90924-9. [DOI] [PubMed] [Google Scholar]
- Fries P. Neuronal gamma-band synchronization as a fundamental process in cortical computation. Annu Rev Neurosci. 2009;32:209–224. doi: 10.1146/annurev.neuro.051508.135603. [DOI] [PubMed] [Google Scholar]
- Goldberg JA, Boraud T, Maraton S, Haber SN, Vaadia E, Bergman H. Enhanced synchrony among primary motor cortex neurons in the 1-methyl-4-phenyl-1,2,3,6-tetrahydropyridine primate model of Parkinson's disease. J Neurosci. 2002;22:4639–4653. doi: 10.1523/JNEUROSCI.22-11-04639.2002. [DOI] [PMC free article] [PubMed] [Google Scholar]
- Günay C, Edgerton JR, Jaeger D. Channel density distributions explain spiking variability in the globus pallidus: a combined physiology and computer simulation database approach. J Neurosci. 2008;28:7476–7491. doi: 10.1523/JNEUROSCI.4198-07.2008. [DOI] [PMC free article] [PubMed] [Google Scholar]
- Hanson JE, Jaeger D. Short-term plasticity shapes the response to simulated normal and parkinsonian input patterns in the globus pallidus. J Neurosci. 2002;22:5164–5172. doi: 10.1523/JNEUROSCI.22-12-05164.2002. [DOI] [PMC free article] [PubMed] [Google Scholar]
- Hanson JE, Smith Y, Jaeger D. Sodium channels and dendritic spike initiation at excitatory synapses in globus pallidus neurons. J Neurosci. 2004;24:329–340. doi: 10.1523/JNEUROSCI.3937-03.2004. [DOI] [PMC free article] [PubMed] [Google Scholar]
- Hashimoto K, Kita H. Serotonin activates presynaptic and postsynaptic receptors in rat globus pallidus. J Neurophysiol. 2008;99:1723–1732. doi: 10.1152/jn.01143.2007. [DOI] [PubMed] [Google Scholar]
- Heimer G, Bar-Gad I, Goldberg JA, Bergman H. Dopamine replacement therapy reverses abnormal synchronization of pallidal neurons in the 1-methyl-4-phenyl-1,2,3,6-tetrahydropyridine primate model of parkinsonism. J Neurosci. 2002;22:7850–7855. doi: 10.1523/JNEUROSCI.22-18-07850.2002. [DOI] [PMC free article] [PubMed] [Google Scholar]
- Helmich RC, Derikx LC, Bakker M, Scheeringa R, Bloem BR, Toni I. Spatial remapping of cortico-striatal connectivity in Parkinson's disease. Cereb Cortex. 2010;20:1175–1186. doi: 10.1093/cercor/bhp178. [DOI] [PubMed] [Google Scholar]
- Herzog RI, Liu C, Waxman SG, Cummins TR. Calmodulin binds to the C terminus of sodium channels Nav1.4 and Nav1.6 and differentially modulates their functional properties. J Neurosci. 2003;23:8261–8270. doi: 10.1523/JNEUROSCI.23-23-08261.2003. [DOI] [PMC free article] [PubMed] [Google Scholar]
- Hessler NA, Shirke AM, Malinow R. The probability of transmitter release at a mammalian central synapse. Nature. 1993;366:569–572. doi: 10.1038/366569a0. [DOI] [PubMed] [Google Scholar]
- Holgado AJ, Terry JR, Bogacz R. Conditions for the generation of beta oscillations in the subthalamic nucleus–globus pallidus network. J Neurosci. 2010;30:12340–12352. doi: 10.1523/JNEUROSCI.0817-10.2010. [DOI] [PMC free article] [PubMed] [Google Scholar]
- Hu XT, Dong Y, Zhang XF, White FJ. Dopamine D-2 receptor-activated Ca2+ signaling modulates voltage-sensitive sodium currents in rat nucleus accumbens neurons. J Neurophysiol. 2005;93:1406–1417. doi: 10.1152/jn.00771.2004. [DOI] [PubMed] [Google Scholar]
- Israel Z, Bergman H. Pathophysiology of the basal ganglia and movement disorders: from animal models to human clinical applications. Neurosci Biobehav Rev. 2008;32:367–377. doi: 10.1016/j.neubiorev.2007.08.005. [DOI] [PubMed] [Google Scholar]
- Kita H, Kitai ST. The morphology of globus pallidus projection neurons in the rat: an intracellular staining study. Brain Res. 1994;636:308–319. doi: 10.1016/0006-8993(94)91030-8. [DOI] [PubMed] [Google Scholar]
- Kühn AA, Trottenberg T, Kivi A, Kupsch A, Schneider GH, Brown P. The relationship between local field potential and neuronal discharge in the subthalamic nucleus of patients with Parkinson's disease. Exp Neurol. 2005;194:212–220. doi: 10.1016/j.expneurol.2005.02.010. [DOI] [PubMed] [Google Scholar]
- Kühn AA, Kempf F, Brücke C, Gaynor Doyle L, Martinez-Torres I, Pogosyan A, Trottenberg T, Kupsch A, Schneider GH, Hariz MI, Vandenberghe W, Nuttin B, Brown P. High-frequency stimulation of the subthalamic nucleus suppresses oscillatory beta activity in patients with Parkinson's disease in parallel with improvement in motor performance. J Neurosci. 2008;28:6165–6173. doi: 10.1523/JNEUROSCI.0282-08.2008. [DOI] [PMC free article] [PubMed] [Google Scholar]
- Levy R, Ashby P, Hutchison WD, Lang AE, Lozano AM, Dostrovsky JO. Dependence of subthalamic nucleus oscillations on movement and dopamine in Parkinson's disease. Brain. 2002;125:1196–1209. doi: 10.1093/brain/awf128. [DOI] [PubMed] [Google Scholar]
- Mallet N, Pogosyan A, Sharott A, Csicsvari J, Bolam JP, Brown P, Magill PJ. Disrupted dopamine transmission and the emergence of exaggerated beta oscillations in subthalamic nucleus and cerebral cortex. J Neurosci. 2008a;28:4795–4806. doi: 10.1523/JNEUROSCI.0123-08.2008. [DOI] [PMC free article] [PubMed] [Google Scholar]
- Mallet N, Pogosyan A, Márton LF, Bolam JP, Brown P, Magill PJ. Parkinsonian beta oscillations in the external globus pallidus and their relationship with subthalamic nucleus activity. J Neurosci. 2008b;28:14245–14258. doi: 10.1523/JNEUROSCI.4199-08.2008. [DOI] [PMC free article] [PubMed] [Google Scholar]
- Mitra PP, Bokil H. New York: Oxford UP; 2008. Observed brain dynamics. [Google Scholar]
- Nakanishi H, Hori N, Kastuda N. Neostriatal evoked inhibition and effects of dopamine on globus pallidal neurons in rat slice preparations. Brain Res. 1985;358:282–286. doi: 10.1016/0006-8993(85)90972-2. [DOI] [PubMed] [Google Scholar]
- Nini A, Feingold A, Slovin H, Bergman H. Neurons in the globus pallidus do not show correlated activity in the normal monkey, but phase-locked oscillations appear in the MPTP model of parkinsonism. J Neurophysiol. 1995;74:1800–1805. doi: 10.1152/jn.1995.74.4.1800. [DOI] [PubMed] [Google Scholar]
- Percheron G, Filion M. Parallel processing in the basal ganglia: up to a point. Trends Neurosci. 1991;14:55–59. doi: 10.1016/0166-2236(91)90020-u. [DOI] [PubMed] [Google Scholar]
- Percheron G, Yelnik J, François C. A Golgi analysis of the primate globus pallidus. III. Spatial organization of the striato-pallidal complex. J Comp Neurol. 1984;227:214–227. doi: 10.1002/cne.902270207. [DOI] [PubMed] [Google Scholar]
- Poisik OV, Smith Y, Conn PJ. D1- and D2-like dopamine receptors regulate signaling properties of group I metabotropic glutamate receptors in the rat globus pallidus. Eur J Neurosci. 2007;26:852–862. doi: 10.1111/j.1460-9568.2007.05710.x. [DOI] [PubMed] [Google Scholar]
- Raz A, Vaadia E, Bergman H. Firing patterns and correlations of spontaneous discharge of pallidal neurons in the normal and the tremulous 1-methyl-4-phenyl-1,2,3,6-tetrahydropyridine vervet model of parkinsonism. J Neurosci. 2000;20:8559–8571. doi: 10.1523/JNEUROSCI.20-22-08559.2000. [DOI] [PMC free article] [PubMed] [Google Scholar]
- Rosenmund C, Clements JD, Westbrook GL. Nonuniform probability of glutamate release at a hippocampal synapse. Science. 1993;262:754–757. doi: 10.1126/science.7901909. [DOI] [PubMed] [Google Scholar]
- Ruskin DN, Marshall JF. D-1 dopamine receptors influence Fos immunoreactivity in the globus pallidus and subthalamic nucleus of intact and nigrostriatal-lesioned rats. Brain Res. 1995;703:156–164. doi: 10.1016/0006-8993(95)01093-9. [DOI] [PubMed] [Google Scholar]
- Ruskin DN, Bergstrom DA, Kaneoke Y, Patel BN, Twery MJ, Walters JR. Multisecond oscillations in firing rate in the basal ganglia: Robust modulation by dopamine receptor activation and anesthesia. J Neurophysiol. 1999;81:2046–2055. doi: 10.1152/jn.1999.81.5.2046. [DOI] [PubMed] [Google Scholar]
- Sadek AR, Magill PJ, Bolam JP. A single-cell analysis of intrinsic connectivity in the rat globus pallidus. J Neurosci. 2007;27:6352–6362. doi: 10.1523/JNEUROSCI.0953-07.2007. [DOI] [PMC free article] [PubMed] [Google Scholar]
- Sato F, Lavallée P, Lévesque M, Parent A. Single-axon tracing study of neurons of the external segment of the globus pallidus in primate. J Comp Neurol. 2000;417:17–31. [PubMed] [Google Scholar]
- Schultheiss NW, Edgerton JR, Jaeger D. Phase response curve analysis of a full morphological globus pallidus neuron model reveals distinct perisomatic and dendritic modes of synaptic integration. J Neurosci. 2010;30:2767–2782. doi: 10.1523/JNEUROSCI.3959-09.2010. [DOI] [PMC free article] [PubMed] [Google Scholar]
- Sharott A, Magill PJ, Harnack D, Kupsch A, Meissner W, Brown P. Dopamine depletion increases the power and coherence of beta-oscillations in the cerebral cortex and subthalamic nucleus of the awake rat. Eur J Neurosci. 2005;21:1413–1422. doi: 10.1111/j.1460-9568.2005.03973.x. [DOI] [PubMed] [Google Scholar]
- Shen GY, Chen WR, Midtgaard J, Shepherd GM, Hines ML. Computational analysis of action potential initiation in mitral cell soma and dendrites based on dual patch recordings. J Neurophysiol. 1999;82:3006–3020. doi: 10.1152/jn.1999.82.6.3006. [DOI] [PubMed] [Google Scholar]
- Shin RM, Masuda M, Miura M, Sano H, Shirasawa T, Song WJ, Kobayashi K, Aosaki T. Dopamine D4 receptor-induced postsynaptic inhibition of GABAergic currents in mouse globus pallidus neurons. J Neurosci. 2003;23:11662–11672. doi: 10.1523/JNEUROSCI.23-37-11662.2003. [DOI] [PMC free article] [PubMed] [Google Scholar]
- Silberstein P, Kühn AA, Kupsch A, Trottenberg T, Krauss JK, Wöhrle JC, Mazzone P, Insola A, Di Lazzaro V, Oliviero A, Aziz T, Brown P. Patterning of globus pallidus local field potentials differs between Parkinson's disease and dystonia. Brain. 2003;126:2597–2608. doi: 10.1093/brain/awg267. [DOI] [PubMed] [Google Scholar]
- Sims RE, Woodhall GL, Wilson CL, Stanford IM. Functional characterization of GABAergic pallidopallidal and striatopallidal synapses in the rat globus pallidus in vitro. Eur J Neurosci. 2008;28:2401–2408. doi: 10.1111/j.1460-9568.2008.06546.x. [DOI] [PubMed] [Google Scholar]
- Soares J, Kliem MA, Betarbet R, Greenamyre JT, Yamamoto B, Wichmann T. Role of external pallidal segment in primate parkinsonism: comparison of the effects of 1-methyl-4-phenyl-1,2,3,6-tetrahydropyridine-induced parkinsonism and lesions of the external pallidal segment. J Neurosci. 2004;24:6417–6426. doi: 10.1523/JNEUROSCI.0836-04.2004. [DOI] [PMC free article] [PubMed] [Google Scholar]
- Surmeier DJ, Eberwine J, Wilson CJ, Cao Y, Stefani A, Kitai ST. Dopamine receptor subtypes colocalize in rat striatonigral neurons. Proc Natl Acad Sci U S A. 1992;89:10178–10182. doi: 10.1073/pnas.89.21.10178. [DOI] [PMC free article] [PubMed] [Google Scholar]
- Tass P, Rosenblum MG, Weule J, Kurths J, Pikovsky A, Volkmann J, Schnitzler A, Freund HJ. Detection of n:m phase locking from noisy data: application to magnetoencephalography. Phys Rev Lett. 1998;81:3291–3294. [Google Scholar]
- Terman D, Rubin JE, Yew AC, Wilson CJ. Activity patterns in a model for the subthalamopallidal network of the basal ganglia. J Neurosci. 2002;22:2963–2976. doi: 10.1523/JNEUROSCI.22-07-02963.2002. [DOI] [PMC free article] [PubMed] [Google Scholar]
- Thomson DJ. Spectrum estimation and harmonic: analysis. Proc IEEE. 1982;70:1055–1096. [Google Scholar]
- Uhlhaas PJ, Singer W. Neural synchrony in brain disorders: relevance for cognitive dysfunctions and pathophysiology. Neuron. 2006;52:155–168. doi: 10.1016/j.neuron.2006.09.020. [DOI] [PubMed] [Google Scholar]
- Urbain N, Gervasoni D, Soulière F, Lobo L, Rentéro N, Windels F, Astier B, Savasta M, Fort P, Renaud B, Luppi PH, Chouvet G. Unrelated course of subthalamic nucleus and globus pallidus neuronal activities across vigilance states in the rat. Eur J Neurosci. 2000;12:3361–3374. doi: 10.1046/j.1460-9568.2000.00199.x. [DOI] [PubMed] [Google Scholar]
- Urbain N, Rentéro N, Gervasoni D, Renaud B, Chouvet G. The switch of subthalamic neurons from an irregular to a bursting pattern does not solely depend on their GABAergic inputs in the anesthetic-free rat. J Neurosci. 2002;22:8665–8675. doi: 10.1523/JNEUROSCI.22-19-08665.2002. [DOI] [PMC free article] [PubMed] [Google Scholar]
- Wahl-Schott C, Biel M. HCN channels: structure, cellular regulation and physiological function. Cell Mol Life Sci. 2009;66:470–494. doi: 10.1007/s00018-008-8525-0. [DOI] [PMC free article] [PubMed] [Google Scholar]
- Willems FMJ, Shtarkov YM, Tjalkens TJ. The context-tree weighting method: basic properties. IEEE Trans Inform Theory. 1995;41:653–664. [Google Scholar]
- Xu J, Kang N, Jiang L, Nedergaard M, Kang J. Activity-dependent long-term potentiation of intrinsic excitability in hippocampal CA1 pyramidal neurons. J Neurosci. 2005;25:1750–1760. doi: 10.1523/JNEUROSCI.4217-04.2005. [DOI] [PMC free article] [PubMed] [Google Scholar]
- Yelnik J. Functional anatomy of the basal ganglia. Move Disord. 2002;17(Suppl 3):S15–S21. doi: 10.1002/mds.10138. [DOI] [PubMed] [Google Scholar]