

Abstract
Endogenous expression of the adaptor protein HSH2 is regulated in a dynamic manner during B cell maturation and differentiation. Developing B cells lack detectable HSH2, whereas T1 and T2 B cells in the periphery exhibit increasing levels of expression. Mature follicular B cells exhibit decreased expression of HSH2 compared to T2 cells and expression is further downregulated in germinal center B cells. In contrast, marginal zone B cells and B1a/b B cells exhibit high-level HSH2 expression. Regulation of HSH2 expression plays a critical role in determining the outcome of the humoral immune response as demonstrated using HSH2 transgenic mice. Constitutive expression of HSH2 in the B lineage at levels comparable to B1a/b B cells results in decreased serum Ig titers for all subclasses with the exception of IgA. HSH2 Tg mice immunized with T-dependent or T-independent antigens exhibit a moderate decrease in the production of antigen-specific IgM, whereas class switched isotypes are decreased by approximately 80–90% compared to control mice. Analysis of HSH2 Tg B cell activation in vitro demonstrated that HSH2 selectively regulates the B cell response to TNF family receptors (i.e. CD40 and BAFF-R), but not BCR- or TLR-dependent signals. These data demonstrate that changes in HSH2 expression have profound effects on the humoral immune response.
Introduction
The hematopoietic SH2-containing adaptor protein (HSH2) is an adaptor protein that is expressed in cells of the B lineage (1). HSH2 is expressed at very low levels in the total splenic B cell population. However, its expression is significantly upregulated in response to agonists that promote B cell survival and differentiation (2). Specifically, it was observed that stimulation of splenic B cells with LPS or CpG DNA, which induce signaling via Toll Like Receptor (TLR)-4 and TLR-9, respectively, leads to upregulation of HSH2 expression within 6–12 hours. Similarly, stimulation of splenic B cells via CD40 or B cell activating factor (BAFF)-R promotes potent upregulation of HSH2 expression. Both TLR and TNF family receptor signaling were found to induce HSH2 expression in an NF-κB-dependent manner (2). In contrast to this, signaling via the B cell antigen receptor (BCR) in response to anti-IgM Ab or antigen was not observed to induce HSH2 expression and in fact appeared to cause a decrease in the basal expression of the adaptor protein (2). Thus, it has been shown that HSH2 is upregulated in response to a range of costimulatory signals that have been shown to promote B cell survival and differentiation.
Studies with splenic B cells have further demonstrated that HSH2 expression is inversely correlated with apoptosis. Stimulation of splenic B cells with anti-IgM Ab or antigen in the absence of costimulation was observed to induce increased apoptosis, which correlated with a decrease in the basal level of HSH2 expression (1). Whereas treatment of splenic B cells with LPS promotes upregulation of HSH2 expression and survival, the simultaneous addition of IL-21 was observed to induce apoptosis, which was preceded by downregulation of HSH2 expression (2). It was determined that HSH2 expression in splenic B cells stimulated with agonists that promote survival is directly correlated with increased expression of BclxL and downregulation of Bim. Conversely, stimuli that promote B cell apoptosis were observed to induce the loss of HSH2 and BclxL expression and an increase in that of Bim (2). In summary, it was concluded that increased expression of HSH2 might be part of a general pro-survival program that is activated in response to costimulation of B cells.
Studies have also been performed using the WEHI-231 B lymphoma cell line to determine if HSH2 is actively involved in promoting B cell survival. WEHI-231 cells undergo growth arrest and apoptosis in response to BCR cross-linking and have been used extensively as a model to study BCR-induced apoptosis. Retroviral-mediated expression of HSH2 in WEHI-231 cells was found to block apoptosis in response to BCR cross-linking (1). Importantly, HSH2 expression was not observed to globally alter proximal signal transduction events associated with BCR. An analysis of endogenous HSH2 expression in WEHI-231 cells revealed that it is expressed at relatively high levels normally but that its expression level is dramatically reduced by BCR cross-linking; once again supporting the hypothesis that its expression is inversely correlated with apoptosis. The BCR-induced loss of HSH2 expression could be countered by costimulation of WEHI-231 cells through CD40, which has been shown to promote WEHI-231 survival (3–5). Thus, it is possible that CD40-mediated expression of HSH2 is involved in protecting WEHI-231 cells from undergoing apoptosis.
Thus, to date, studies have demonstrated that TNFR and TLR agonists that mediate B cell survival and differentiation also induce upregulation of HSH2 expression. Additionally, it has been shown in both WEHI-231 B lymphoma and splenic B cells that HSH2 expression directly correlates with enhanced survival under various conditions in vitro. Finally, data are provided here demonstrating that endogenous HSH2 expression is highly regulated depending on the maturation/differentiation state of the B cell population examined. These findings suggest that regulation of HSH2 expression may play a critical role in controlling B cell survival and differentiation. Therefore, to address this question, HSH2 transgenic (Tg) mice were generated in which the expression of this adaptor protein is maintained in all B cell subpopulations at a level comparable to that observed in B1 B cells, which exhibit the highest level of endogenous HSH2 expression. Although the B cell compartment was relatively normal in HSH2 Tg mice, they were found to have low serum Ig titers. Moreover, HSH2 Tg mice exhibited significant alterations in both T-dependent as well as T-independent humoral responses. In particular, Ig class switching was largely absent in HSH2 Tg mice. This defect was observed to correlate with impaired B cell responsiveness to BAFF-R- and CD40-mediated signaling. In conclusion, differences in the level of HSH2 expression appear to control the nature of the humoral immune response.
Materials and Methods
Mice
HSH2 transgenic mice were generated by the Transgenic Core Facility at the University of Alabama at Birmingham. The HSH2 transgene construct was generated by cloning the full length HSH2 coding region including an amino-terminal Flag epitope tag into the MCS of VLPEλ2.13, a kind gift from Dr. James Hagman (University of Colorado-Denver, School of Medicine, Denver, CO). C57BL/6 HSH2 Tg or littermate control mice, 10–12 wk of age, were used for experiments as well as isolation of tissues and cells, except where noted. Mice were housed in specific pathogen free conditions in UAB animal facilities, and all procedures were approved by the UAB IACUC.
Antibodies and reagents
For flow cytometry, antibodies specific for B220-peridinin-chlorophyll-protein complex (PerCP)/allophycocyanin, CD4-PerCP/FITC, CD8-FITC, CD21-FITC/PE, CD23-FITC/PE, CD5-FITC/PE, CD11b-FITC/PE, IgM-FITC/PE, IgD-FITC/PE, BP-1-FITC, CD43-Biotin, CD24FITC/PE, CD69-PE, CD86-FITC, as well as the AnnexinV-FITC apoptosis detection kit were purchased from BD Biosciences (San Jose, CA). Anti-IgM-FITC/ allophycocyanin, anti-IgD-FITC, and streptavidin (SA)-PE/ allophycocyanin were purchased from Southern Biotech (Birmingham, AL). Anti Flag-FITC was purchased from Sigma Aldrich (St. Louis, MO). The DNA dye 7AAD was purchased from Invitrogen (Carlsbad, CA). For ELISAs, goat anti-mouse IgM, IgG1, IgG2b, IgG3, IgG’s and IgA, either unlabeled or conjugated to HRP were purchased from BD Biosciences. Purified mouse IgM, IgG1, IgG2b, IgG3, and IgA were purchased from BD Biosciences. For ELISPOT analysis, Multiscreen HTS plates were purchased from Millipore (Billerica, MA).
Tissue isolation and in vitro assays
Splenocytes were isolated by gentle dissociation of the spleen using frosted glass slides. Peritoneal cells were harvested by peritoneal lavage with 5 ml of HBSS (0.4 g/L KCl, 0.06 g/L KH2PO4, 8 g/L NaCl, 0.35 g/L NaHCO3, 0.048 g/L Na2HPO4, pH 7.2). Peripheral blood was collected from tail veins. Bone marrow cells were isolated by flushing femurs with HBSS. Red blood cells were lysed by incubating cells in RBC lysis buffer (10 mM KHCO3, 150 mM NH4Cl, 0.1 mM EDTA) for three minutes on ice. Where indicated, fluorescence activated cell sorting was performed using a MoFlow cell sorter (Dako Cytomation, Glostrup, Denmark). For Western blot analysis of B cell subsets bone marrow cells were stained with antibodies to IgM, IgD, B220, and CD43. Cells were separated into populations defined as B220+, IgM/IgD− (proB cells), and B220+, IgM+,IgD− (preB cells). Splenic populations isolated by FACS were defined as: T1 (B220+, IgMhi, IgDlo, AA4.1+, CD21Lo, CD23−), T2 (B220+, IgMhi, IgDlo, AA4.1+, CD21hi, CD23−), MZ (B220+, IgMhi, IgDlo, AA4.1−, CD21hi, CD23−), Fo (B220+, IgMhi, IgDhi, AA4.1−, CD21Lo, CD23+), and GC (B220+, IgD−, PNA+, FAS+). Peritoneal B cell populations were stained and identified as: B1a (CD11b+, IgM+, B220+, CD5+), B1b (CD11b+, IgM+, B220+,CD5−). For in vitro stimulations B cells were isolated using positive selection by staining with biotin conjugated anti-B220 (Southern Biotech) followed by incubation with anti-biotin super-paramagnetic micro beads (Miltenyi Biotec, Auburn, CA) or Magcellect streptavidin conjugated particles (R&D Systems, Minneapolis, MN) and were cultured in complete RPMI 1640 media supplemented with 5% FBS in a humidity controlled incubator under 5% CO2. Isolated cells were treated with the indicated doses of LPS (Sigma Aldrich), phosphorothioate-modified CpG ODN 1826 (TCCATGACGTTCCTGACGTT) (Invitrogen), recombinant BAFF (Peprotech, Rocky Hill, NJ), recombinant IL-4 (Peprotech) or anti-IgM polyclonal F(ab’)2 fragments (Southern Biotech). Stimulation of cells via CD40 was in response to treatment with the agonistic anti-CD40 mAb 1C10 (provided by Dr. Frances Lund, University of Rochester Medical Center, Rochester, NY). The data presented for B cell proliferation in response to TLR or BCR stimulation conditions represent a 48 h time point whereas stimulation via CD40 alone was assayed at 5 days, unless otherwise noted. Cell viability was determined by the exclusion of the cell impermeable DNA stain 7-Aminoactinomycin D (Invitrogen) and numbers were determined by the inclusion of Flouresbrite beads (Polysciences, Warrington, PA) into the samples analyzed by flow cytometry allowing for viable cell enumeration.
Immunizations and serum antibody titer determinations
For T–dependent immune responses, mice were immunized i.p. with 50 µg of TNP-KLH (Biosearch Technologies, Novato, CA) in 50 µl of PBS absorbed in alum. Peripheral blood was collected by tail bleeds weekly. For experiments involving rechallenge, mice were re-immunized with 25 µg of TNP-KLH. For TI-1 responses, mice were immunized i.p. with 25 µg of TNP-LPS (Biosearch Technologies) resuspended in PBS. For TI-2 immune responses, mice were immunized with 50 µg of TNP-Ficoll (Biosearch Technologies) in PBS. For experiments involving analysis of the germinal center reactions, mice were immunized i.v. with 100 µl of SRBCs (Colorado Serum Company, Denver, CO). For antibody titer determinations, ELISAs were performed using Costar High Binding 96 well plates (Thermo Fisher Scientific Inc., Waltham, MA). TNP-BSA (Biosearch Technologies) was used to detect TNP specific antibodies in serum. Briefly, TNP-BSA resuspended in PBS (5% w/v) was plated overnight at 4°C. The plates were washed three times with ELISA wash buffer (PBS containing 0.05% v/v Tween20). The plates were blocked with 10% BSA resuspended in PBS for one hour at 25°C. The plates were washed three times in ELISA wash buffer. Serum dilutions were added to the plates along with isotype standards and incubated at 37°C for 1 h. The plates were then washed five times in ELISA wash buffer. PBS containing diluted HRP conjugated secondary detection antibodies were then added and incubated for 1 h at 25°C. The plates were then washed seven times in wash buffer. The plates were developed using TMB substrate (Sigma Aldrich) following the manufacture’s instructions and quantitated using a Vmax plate reader (Molecular Devices, Sunnyvale, CA).
Flow cytometric analysis
Cells (1×10⁶/sample) were washed twice in FACS buffer (PBS, 0.01% NaN3+, 0.5% FBS) and then incubated with the appropriate antibody cocktail in 96 well microtiter plates for 30 min on ice. The antibody labeling mixture contained l µg/sample of 24G2 mAb (BD Biosciences) to block Fc receptor binding. After this incubation the cells were washed twice in FACS buffer. When necessary the samples were incubated with secondary reagents for an additional 30 min, followed by three additional washes in FACS buffer. Samples were either analyzed immediately or resuspended in 2% paraformaldehyde in PBS. All steps were performed on ice. For proliferation assays cells were labeled with 5 µM CFSE (Invitrogen).
For BrdU analysis, cells were washed twice in ice cold PBS and treated with 70% EtOH on ice for 20 min. Following a wash in PBS, the cells were resuspended in 1% formaldehyde and 0.01% Tween-20 in PBS and incubated for 30 min at 25°C. The cells were then pelleted and resuspended in 0.15 M NaCl, 4.2 mM MgCl2, and 50 U/ml DNase (Sigma) and incubated at 25°C for 10 min. Cells were centrifuged and washed twice with FACS buffer (PBS containing 1%w/v BSA). Staining was performed for 30 min at 25°C. Cells were washed three times and then either analyzed immediately or resuspended in 2% w/v paraformaldehyde. Samples were analyzed on either a FacsCaliber or LSR II flow cytometer (BD Biosciences) and data were analyzed using FlowJo software (Tree Star, Inc., Ashland, OR).
Western blot analysis
Freshly isolated or cultured B cells were washed twice in ice-cold PBS then lysed in 1% Nonidet P-40 lysis buffer (25 mM HEPES (pH 7.2), 150 mM NaCl, 10 mM EDTA, 1 mM EGTA, 0.1 mM Na3VO4, 50 mM NaF, and 1% Nonidet P-40) including protease inhibitor cocktail set III (Calbiochem, San Diego, CA). Lysates were incubated on ice for 30 min then centrifuged at 13,000 × g for 15 min at 4°C. Lysates were separated by SDS-PAGE and transferred to nitrocellulose membranes (Whatman; Schleicher & Schuell, Piscataway, NJ). Membranes were blocked overnight at 4°C in TBST with 3% nonfat milk, and washed four times with TBST before the addition of the primary Ab. Membranes were incubated for 1 h with the primary Ab diluted into TBST with 1% nonfat milk, and were washed five times with TBST before addition of the appropriate HRP conjugated secondary Ab. After incubation with the secondary Ab for 1 h, membranes were washed five times with TBST. For the phosphotyrosine antibody 4G10 conjugated to HRP, BSA was substituted for milk in all steps. Western blots were visualized using either the ECL West-Pico or West-Femto chemiluminescent substrate (Pierce, Rockford, IL) and subsequent exposure to BioMax film (Eastman Kodak, Rochester, NY). Primary antibodies against NF-κB2 p100/p52, Syk, p-Syk, ERK, p-ERK, JNK, p-JNK, p38, and p-p38 were purchased from Cell Signaling Technologies (Boston, MA). Goat anti-rabbit F(ab’)2-HRP was purchased from Southern Biotech. Anti p-Tyr (4G10)-HRP was purchased from Upstate (Charlottesville, VA). The hybridoma producing 3e1 mAb was generated in the laboratory of Dr. Tong Zhou (Department of Medicine, University of Alabama at Birmingham, Birmingham, AL). 3e1 mAb was produced and purified using standard protocols and conjugated to HRP using the EZlink-HRP conjugation kit (Pierce). For densitometry analysis, Western blot images were scanned using a Microtek Scanmaker 4800 (Santa Fe Springs, CA) and processed using ImageJ (National Institutes of Health, MD).
Quantitative RT-PCR analysis
For real time analysis of germinal center B cells, GCs were isolated by MACS and RNA was isolated using the RNeasy kit (Qiagen, Valencia, CA). The purified RNA was then used to generate cDNA using the High Capacity Reverse Transcription kit (Applied Biosystems Incorporated, Foster City, CA). Real time analysis was performed in an ABI Prism 7900HT using Syber Green PCR Master Mix (ABI) and the following primer pairs (6): Aicda, 5’-AGGGAGTCAAGAAAGTCACG and 5’-CAGGAGGTGGCACTATCTCT; Bcl6, 5’-GCAGTTTAGAGCCCATAAGA and 5’-GTACATGAAGTCCAGGAGGA; IgM (membrane), 5’-TCCTCCTGAGCCTCTTCTAC and 5’-CCAGACATTGCTTCAGATTG; IgM (secreted), 5’-CACACTGTACAATGTCTCCCT and 5’-AAAATGCAACATCTCACTCTG; SpiB, 5’-GAGGACTTCACCAGCCAGACC and 5’-GCGTAGGAGCAACCCCAGCAA; Pax5, 5’-AGAGAAAAATTACCCGACTCCTC and 5’-ATCCCTCTTGCGTTTGTTGGTG; xbp-1, 5’-CCTGAGCCCGGAGGAGAA and 5’-CTCG AGCAGTCTGCGCTG; IgG1 (germline), 5’-GGCCCTTCCAGATCTTTGAG and 5’-GGATCCAGAGTTCCAGGTCACT; IgG1 (post-switch), 5’-CTCTGGCCCTGCTTATTGTTG and 5’-GGATCCAGAGTTCCAGGTCACT; BACH2, 5’-ACTTGGAATGTGAAATACGG and 5’-GTATGAGGACAGGGCAGTAG; Prdm1, exon6-8 5’-CCCTCTGAAGAAACAGAATG and 5’-GCTTGTGCTGCTAAATCTCT; and IRF-4, 5’-GCCCAACAAGCTAGAAAG-3’ and 5’-TCTCTGAGGGTCTGGAAACT-3’ (Integrated DNA Technologies, Coralville, Iowa).
Statistical analysis
Data were analyzed using Prism 5.0 (GraphPad Software). Student t tests were preformed and P-values of less than or equal to 0.05 are shown. Data are displayed as individual data points or the mean ± SEM, unless otherwise indicated noted.
Results
HSH2 is differentially expressed within the B cell compartment
Given that expression of HSH2 is regulated in cells of the B linage in response to a variety of stimuli, including BAFF, CD40L, LPS and CpG, and that HSH2 expression correlates with survival of B cells (Herrin et al. 2005; Herrin and Justement 2006), it was of interest to determine if HSH2 is expressed at different levels in B lineage subpopulations. Cells derived from bone marrow or spleen of six to eight week old C57Bl/6 mice were stained with mAbs to discriminate specific B cell subsets, which were isolated using fluorescence activated cell sorting. Developing B lymphocytes in the bone marrow were subdivided based on the expression of the B cell marker B220 and the cell surface expression of IgM and IgD to facilitate isolation of pro/pre B cells and immature B cells. Splenic B cell populations were sorted based on the expression of B220, IgM, IgD, CD21, CD23, FAS, and PNA binding. B1 cells from the peritoneal cavity were identified based on the expression of B220, IgM, CD5, and CD11b. Lysates derived from these purified subsets were subjected to SDS-PAGE followed by Western blot analysis using a mAb raised against recombinant HSH2 (3e1-HRP). As shown in Figure 1, expression of HSH2 is heterogeneous within the B cell compartment. Notably, HSH2 is not detectable in developing B cell populations from bone marrow. The first stage of B cell development at which HSH2 is expressed is the T1 early transitional stage in the spleen with increased expression in the late transitional T2 population. In mature B cell subpopulations, MZ B cells express higher levels of HSH2 than do follicular (Fo) B cells. Importantly, HSH2 expression is significantly down regulated in B cells participating in the germinal center (GC) response compared to Fo B cells. Finally, both B1a and B1b cell populations express the highest levels of HSH2. These results are striking because they reveal that HSH2 expression is dynamically regulated and that this adaptor protein is expressed at the highest level in B cell subpopulations that are important in the innate/natural humoral immune response, which is associated with the production of IgM isotype antibodies. In contrast, Fo B cells express relatively low levels of HSH2, which is significantly decreased in GC B cells that play a role in the T-dependent humoral response, which is associated with somatic hypermutation and isotype switching. Therefore, it is possible that differential expression of HSH2 may be critical for regulating the qualitative or quantitative nature of the humoral response.
Figure 1. Endogenous HSH2 expression is regulated during B cell maturation and differentiation.

A. B cell subpopulations were isolated by FACS using defined cell surface markers for the populations indicated. Cell lysates from 4×10⁵ cell equivalents were separated by SDS-PAGE, transferred to nitrocellulose membranes and blotted using the anti-HSH2 mAb 3e1 coupled to HRP. The blot was stripped and reprobed with anti-β-actin as a loading control. Three exposures of the HSH2 blot are shown. The blot depicted is representative of two independent experiments. B. The relative expression of HSH2 in B cell subpopulations was quantitated by densitometry. Densitometric values for HSH2 were divided by densitometric values for actin to normalize HSH2 expression. Relative HSH2 expression was calculated by dividing the ratio for HSH2/actin in each B cell subpopulation by the value obtained from Fo B cells, which was set as the reference of 1.
Generation of HSH2 transgenic mice
Because HSH2 expression is dynamically regulated in specific B cell subpopulations that mediate distinct aspects of the humoral response, HSH2 Tg mice were generated in which HSH2 transgene expression is controlled by the λ light chain promoter/enhancer (7). The goal of these studies was to enforce uniform, high level expression of HSH2 throughout the B lineage at a level comparable to innate/natural B cells to assess the phenotypic and functional effects that this would have. HSH2 expressed under the control of the transgenic construct was tagged on the carboxy-terminal end with the Flag epitope to facilitate detection and isolation of the transgenic protein. Studies were performed in WEHI-231 cells to assess the function of Flag-taggged HSH2 compared to untagged HSH2 in terms of preventing BCR-mediated apoptosis as previously described (1). As shown in Supplemental Figure 1, Flag-tagged and untagged HSH2 exhibited comparable biological function in terms of protecting WEHI-231 cells from BCR-induced apoptosis. Thus, inclusion of the Flag epitope tag on the C-terminus of HSH2 does not alter its function (Fig. S1). Analysis of founder mice demonstrated restricted expression of the Flag-tagged HSH2 transgene in cells of the B lineage (Fig. 2A). Further analysis of B cell subpopulations in the bone marrow of the HSH2 Tg mice revealed that expression of the HSH2 transgene can be detected in pre-B cells and that the level of transgene expression increases significantly in immature B cells, possibly due to increased transcriptional activity of the transgene promoter/enhancer (Fig. 2B). Recirculating, Fo B cells exhibit lower transgene expression compared to pre-B cells and immature B cells (Fig. 2B), in line with the decreased level of HSH2 expression in Fo B cells in normal mice (Fig. 1). Subsequent experiments were performed to assess the total level of HSH2 expression in Tg mice compared to endogenous expression of HSH2 in control mice. Splenic B cells isolated from the HSH2 Tg mice express HSH2 at a level that is comparable to that normally observed for B1 cells based on intracellular staining with anti-HSH2 mAb (3e1, Fig. 2C). Thus, HSH2 expression in all B cell subpopulations in the Tg mice (i.e. T1, T2, Fo, GC and MZ) approximates endogenous HSH2 expression observed in B1a or B1b B cells. The exception is that B1 cells from Tg mice exhibit higher levels of HSH2 expression than normal B1 cells and this could be due to enhanced transcription driven by the λ light chain promoter/enhancer or due to enhanced stability of the HSH2 protein itself (Fig. 2C).
Figure 2. Expression of the HSH2 transgene is observed in B lineage cells in the bone marrow and periphery.

A. Cells isolated from the peripheral blood of either HSH2 Tg or littermate control mice were analyzed for the expression of the surface marker B220 and intracellular expression of the Flag epitope. B. Relative expression of the HSH2 transgene was analyzed during B cell development. Bone marrow cells from either HSH2 Tg or littermate control mice were stained with antibodies specific for the indicated markers and the Flag epitope. The histograms depict the relative difference in HSH2 transgene expression during B cell development. C. Comparison of HSH2 expression in B cell populations isolated from HSH2 Tg and littermate control mice. Cells were isolated from the spleen and peritoneum and stained with reagents to discriminate B cells by flow cytometry. Cells were then permeabilized and stained with the anti-HSH2 mAb 3e1 to detect total HSH2 expression (endogenous plus transgenic). The histogram depicted is representative of 4 independent experiments.
Constitutive expression of HSH2 protects murine B lymphocytes from BCR-mediated apoptosis in vitro
Previous work from our laboratory has demonstrated a correlation between the expression of HSH2 and survival of murine B cells (2). To determine if constitutive expression of HSH2 in splenic B lymphocytes was sufficient to attenuate apoptosis in response to BCR ligation, B lymphocytes were isolated from the spleens of HSH2 Tg animals or littermate controls. These cells were incubated either in medium alone or in the presence of polyclonal F(ab’)2 fragments of goat anti–mouse IgM for the indicated times (Fig. S2A). The B cells were stained with annexinV and 7AAD and were analyzed by flow cytometry to quantitate the number of viable cells in the culture. HSH2 Tg B cells display a slight survival advantage when cultured in medium alone for 24 to 48 h compared to control B cells. In contrast, stimulation of control B cells with F(ab’)2 fragments of anti-IgM (5 µg/ml) in the absence of costimulatory signals results in significant apoptosis at 24 and 48 h, whereas the HSH2 Tg B cells were resistant to BCR-induced apoptosis at either time point. These findings indicate that, as was seen in WEHI-231 cells (1), constitutive expression of HSH2 is sufficient to attenuate the apoptotic response following BCR ligation in vitro.
Because HSH2 is an adaptor protein it was possible that the failure of HSH2 Tg B cells to undergo apoptosis in response to BCR stimulation was due to attenuation of the signal transduced. To address this possibility, signaling parameters downstream of the BCR were examined in HSH2 Tg B cells compared to littermate control cells. Western blots were performed to address both membrane proximal and distal signaling events following BCR ligation. No differences were observed with respect to global protein tyrosine phosphorylation, or activation of the protein tyrosine kinase Syk, suggesting that proximal signaling events that occur within minutes of BCR-mediated activation were unaltered in B cells isolated from HSH2 Tg animals (Fig. S2B). Additionally, MAPK activation was monitored to investigate the effect of constitutive HSH2 expression on more distal signaling events. As observed in the WEHI-231 B cell line transduced with HSH2, the only notable difference between HSH2 Tg B cells and control B cells is a slight enhancement of p38 activation accompanied by a pronounced increase in both the magnitude and duration of JNK activation (Fig. S2B). These data suggest that it is not a failure to propagate BCR-mediated signals that is responsible for the resistance of HSH2 Tg B cells to BCR-induced apoptosis. Moreover, BCR cross-linking was sufficient to upregulate expression of the activation markers CD86 and CD69 (Fig. 9A) and to drive proliferation of HSH2 Tg B cells in conjunction with costimulatory signals (Fig. 9B) in a manner comparable to B cells derived from littermate controls. Collectively these data suggest that BCR signaling in HSH2 Tg B cells is intact and that the attenuation of apoptosis observed in vitro is not due to attenuation of the intensity of the BCR signal generated.
Figure 9. The distal functional response to TNF family receptor-mediated signaling is impaired in B cells isolated from HSH2 Tg mice.

A. Analysis of activation marker expression. Splenic B cells isolated from HSH2 Tg or control mice were cultured for 24 h in the presence of the indicated stimuli. Flow cytometry was preformed to analyze the expression of the activation markers CD69 and CD86. B. Analysis of HSH2 Tg and control B cell proliferation. Splenic B cells were isolated from HSH2 Tg or control mice and were loaded with CFSE. Cells were cultured with the indicated stimuli and analyzed for proliferation by flow cytometry. The percent of B cells having undergone cell divisions are shown. C. Kinetic analysis of B cell proliferation in response to anti-CD40 mAb. CFSE loaded B cells from HSH2 Tg or control mice were incubated in the presence of 1C10 mAb at the concentrations and times indicated. The percentage of B cells undergoing one or more rounds of cell division are depicted. D. Analysis of B cell viability in response to anti-CD40 mAb. Cell viability was determined by the exclusion of the cell impermeable DNA stain 7-Aminoactinomycin D and cell numbers were determined by the inclusion of Flouresbrite beads. Samples were analyzed by flow cytometry for viable cell enumeration. E. HSH2 Tg B cells are refractory to rescue by BAFF. Splenic B cells isolated from HSH2 Tg (Red) or control mice (Blue) were cultured in complete media in the absence or presence of recombinant BAFF at the indicated concentrations. After 48 h of culture, cell viability was determined by the exclusion of the 7AAD as determined by flow cytometry. The data depicted (A–E) are representative of 3 independent experiments.
HSH2 Tg mice display a reduction in the T2 and MZ subpopulations and exhibit impaired B cell maturation
The finding that HSH2 expression in WEHI-231 cells (1) and in splenic B cells isolated from HSH2 Tg animals confers resistance to BCR-mediated apoptosis in vitro suggested that constitutive HSH2 transgene expression may promote aberrant expansion of the B cell compartment in vivo due to abrogation of negative selection and activation of autoreactive B cells. However, characterization of the relative frequency of B cells versus T cells in HSH2 Tg mice compared to littermate control animals revealed no difference in the proportion of B cells in the periphery when mice were analyzed at the ages of 10 weeks, 3, 6 and 8 months (data not shown). Thus, preferential expansion of the B cell compartment was not observed as might be predicted based on the anti-apoptotic activity of HSH2 in vitro. The conclusion from this general analysis was that HSH2 does not function as an anti-apoptotic regulatory protein in vivo.
Because the λ promoter/enhancer used to drive HSH2 transgene expression causes the protein to be expressed early in B cell development, progenitor B cell populations were examined revealing a modest increase in the number of cells in Hardy fraction C’ with a slight reduction in fractions D and E (8) (Fig. 3A). However, these differences were not found to be significant. The number of recirculating B cells in the bone marrow was unaffected. In the periphery, the absolute number of B lymphocytes was observed to be unaffected in both the peripheral blood as well as lymph nodes (Fig. 3B and C, respectively). The B1 compartment was normal with respect to both B1a and B1b cells compared to littermate control mice (Fig. 3D). No significant changes in the number of CD4+ or CD8+ T cells was observed in any of the tissues examined (Fig. 3B–E). Although HSH2 transgene expression had little or no effect on the total number of B lymphocytes in the spleen based on staining with B220, there was a selective loss of B cells expressing high levels of IgM and low levels of IgD in HSH2 Tg mice compared to controls (Fig. 3F). Further subdivision of these cells with the markers CD21, CD23, and IgM, revealed a selective loss of both the late transitional T2 and MZ B cell populations, whereas the early transitional T1 cells were present in equivalent numbers in HSH2 Tg mice compared to control animals (Fig. 3F).
Figure 3. Expression of the HSH2 transgene leads to a loss of T2 and MZ B cells.

Cells were isolated from the tissues of HSH2 Tg (White) or littermate control (Black) mice as indicated, after which they were stained with Abs against selected cell surface markers to identify the lymphocyte subsets depicted. For the analysis of developing B cell subpopulations in the bone marrow, the Hardy fractionation scheme was used and the relevant fractions are indicated in parentheses. The results shown are derived from ten animals per group. Error bars represent 95% confidence intervals.
The observation that T2 B cells were significantly reduced in number in HSH2 Tg mice suggested that there could be a selective loss of cells at this stage due to constitutive expression of HSH2. To further examine this possibility, mice between the ages of 3–10 weeks were examined to assess the relative number of B cells in the peripheral blood. As shown in Figure 4A, HSH2 Tg mice exhibited a delay in the appearance of B cells in the periphery between 3 and 6 weeks of age. By 10 weeks of age, HSH2 Tg mice were found to have normal frequencies of B cells in the blood when compared to control mice. This apparent delay in the establishment of the peripheral B cell pool, coupled with the selected loss of T2 and MZ B cell populations in adult animals suggested a failure in the maturation of newly formed B cells. To specifically address the maturation of transitional B cells in HSH2 Tg mice, BrdU labeling experiments were conducted. For these experiments five-week-old mice were used, as the developmental delay in the peripheral B cell population is more pronounced in younger mice. HSH2 Tg or littermate control mice were fed 0.8 mg/ml BrdU in their drinking water for one week. After a week the animals were sacrificed and lymphocyte populations in their spleens and lymph nodes were analyzed by intracellular staining and flow cytometry to detect the incorporation of BrdU. The number and percentage of total B lymphocytes or the BrdU+ fraction are shown in Figure 4B. As noted previously, the absolute number and percentage of B lymphocytes is lower in HSH2 Tg animals than in controls. A reduction in the total number of BrdU+ cells was also noted in HSH2 Tg animals. The loss of BrdU+ cells was much more severe in lymph nodes than in the spleen. To visualize the relative rate of B cell maturation in these experiments the absolute number of BrdU+ B cells present in the lymph nodes was divided by the absolute number of BrdU+ B cells found in the spleen to obtain a ratio that reflects the percentage of B cells that undergo maturation in the spleen and exit into the circulation, as depicted in Figure 4C. In littermate control mice, the number of BrdU+ B cells in the lymph nodes was equal to five percent of the total number of BrdU+ B cells in the spleen, indicating that these cells had emerged from the bone marrow and migrated to the spleen where they underwent maturation and subsequently entered the circulation. In contrast, a similar analysis of HSH2 Tg mice revealed that the number of BrdU+ B cells in the lymph nodes was equal to only one percent of the total BrdU+ B cells in the spleen, indicating that the rate of B cell maturation in HSH2 Tg animals is roughly one fifth that of controls. Collectively, these data suggest that the expression of the HSH2 transgene results in a decreased rate of B cell maturation due to loss of T2 B cells in the spleen resulting in a delay in the kinetics for establishing the peripheral B cell pool. The observation that T2 and MZ B cells are selectively affected by HSH2 transgene expression and that these subpopulations are more dependent on BAFF for their survival suggests that the functional response to BAFF-R-mediated signaling may be affected by increased HSH2 expression.
Figure 4. Expression of the HSH2 transgene promotes rapid turnover of T2 B cells in the periphery.

A. Percentage of peripheral blood B lymphocytes as a function of age. B cells isolated from HSH2 Tg (White) or littermate control (Black) mice at the indicated ages were analyzed by flow cytometry to determine the percent B lymphocytes present in peripheral blood. B. BrdU analysis of B cell maturation. HSH2 Tg and littermate control mice 5 weeks of age were fed BrdU in water (0.8 mg/mL) for one week. BrdU incorporation in B lymphocytes present in the spleen or lymph nodes (pooled inguinal, axillary, and brachial) were assessed by flow cytometry. The absolute numbers and percentages of total B lymphocytes and BrdU+ B lymphocytes are shown. C. The relative rate of B cell maturation is depicted as a ratio of the absolute number of BrdU+ B cells present in lymph nodes divided by those in the spleen. The data are representative of 3 independent experiments.
Constitutive HSH2 expression in the B cell lineage attenuates the humoral immune response
Because HSH2 is upregulated in splenic B cells in response to TNF family receptor- and TLR-mediated signal transduction via an NF-κB-dependent mechanism (2) and signaling via these receptors plays an important role in B cell differentiation, it was of interest to further explore the potential effects that constitutive expression of HSH2 might have on the humoral immune response. Initial experiments were performed to measure serum Ig titers in HSH2 Tg and control mice. Analysis of serum Ig titers revealed that HSH2 Tg mice exhibit a significant decrease in the serum concentration of IgM compared to control mice (Fig. 5). Additionally, it was observed that constitutive expression of HSH2 impairs the production of class switched Ig isotypes including IgG1, IgG2b and IgG3, and in some instances, the suppressive effect was more pronounced (Fig. 5). In contrast, constitutive expression of HSH2 was not observed to cause a significant reduction in the production of serum IgA, which exhibited only a slight decrease compared to control animals (Fig. 5). Thus, HSH2 expression appears to exert a global effect on the differentiation of B cells into antibody secreting plasma cells and this effect is more pronounced in the case of class-switched isotypes.
Figure 5. Expression of the HSH2 transgene is associated with a general decrease in serum Ig titers.

Peripheral blood was collected from HSH2 Tg and littermate control animals and the concentrations of serum Ig for the indicated isotypes was determined by ELISA. The graphs depict absolute values for serum Ig titers derived from 24 age and sex matched animals per group with the exception of IgA in which case the analysis was conducted using 18 animals per group.
Experiments were performed to assess both the T-dependent and T-independent humoral immune response in HSH2 Tg mice. The T-dependent antigen TNP-KLH in alum was used to immunize HSH2 Tg and control mice and TNP specific serum Ig titers were measured on days 7, 14 and 21 by ELISA. As can be seen in Figure 6A, constitutive HSH2 expression decreased the production of TNP-specific IgM by approximately 50% over the first 21 days. In contrast, the production of class switched isotypes specific for TNP was almost completely abolished by the expression of HSH2. To monitor the effect of constitutive HSH2 expression on the T-dependent memory response, mice were reimmunized with TNP-KLH on day 28 and TNP-specific serum Ig titers were monitored on days 35 and 42. As was the case for the primary response, HSH2 expression was observed to significantly inhibit the production of TNP-specific IgM Ab by approximately 50–70% compared to control mice. The production of class switched Abs was suppressed to an even greater extent (80–90%, Fig. 6A). To confirm that the decrease in production of TNP-specific Abs was due to a block in B cell differentiation into Ab-secreting plasma cells, ELISPOT assays were performed to quantitate the number of IgM- and IgG-secreting plasma cells in the spleens of control and HSH2 Tg mice immunized with TNP-KLH. ELISPOT analysis revealed that spleens from HSH2 Tg mice contain fewer Ab-secreting cells for both IgM and IgG when compared to control mice although only the decrease in IgG secreting cells was found to be significant (Fig. 6B). This supports the conclusion that constitutive expression of HSH2 blocks B cell differentiation or the survival/persistence of plasma cells in the spleen, or both.
Figure 6. The HSH2 transgene attenuates the humoral response against T-dependent antigen.
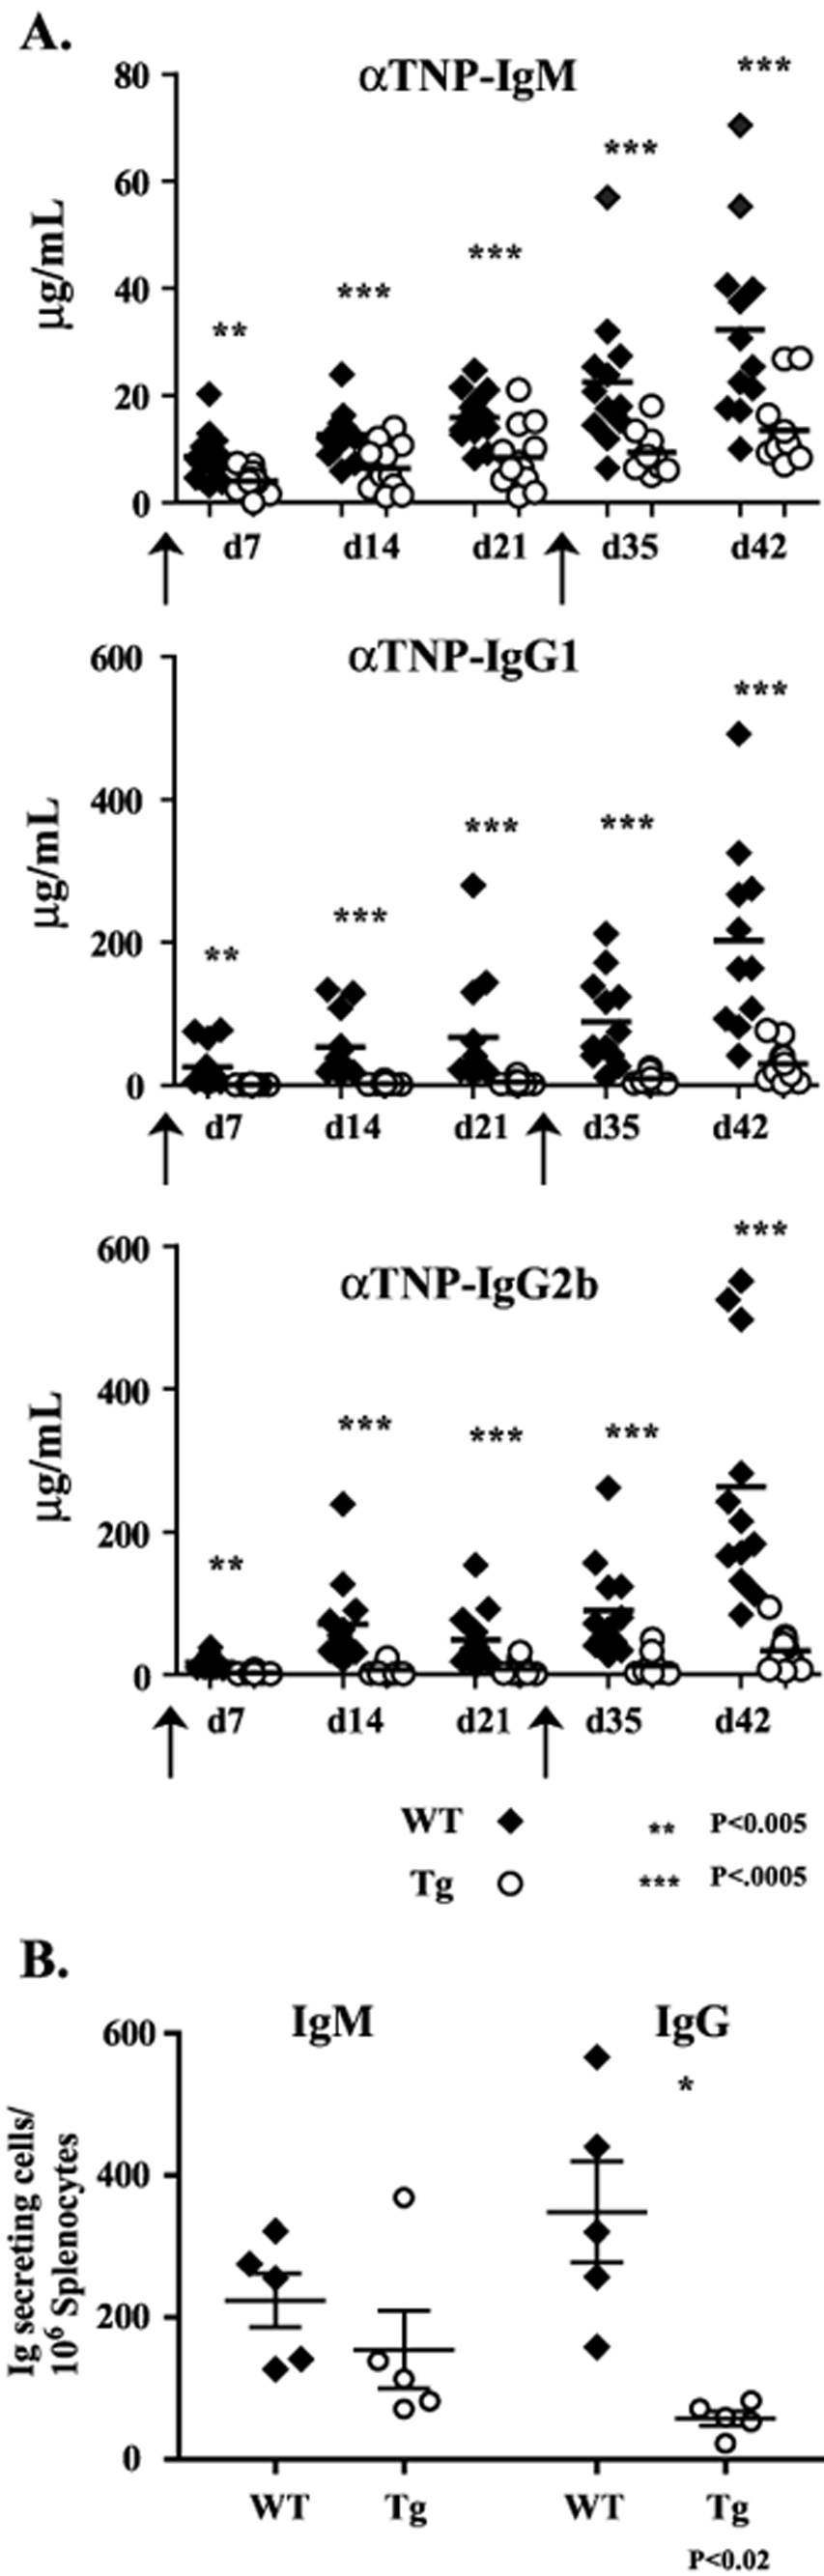
A. Analysis of the TNP specific antibody response following immunization of HSH2 Tg and littermate control mice with the T-dependent antigen TNP-KLH. Twelve mice of the indicated genotype were immunized i.p. with 50 µg of TNP-KLH absorbed in alum. The mice were bled at the indicated time points and the TNP specific antibody response for the indicated isotypes was measured by ELISA. On day 28 the mice were re-challenged with 25 µg of TNP-KLH absorbed in alum and the memory response was followed for two additional weeks. B. Analysis of the generation of antibody secreting cells following immunization with TNP-KLH. HSH2 Tg or littermate control mice (5/group) were immunized i.p. with 50 µg of TNP-KLH absorbed in alum. Ten days following immunization spleen cells were harvested and analyzed to detect antibody-secreting cells by ELISPOT. The numbers of IgM and IgG secreting cells are shown.
Subsequently, both the T-independent Type I (TI-1) and Type II (TI-2) response were analyzed in HSH2 Tg mice to further explore the potential functional effects that constitutive HSH2 expression has on the humoral immune response. Mice were immunized with TNP-LPS to monitor the TI-1 response after which serum IgM and IgG3 levels were monitored on days 5 and 10. Whereas the concentration of both TNP-specific serum IgM and IgG3 were significantly decreased in HSH2 Tg mice compared to controls, the production of IgM was less severely affected than that of IgG3 (Fig. 7A). Immunization of HSH2 Tg mice with the TI-2 Ag TNP-Ficoll was found to result in a decreased response similar to that observed for immunization with a TI-1 Ag when compared to control mice (Fig. 7B). Thus, it is apparent that constitutive expression of HSH2 exerts a significant effect on the B cell response to T-dependent as well as T-independent Ag, suggesting that HSH2 functions downstream of key receptors and their associated signaling pathways that are involved in regulating B cell class switching or differentiation, or both.
Figure 7. The HSH2 transgene attenuates the humoral response against T-independent type 1 and 2 antigens.

A. Analysis of the TNP specific response of HSH2 Tg and littermate control mice after immunzation with the TI-1 antigen TNP-LPS. The concentrations of TNP specific IgM and IgG3 were determined by ELISA at the indicated times after i.p. administration of 25 µg of TNP-LPS. B. TNP specific antibody response was measured by ELISA 5 days after i.p. immunization with 50 µg of the TI-2 antigen TNP-Ficoll. The data are representative of 3 independent experiments
Constitutive HSH2 expression attenuates the germinal center response
Given the significant effects that constitutive expression of HSH2 has on the differentiation of B cells into Ab secreting plasma cells in vivo, we analyzed the GC response in HSH2 Tg versus littermate control animals. HSH2 Tg mice or littermate controls were injected intravenously with sheep red blood cells (SRBC) to generate splenic GCs. The frequency and numbers of GC B cells were analyzed by flow cytometry at various time points following immunization. In agreement with the observation that constitutive HSH2 expression attenuates the T-dependent humoral response, HSH2 Tg mice generated reduced numbers of GC B cells following immunization (Fig. 8A). As shown in Figure 8B, the kinetics of the overall GC response is similar between HSH2 Tg mice and littermate control mice, however, HSH2 Tg mice exhibit a reduced number of B cells participating in the GC response at every time point between day 5 and 14. To determine if this is due to a difference in the proliferation of GC B cells in HSH2 Tg versus control mice, BrdU labeling was performed. HSH2 Tg and control mice were immunized with sheep red blood cells, and at day seven following immunization the mice were injected with 1mg of BrdU. Six hours after administration of BrdU, the mice were sacrificed and their GC B cells were analyzed by flow cytometry to detect the incorporation of BrdU. As shown in Figure 8C, the rates of proliferation were identical as indicated by the frequency of GC B cells staining positive for BrdU.
Figure 8. Expression of the HSH2 transgene does not significantly affect the global GC response.

A. Flow cytometric plot of GC B cells in HSH2 Tg or littermate control mice ten days after i.v. immunization with SRBCs. The percentage of GC B cells within the total splenocyte population is shown. B. Determination of the absolute numbers of GC B cells following i.v. immunization with SRBCs. Mice were immunized and at the indicated time points splenocytes from control (Black) or HSH2 Tg (White) mice were analyzed to determine the absolute number of GC B cells. Error bars represent 95% confidence intervals of three to five mice per group. C. Analysis of GC B cell proliferation. Seven days following i.v. immunization with SRBCs, HSH2 Tg and littermate control mice were administered 1.0 mg of BrdU i.p. Six hours after BrdU administration GC B cells were analyzed for the incorporation of BrdU. GC B cells were identified as B220+, PNA+, and FAS+ cells. The histograms shown were gated on B220+ PNA+ cells (left). The percentage of GC B cells is depicted in the graph (right). D. Quantitative RT-PCR analysis of transcripts associated with GC development. GC B cells were isolated from HSH2 Tg or littermate control mice (3 mice per group). Seven days after i.v. immunization with SRBCs GC B cells were isolated by magnetic depletion of CD43+, CD11b+, and IgD+ cells. cDNA generated from RNA isolated from GC B cells was analyzed using quantitative RT-PCR to determine the relative abundance of the transcripts indicated. The data are representative of 2 independent experiments
The constitutive expression of HSH2 results in an apparent reduction in B cells differentiating into antibody secreting cells, and despite having fewer GC B cells, the GC reaction in HSH2 Tg mice was largely intact. Two possibilities could explain the attenuation of B cell terminal differentiation; increased apoptosis of GC B cells or a block in their differentiation, or both. Experiments were conducted in an attempt to determine if there are differences in the expression of key transcriptional regulatory proteins involved in the transition from GC B cell to plasmablast to terminally differentiated plasma cell. RNA was isolated from purified GC B cells derived from either control or HSH2 Tg animals and subjected to real time analysis to detect a variety of transcripts with known roles in the differentiation of GC B cells (Fig. 8D). The relative abundance for most of the transcripts analyzed was identical between HSH2 Tg and control GC B cells. Of note, transcripts encoding Bcl6 and Pax 5, which enforce a GC B cell phenotype were not elevated. Additionally, the transcript for AID, which is critical for mediating class switch recombination was not significantly decreased in abundance (9), and Irf4, which regulates both class switching as well as terminal differentiation (6), depending on its relative level of expression, was not significantly altered in HSH2 Tg B cells. Of note, however, was the observation that the level of the transcript encoding Prdm1 (Blimp-1) was decreased almost two-fold in HSH2 Tg mice, whereas the transcript for Bach2 exhibited a two-fold increase in its abundance compared to control B cells. Because Bach2 is involved in repressing expression of Blimp-1 and Blimp-1 in turn is critical for driving differentiation from the GC B cell phenotype to the plasmablast/plasma cell phenotype (10), these data may reflect a block in differentiation of GC cells into antibody secreting cells. Alternatively, these findings might correspond to a reduction in the number of early plasma cells present in samples from HSH2 Tg mice due to increased apoptosis leading to a preferential enhancement of B cells with a GC phenotype. However, if this were true, one might expect to see a similar decrease in the level of Xbp1 and an increase in Pax5 and Bcl6, which is not the case.
HSH2 selectively attenuates the B cell response to signals delivered via CD40 and BAFF-R
Given the unexpected and severe phenotype displayed by HSH2 Tg mice, it was hypothesized that these effects may be due to altered responsiveness of Tg B cells to signals delivered via TNF family receptors. Signal transduction via the TNF family receptors CD40 and BAFF-R has been shown to be critical for maintenance of normal B cell homeostasis as well as activation and differentiation. BAFF is a survival factor required by all bone marrow derived B2 lymphocytes (11, 12), whereas the CD40–CD154 axis is crucial for the T-dependent humoral response (13–16). Experiments were performed to assess the response of control and HSH2 Tg B cells in response to BAFF-R and CD40 mediated signals including receptor proximal, as well as distal readouts. As depicted in Figure 9A, HSH2 Tg B cells are responsive to CD40 and BAFF-R derived signals when early events are assayed. Stimulation with LPS, CPG, anti-IgM Ab, anti-CD40 mAb, or recombinant BAFF resulted in nearly identical expression of the activation markers CD86 and CD69 on HSH2 Tg and control B cells. These data suggest that receptor proximal signaling is unaffected by HSH2 expression. This conclusion is supported by Western blot experiments to monitor activation of the MAP kinases ERK, JNK, and p38 in response to stimulation of B cells via CD40 (data not shown). Similarly, activation of control or HSH2 Tg B cells via BAFF-R or CD40 induced similar activation of the non-canonical NF-kB pathway based on processing of p100 to p52 (data not shown). Next, experiments were performed to assay the proliferation of control versus HSH2 Tg B cells in response to the TLR ligands LPS and CPG, as well as activating antibodies against CD40 or recombinant BAFF, alone or in combination with anti-IgM. HSH2 Tg B cells failed to proliferate in response to mAb directed against CD40 (Fig. 9B). The failure to proliferate in response to anti-CD40 mAb was observed at multiple time points and in response to a range of mAb concentrations (Fig. 9C). However, this effect is not a general proliferative defect as treatment with LPS or CPG resulted in equivalent proliferation of HSH2 Tg B cells when compared to B cells from control mice (Fig. 9B). Furthermore, inclusion of anti-IgM Ab is sufficient to drive proliferation of HSH2 Tg B cells at a level comparable to control B cells in combination with anti-CD40 mAb or BAFF. Importantly, the failure of HSH2 Tg B cells to proliferate in response to CD40-mediated signaling is not due to increased B cell apoptosis. As shown in Figure 9D, HSH2 Tg B cells did not exhibit increased cell death in response to different concentrations of anti-CD40 mAb over time. Although not sufficient to drive the proliferation of B lymphocytes, treatment with BAFF in the absence of additional stimuli results in the increased survival of these cells in culture. Inclusion of 1 ng/ml of BAFF in control B cell cultures resulted in enhanced survival compared to medium alone (Fig. 9E). B cells isolated from HSH2 Tg animals, however, are refractory to rescue from apoptosis by the inclusion of BAFF in culture (Fig. 9E). Collectively these data suggest that constitutive expression of HSH2 affects that nature of the distal B cell response to stimulation via TNF family receptors, which in turn affects B cell survival and differentiation. Importantly, this is not due to complete abrogation of TNF receptor-mediated signaling as receptor-proximal events, including effector protein activation and the upregulation of activation marker expression are normal.
Discussion
Previous studies have demonstrated that HSH2 is inducibly expressed by B cells in response to TNF family receptor- and TLR-mediated signal transduction (2). Additionally, expression of HSH2 was observed to correlate with enhanced survival of B lymphocytes in vitro and it was shown that HSH2 could also protect the WEHI-231 B cell line from undergoing BCR-induced apoptosis (1). Thus, it was concluded that HSH2 might be involved in regulating survival and/or differentiation of B cells. To further explore this question, studies were performed to assess the relative level of endogenous HSH2 expression in B cell subpopulations at the protein level. It was found that HSH2 is not expressed during B cell development in the bone marrow, but that its expression is first detected in transitional B cells in the periphery. Of note, HSH2 expression is relatively low in follicular B cells and is further decreased in GC B cells. In contrast, HSH2 is highly expressed in innate/natural B cell subpopulations, including MZ B cells and B1a/B1b B cells.
Because HSH2 expression is highly regulated in different B cell subpopulations, HSH2 Tg mice were created to determine the effect that constitutive expression of HSH2 has on B cell survival and differentiation. Analysis of HSH2 Tg mice demonstrated a profound abrogation of Ig class switching in response to both T-dependent as well as T-independent Ag. When viewed in the context of the regulated expression of endogenous HSH2, it can be concluded that there is an inverse correlation between elevated HSH2 expression and Ig class switching, suggesting that HSH2 functions as a rheostat to control the degree of class switching that takes place in specific B cell subpopulations. Indeed, HSH2 expression is significantly downregulated in GC B cells, which undergo extensive class switching, whereas it is highly expressed in MZ B cells and B1 B cells, which predominantly make IgM. Thus it can be concluded that high level HSH2 expression blocks the class switching process or survival of class switched B cells, or both. The exception to this is the production of serum IgA, which is relatively unaffected by constitutive high-level expression of HSH2.
Additionally, it appears that HSH2 may secondarily regulate aspects of B cell terminal differentiation because the total amount of IgM produced in response to antigenic challenge is decreased in HSH2 Tg mice. However, the fact that HSH2 Tg animals have near normal levels of circulating IgA and secrete similar amounts of IgM and IgG in response to stimulation in culture (data not shown) suggests that B cells in these animals do not exhibit a global block in terminal differentiation as is observed in mice with experimental deletion of important differentiation factors such as XBP-1 or Blimp-1 (10, 17). Analysis of the GC reaction revealed that the rate of B cell proliferation within GCs in HSH2 Tg mice is comparable to that in control animals, and that affinity maturation is normal as evident by the production of high affinity antibodies (data not shown), suggesting that although smaller in magnitude the GC response in HSH2 Tg mice is relatively intact. This is further supported by the fact that the transcriptional profile of GC B cells isolated from HSH2 Tg mice is similar to GC B cells isolated from control animals, with the exception of a reduction in message levels for Prdm1 (Blimp-1) and an increase in message encoding the Blimp-1 repressor BACH2. Regardless, the number of IgM and to a greater extent IgG secreting cells generated in response to challenge with a T-dependent antigen is markedly lower in HSH2 Tg mice compared to control animals. Collectively these data suggest that constitutive expression of HSH2 in cells that normally downregulate this adaptor negatively affects the terminal differentiation of GC B cells into antibody secreting cells or their survival, presumably through alteration of the cellular response to costimulatory signals. The same is likely to be true for B cells involved in the T-independent humoral response in view of findings obtained in this study.
Finally, based on the analysis of HSH2 Tg mice, it appears that alterations in the level of HSH2 expression can affect the survival of B cells in response to BAFF as T2 and MZ B cell numbers are significantly decreased. Interestingly, analysis of endogenous HSH2 expression revealed that B1 B cells express much higher levels of HSH2 than do other B cell subpopulations and these cells are less dependent on BAFF for survival than are B2 B cells (18). Taken together, these data strongly suggest that alterations in the level of HSH2 expression may affect the B cell response to signals transduced via CD40 and BAFF-R.
Previous studies investigating the role of HSH2 in T cells demonstrated an inhibitory effect on the production of IL-2 in response to TCR and CD28 signaling (19). It was shown that HSH2 exerts the greatest effect on an IL-2 promoter comprised of the CD28 response element in conjunction with the AP-1 binding site (RE/AP1) and that the SH2 domain of HSH2 is critical for inhibition of IL-2 production (20). Studies conducted on HSH2-deficient mice support this observation, in that T cells isolated from these animals display enhanced IL-2 production and proliferation in response to TCR and CD28 stimulation in culture (19). Analysis of TCR-mediated signaling in HSH2 deficient T cells revealed minimal effects on proximal signaling events with the exception of enhanced p38 activation. CD28-mediated signaling was not extensively analyzed in that study (19). The functional relationship of these studies to work performed on cells of the B lineage is not clear at the present time. We have observed that expression of HSH2 at the protein level in T cells is equal to or less than the amount present in GC B cells (data not shown). Moreover, unlike B cells, we do not observe any change in the level of HSH2 expression associated with activation of T cells in response to a range of agonist. Finally, HSH2 expression in T cells does not vary in connection with the analysis of distinct T cell subpopulations as is the case for B cells. Thus, it remains to be determined whether HSH2 exerts a similar functional role in these two lineages
The mechanism by which HSH2 controls Ig class switching remains to be fully elucidated. Studies strongly suggest that HSH2 does not globally affect BCR-mediated signal transduction. Of the early signaling events examined, the only one that appears to be affected in the WEHI-231 B cell line and HSH2 Tg B cells, is enhanced JNK activation (1). Thus, it is not likely that HSH2 exerts its effects on Ig class switching by altering BCR signaling in a substantive manner. Because constitutive expression of HSH2 in vivo affects the survival of B cell subpopulations that are highly dependent on BAFF (T2 and MZ B cells) as well as Ig class switching, which is dependent on CD40 signaling, studies were performed to determine if the response to signaling via these TNF family members was affected. Indeed, it was observed that proliferation in response to CD40-mediated signaling and survival in response to BAFF-R-mediated signaling were impaired in HSH2 Tg B cells. In contrast, HSH2 Tg B cells exhibited normal proliferation in response to the TLR agonists CpG and LPS. Thus, HSH2 appears to selectively affect the B cell response to TNF family receptor signaling.
Receptors in the TNF family that do not contain death domains in their cytoplasmic tails, including CD40 and BAFF-R, utilize members of the TRAF family of adaptor proteins for signal transduction. TRAFs 1, 2, 3, 5 and 6 are recruited to the cytoplasmic tail of CD40 (21), whereas only TRAFs 2 and 3 have been reported to bind BAFF-R (22, 23). It is this differential recruitment of TRAF molecules that is responsible for the differences in NF-κB activation driven by these two receptors, as BAFF-R signaling results in activation of the non-canonical NF-κB pathway (24), whereas CD40 signaling drives activation of both the canonical and non-canonical pathways (25). With the exception of the TRAFF molecules, few adaptor proteins have been shown to be involved in the cellular response to signals delivered via the TNF family of receptors. One exception is Act1, which through a direct interaction with TRAF 2 and 3 has been shown to function as a negative regulator of BAFF-R and CD40 mediated signals (26). However, unlike Act1, HSH2 does not contain domains to facilitate interactions with TRAF proteins that bind to CD40 or BAFF-R. This difference suggests that the effects observed in HSH2 Tg mice are not due to attenuation of TNF family receptor-mediated signals leading to altered NF-kB activation. This conclusion is supported by an initial analysis of receptor-proximal signaling events in HSH2 Tg B cells in which activation of the non-canonical NF-kB pathway was observed to be normal in response to both soluble BAFF and anti-CD40 mAb (data not shown). Moreover, B cells isolated from HSH2 Tg animals exhibit comparable upregulation of activation marker expression in response to stimulation via TNF family receptors, TLRs and the BCR, supporting the idea that HSH2 transgene expression does not alter signaling events proximal to TNF family receptors.
In addition to CD40 and BAFF-R, TACI and BCMA, two other members of the TNF receptor family have important roles in B cell biology (27). BAFF the ligand for BAFF-R also binds to the TACI receptor, which along with BCMA binds APRIL (28). Despite sharing ligands, these receptors have non-redundant roles in B cell biology. BCMA, initially reported to be dispensable for the humoral response, has been shown to promote the survival of long-lived plasma cells (29, 30). It is formally possible that high level HSH2 expression may attenuate the response of plasma cells to APRIL leading to decreased production of Ig. However, studies have yet to be done to determine if endogenous HSH2 or the transgene are expressed in plasma cells. The function of the TACI receptor is more complex because TACI appears to exert opposing functions on B cell activation and differentiation. Mice deficient in TACI exhibit enhanced B cell activation as well as an enlargement of the B cell compartment (31). Although the T-dependent humoral response is normal in these animals, the T-independent response is impaired (32). Thus it is possible that in addition to affecting the cellular response to CD40 and BAFF stimulation, the response to TACI engagement may also be altered in HSH2 Tg animals resulting in the decreased humoral response to challenge with T-independent antigens. However, a common phenotypic effect of the experimental ablation of either APRIL or TACI is a significant reduction in serum IgA (31, 33). Because HSH2 Tg mice exhibit relatively normal levels of serum IgA, it is unlikely that the TACI-APRIL axis is affected by expression of the HSH2 transgene.
The data presented in this study identify a novel function for the adaptor protein HSH2 in regulation of Ig class switching and further demonstrate that there is an inverse correlation between the level of HSH2 expressed in B cells and their propensity to undergo class switching. Based on an analysis of endogenous HSH2 expression, it is clear that those B cells that are most likely to undergo class switching (i.e. GC B cells) express low levels of HSH2, whereas those B cell populations that produce primarily IgM (i.e. marginal zone and B1a/b B cells) express high levels of HSH2. In vitro experiments support the conclusion that HSH2 selectively alters the B cell response to signals transduced via TNF family receptors, including BAFF-R and CD40. Although signaling via both TNF family receptors and TLRs leads to upregulation of HSH2 expression, this adaptor protein functions in a selective manner to regulate the cellular response to TNF family receptors. Finally, it appears that HSH2 affects distal processes that are triggered by ligand binding to BAFF-R and CD40 because proximal signaling leading to early/intermediate gene expression appear to be normal in HSH2 Tg B cells. In summary, these findings suggest that HSH2 is a novel regulator of TNF family receptor signaling that plays an important role in controlling both the nature and the magnitude of the humoral immune response.
Supplementary Material
Acknowledgments
This work was supported by the National Institutes of Health (grant AI072647 to L. B. Justement).
Abbreviations used in this paper
- BAFF
B cell activating factor
- Fo
follicular
- GC
germinal enter
- HSH2
hematopoietic SH2-containing adaptor protein
- MZ
marginal zone
- PerCP
peridinin-chlorophyll-protein complex
- T1
transitional 1 B cells
- T2
transitional 2 B cells
- Tg
transgenic
References
- 1.Herrin BR, Groeger AL, Justement LB. The adaptor protein HSH2 attenuates apoptosis in response to ligation of the B cell antigen receptor complex on the B lymphoma cell line, WEHI-231. J Biol Chem. 2005;280:3507. doi: 10.1074/jbc.M407690200. [DOI] [PubMed] [Google Scholar]
- 2.Herrin BR, Justement LB. Expression of the adaptor protein hematopoietic Src homology 2 is up-regulated in response to stimuli that promote survival and differentiation of B cells. J Immunol. 2006;176:4163. doi: 10.4049/jimmunol.176.7.4163. [DOI] [PubMed] [Google Scholar]
- 3.Gauld SB, Blair D, Moss CA, Reid SD, Harnett MM. Differential roles for extracellularly regulated kinase-mitogen-activated protein kinase in B cell antigen receptor-induced apoptosis and CD40-mediated rescue of WEHI-231 immature B cells. J Immunol. 2002;168:3855. doi: 10.4049/jimmunol.168.8.3855. [DOI] [PubMed] [Google Scholar]
- 4.Mineva ND, Rothstein TL, Meyers JA, Lerner A, Sonenshein GE. CD40 ligand-mediated activation of the de novo RelB NF-kappaB synthesis pathway in transformed B cells promotes rescue from apoptosis. J Biol Chem. 2007;282:17475. doi: 10.1074/jbc.M607313200. [DOI] [PubMed] [Google Scholar]
- 5.Schauer SL, Bellas RE, Sonenshein GE. Dominant signals leading to inhibitor kappaB protein degradation mediate CD40 ligand rescue of WEHI 231 immature B cells from receptor-mediated apoptosis. J Immunol. 1998;160:4398. [PubMed] [Google Scholar]
- 6.Klein U, Casola S, Cattoretti G, Shen Q, Lia M, Mo T, Ludwig T, Rajewsky K, Dalla-Favera R. Transcription factor IRF4 controls plasma cell differentiation and class-switch recombination. Nat Immunol. 2006;7:773. doi: 10.1038/ni1357. [DOI] [PubMed] [Google Scholar]
- 7.Hagman J, Rudin CM, Haasch D, Chaplin D, Storb U. A novel enhancer in the immunoglobulin lambda locus is duplicated and functionally independent of NF kappa B. Genes Dev. 1990;4:978. doi: 10.1101/gad.4.6.978. [DOI] [PubMed] [Google Scholar]
- 8.Hardy RR, Carmack CE, Shinton SA, Kemp JD, Hayakawa K. Resolution and characterization of pro-B and pre-pro-B cell stages in normal mouse bone marrow. J Exp Med. 1991;173:1213. doi: 10.1084/jem.173.5.1213. [DOI] [PMC free article] [PubMed] [Google Scholar]
- 9.Muramatsu M, Kinoshita K, Fagarasan S, Yamada S, Shinkai Y, Honjo T. Class switch recombination and hypermutation require activation-induced cytidine deaminase (AID), a potential RNA editing enzyme. Cell. 2000;102:553. doi: 10.1016/s0092-8674(00)00078-7. [DOI] [PubMed] [Google Scholar]
- 10.Shapiro-Shelef M, Lin KI, McHeyzer-Williams LJ, Liao J, McHeyzer-Williams MG, Calame K. Blimp-1 is required for the formation of immunoglobulin secreting plasma cells and pre-plasma memory B cells. Immunity. 2003;19:607. doi: 10.1016/s1074-7613(03)00267-x. [DOI] [PubMed] [Google Scholar]
- 11.Batten M, Groom J, Cachero TG, Qian F, Schneider P, Tschopp J, Browning JL, Mackay F. BAFF mediates survival of peripheral immature B lymphocytes. J Exp Med. 2000;192:1453. doi: 10.1084/jem.192.10.1453. [DOI] [PMC free article] [PubMed] [Google Scholar]
- 12.Thompson JS, Schneider P, Kalled SL, Wang L, Lefevre EA, Cachero TG, MacKay F, Bixler SA, Zafari M, Liu ZY, Woodcock SA, Qian F, Batten M, Madry C, Richard Y, Benjamin CD, Browning JL, Tsapis A, Tschopp J, Ambrose C. BAFF binds to the tumor necrosis factor receptor-like molecule B cell maturation antigen and is important for maintaining the peripheral B cell population. J Exp Med. 2000;192:129. doi: 10.1084/jem.192.1.129. [DOI] [PMC free article] [PubMed] [Google Scholar]
- 13.Allen RC, Armitage RJ, Conley ME, Rosenblatt H, Jenkins NA, Copeland NG, Bedell MA, Edelhoff S, Disteche CM, Simoneaux DK, et al. CD40 ligand gene defects responsible for X-linked hyper-IgM syndrome. Science. 1993;259:990. doi: 10.1126/science.7679801. [DOI] [PubMed] [Google Scholar]
- 14.Castigli E, Alt FW, Davidson L, Bottaro A, Mizoguchi E, Bhan AK, Geha RS. CD40-deficient mice generated by recombination-activating gene-2-deficient blastocyst complementation. Proc Natl Acad Sci U S A. 1994;91:12135. doi: 10.1073/pnas.91.25.12135. [DOI] [PMC free article] [PubMed] [Google Scholar]
- 15.Foy TM, Laman JD, Ledbetter JA, Aruffo A, Claassen E, Noelle RJ. gp39-CD40 interactions are essential for germinal center formation and the development of B cell memory. J Exp Med. 1994;180:157. doi: 10.1084/jem.180.1.157. [DOI] [PMC free article] [PubMed] [Google Scholar]
- 16.Korthauer U, Graf D, Mages HW, Briere F, Padayachee M, Malcolm S, Ugazio AG, Notarangelo LD, Levinsky RJ, Kroczek RA. Defective expression of T-cell CD40 ligand causes X-linked immunodeficiency with hyper-IgM. Nature. 1993;361:539. doi: 10.1038/361539a0. [DOI] [PubMed] [Google Scholar]
- 17.Reimold AM, Iwakoshi NN, Manis J, Vallabhajosyula P, Szomolanyi-Tsuda E, Gravallese EM, Friend D, Grusby MJ, Alt F, Glimcher LH. Plasma cell differentiation requires the transcription factor XBP-1. Nature. 2001;412:300. doi: 10.1038/35085509. [DOI] [PubMed] [Google Scholar]
- 18.Schneider P, Takatsuka H, Wilson A, Mackay F, Tardivel A, Lens S, Cachero TG, Finke D, Beermann F, Tschopp J. Maturation of marginal zone and follicular B cells requires B cell activating factor of the tumor necrosis factor family and is independent of B cell maturation antigen. J Exp Med. 2001;194:1691. doi: 10.1084/jem.194.11.1691. [DOI] [PMC free article] [PubMed] [Google Scholar]
- 19.Perchonock CE, Fernando MC, Quinn WJ, 3rd, Nguyen CT, Sun J, Shapiro MJ, Shapiro VS. Negative regulation of interleukin-2 and p38 mitogen-activated protein kinase during T-cell activation by the adaptor ALX. Mol Cell Biol. 2006;26:6005. doi: 10.1128/MCB.02067-05. [DOI] [PMC free article] [PubMed] [Google Scholar]
- 20.Shapiro MJ, Powell P, Ndubuizu A, Nzerem C, Shapiro VS. The ALX Src homology 2 domain is both necessary and sufficient to inhibit T cell receptor/CD28-mediated up-regulation of RE/AP. J Biol Chem. 2004;279:40647. doi: 10.1074/jbc.M404198200. [DOI] [PubMed] [Google Scholar]
- 21.Pullen SS, Miller HG, Everdeen DS, Dang TT, Crute JJ, Kehry MR. CD40-tumor necrosis factor receptor-associated factor (TRAF) interactions: regulation of CD40 signaling through multiple TRAF binding sites and TRAF hetero-oligomerization. Biochemistry. 1998;37:11836. doi: 10.1021/bi981067q. [DOI] [PubMed] [Google Scholar]
- 22.Gardam S, Sierro F, Basten A, Mackay F, Brink R. TRAF2 and TRAF3 signal adapters act cooperatively to control the maturation and survival signals delivered to B cells by the BAFF receptor. Immunity. 2008;28:391. doi: 10.1016/j.immuni.2008.01.009. [DOI] [PubMed] [Google Scholar]
- 23.Graham JP, Moore CR, Bishop GA. Roles of the TRAF2/3 binding site in differential B cell signaling by CD40 and its viral oncogenic mimic, LMP1. J Immunol. 2009;183:2966. doi: 10.4049/jimmunol.0900442. [DOI] [PMC free article] [PubMed] [Google Scholar]
- 24.Morrison MD, Reiley W, Zhang M, Sun SC. An atypical tumor necrosis factor (TNF) receptor-associated factor-binding motif of B cell-activating factor belonging to the TNF family (BAFF) receptor mediates induction of the noncanonical NF-kappaB signaling pathway. J Biol Chem. 2005;280:10018. doi: 10.1074/jbc.M413634200. [DOI] [PubMed] [Google Scholar]
- 25.Berberich I, Shu GL, Clark EA. Cross-linking CD40 on B cells rapidly activates nuclear factor-kappa B. J Immunol. 1994;153:4357. [PubMed] [Google Scholar]
- 26.Qian Y, Qin J, Cui G, Naramura M, Snow EC, Ware CF, Fairchild RL, Omori SA, Rickert RC, Scott M, Kotzin BL, Li X. Act1, a negative regulator in CD40- and BAFF-mediated B cell survival. Immunity. 2004;21:575. doi: 10.1016/j.immuni.2004.09.001. [DOI] [PubMed] [Google Scholar]
- 27.Gross JA, Johnston J, Mudri S, Enselman R, Dillon SR, Madden K, Xu W, Parrish-Novak J, Foster D, Lofton-Day C, Moore M, Littau A, Grossman A, Haugen H, Foley K, Blumberg H, Harrison K, Kindsvogel W, Clegg CH. TACI and BCMA are receptors for a TNF homologue implicated in B-cell autoimmune disease. Nature. 2000;404:995. doi: 10.1038/35010115. [DOI] [PubMed] [Google Scholar]
- 28.Wu Y, Bressette D, Carrell JA, Kaufman T, Feng P, Taylor K, Gan Y, Cho YH, Garcia AD, Gollatz E, Dimke D, LaFleur D, Migone TS, Nardelli B, Wei P, Ruben SM, Ullrich SJ, Olsen HS, Kanakaraj P, Moore PA, Baker KP. Tumor necrosis factor (TNF) receptor superfamily member TACI is a high affinity receptor for TNF family members APRIL and BLyS. J Biol Chem. 2000;275:35478. doi: 10.1074/jbc.M005224200. [DOI] [PubMed] [Google Scholar]
- 29.Xu S, Lam KP. B-cell maturation protein, which binds the tumor necrosis factor family members BAFF and APRIL, is dispensable for humoral immune responses. Mol Cell Biol. 2001;21:4067. doi: 10.1128/MCB.21.12.4067-4074.2001. [DOI] [PMC free article] [PubMed] [Google Scholar]
- 30.O'Connor BP, Raman VS, Erickson LD, Cook WJ, Weaver LK, Ahonen C, Lin LL, Mantchev GT, Bram RJ, Noelle RJ. BCMA is essential for the survival of long-lived bone marrow plasma cells. J Exp Med. 2004;199:91. doi: 10.1084/jem.20031330. [DOI] [PMC free article] [PubMed] [Google Scholar]
- 31.Yan M, Wang H, Chan B, Roose-Girma M, Erickson S, Baker T, Tumas D, Grewal IS, Dixit VM. Activation and accumulation of B cells in TACI-deficient mice. Nat Immunol. 2001;2:638. doi: 10.1038/89790. [DOI] [PubMed] [Google Scholar]
- 32.Mantchev GT, Cortesao CS, Rebrovich M, Cascalho M, Bram RJ. TACI is required for efficient plasma cell differentiation in response to T-independent type 2 antigens. J Immunol. 2007;179:2282. doi: 10.4049/jimmunol.179.4.2282. [DOI] [PubMed] [Google Scholar]
- 33.Castigli E, Scott S, Dedeoglu F, Bryce P, Jabara H, Bhan AK, Mizoguchi E, Geha RS. Impaired IgA class switching in APRIL-deficient mice. Proc Natl Acad Sci U S A. 2004;101:3903. doi: 10.1073/pnas.0307348101. [DOI] [PMC free article] [PubMed] [Google Scholar]
Associated Data
This section collects any data citations, data availability statements, or supplementary materials included in this article.