

Abstract
The response of cells to a chemical or biological agent in terms of their impedance changes in real-time is a useful mechanism that can be utilized for a wide variety of biomedical and environmental applications. The use of a single-cell based analytical platform could be an effective approach to acquiring more sensitive cell impedance measurements, particularly in applications where only diminutive changes in impedance are expected. Here, we report the development of an on-chip cell impedance biosensor with two types of electrodes that hosts individual cells and cell populations, respectively, to study its efficacy in detecting cellular response. Human glioblastoma (U87MG) cells were patterned on single- and multi-cell electrodes through ligand-mediated natural cell adhesion. We comparatively investigated how these cancer cells on both types of electrodes respond to an ion channel inhibitor, chlorotoxin (CTX), in terms of their shape alternations and impedance changes to exploit the fine detectability of the single-cell based system. The detecting electrodes hosting single cells exhibited a significant reduction in the real impedance signal, while electrodes hosting confluent monolayer of cells showed little to no impedance change. When single-cell electrodes were treated with CTX of different doses, a dose-dependent impedance change was observed. This enables us to identify the effective dose needed for this particular treatment. Our study demonstrated that this single-cell impedance system may potentially serve as a useful analytical tool for biomedical applications such as environmental toxin detection and drug evaluation.
Keywords: cell-based sensor, impedance, single cell, cell patterning, glioma, chlorotoxin
1. Introduction
Cellular impedance biosensors have become a valuable characterization platform for detection and analysis of cellular responses to chemical and biological agents in real-time for cytotoxicity studies and drug screening applications (Asphahani and Zhang, 2007). Cell impedance measurements are typically acquired from microchip-based systems where either adherent cells are seeded and relatively stationary on electrodes or cells (both adherent or nonadherent) are transported and measured while in motion through microfluidic channels (Spegel et al., 2008). The most common form of the cell impedance technique is electric cell-substrate impedance sensing (ECIS) (Giaever and Keese, 1993; Liu et al., 2009; Curtis et al., 2009; Wang et al., 2010), which can distinguish cellular events such as cell adherence, spreading, growth, and motility through the monitoring of electric alternations at the point of contact between the cell and electrode in an instantaneous, label-free, and nondestructive manner (Kovacs, 2003). However, most ECIS systems study the behavior of cell populations on large-sized integrated microelectrode array (IMA) platforms, which are only capable of providing data on the collective response of cells to a given physiological condition. In comparison, single-cell systems can expose heterogeneous properties of cells that are otherwise concealed within the averaged response of a cell population (Levsky and Singer, 2003). This holds relevant implications toward drug development, as it is important to characterize the cell response to drugs alone, which can be accurately recorded on a single-cell system without cell–cell interaction that can cause destructive signal interference (Bahar et al., 2006; Chen et al., 2005). Furthermore, electrical signals measured from an individual single cell-electrode structure has been shown to be many times greater than that of a cluster of unordered cells placed on a common electrode, since both the shunt current paths and cell-to-electrode separation can be significantly reduced in a single-cell based system (Asphahani et al., 2008). By studying the behavior of individual cells over time, variations among cells as well as statistical distributions can be determined (Veiseh et al., 2007c). This has recently led to considerable interest in single-cell impedance sensors that can provide a more complete understanding of cellular response.
Recent progress in the development of single-cell impedance sensors has been based mainly on microfluidic technologies which detect impedance changes after positioning the individual cell on or passing it by electrodes under laminar flow (Spegel et al., 2008; Park et al., 2010). Such devices have been used to determine single-cell topography (Dharia et al., 2009), capacitance change (Ferrier et al., 2009), volume change (Hua and Pennell, 2009), ion channel activity (Han and Frazier, 2006), white blood cell differential analysis (Holmes et al., 2009), and the degree of metastatic behavior in cancer cells (Cho et al., 2009). Despite the promising advances with single-cell biosensors through the microfluidic technique, there is an alternative and beneficial approach to positioning cells on IMA chips through natural cell adhesion. By molecularly engineering the surface of electrodes and the nonelectrode regions of a microchip, single-cell patterning can be mediated to ensure normal cell signaling after attachment that regulates cell functions such as growth, differentiation, and motility (Hynes, 1992; Huttenlocher et al., 1995; Heidemann and Buxbaum, 1998; Garcia, 2006) and tight cell-to-electrode coupling (Thein et al., 2010). Yet to date, single- and multi-cell impedance systems have not been directly compared with regards to the detection sensitivity in the cellular response to a biological agent where only diminutive shape changes are known to occur.
This study is to develop an on-chip, quantitative bio-analytical technique to detect cellular response to an external analyte in real-time in terms of impedance changes and investigate the detectability of single cells on individual electrodes compared to multiple cells on a large electrode. Here we demonstrate our system by examining the cellular response to an ion channel inhibitor, as it may have implications on the development of new therapies for widespread clinical use. Current methods of characterizing ion-channel mediated regulation of cell volume incorporate separate techniques often using suspended cells, such as cell sizing with the Coulter Counter Multisizer to measure cell volume changes and patch clamp methods to record currents flowing through the ion channels of cell membranes (Ross et al., 2007). Cellular impedance characterization is well suited in studying cellular response to ion-channel regulating drugs because cell morphology and the degree of their adherence to a substrate are key indicators of migration and invasion (Teodorczyk and Martin-Villalba, 2010).
U87MG human glioblastoma cells and the chloride ion channel inhibitor chlorotoxin (CTX) were used as the target cell line and the response inducing analyte, respectively. Malignant gliomas are associated with low survival rates because of their ability to invade nonneoplastic regions of the brain, i.e., migrating long distances through narrow extracellular regions within the brain often along the microvasculature that is used as substratum (Sontheimer, 2008; Le Mercier et al., 2010). During invasion, gliomas cells undergo morphological change by decreasing their overall volume to become elongated and spindle-shaped, which is regulated by specific K+ and Cl− ion channels and transporters (Soroceanu et al., 1999; Sontheimer, 2008). CTX is a 36 amino chain peptide that has been shown to selectively bind to multiple forms of brain tumors, particularly primary brain tumors (Veiseh et al., 2007a), and alter cell volume and structure, acting as a factor in inhibiting cell invasion (Deshane et al., 2003; McFerrin and Sontheimer, 2006; Veiseh et al., 2009). In this study, IMA chips with both single- and multiple-cell hosting electrodes were made and surface-modified to mediate the natural adhesion and spreading of U87MG cells. The optimal applied frequency range of greatest cell signal strength was first identified, and the viability of cells stimulated by electrical current was then examined. An equivalent electrical circuit model was developed to predict the degree of sensitivity to which cell coverage can affect impedance change. U87MG cell impedance response to CTX on the resulting IMA sensor was subsequently analyzed and herein reported.
2. System Overview
A miniaturized cell impedance biosensor system for simultaneously monitoring both individual cells and cell populations on planar electrodes of a single IMA chip was developed to characterize morphological and impedance changes of cells in response to an analyte. An illustration of how the core system components function together is shown in figure 1. The IMA substrate design includes eight circular detecting electrodes of 20 μm diameter (area ~ 314 μm2) and eighteen electrodes of 30 μm diameter (area ~ 707 μm2) to host single-cells, six circular detecting electrodes of 250 μm diameter (area ~49,000 μm2) to host multiple cells, and two large, rectangular counter electrodes (area = 0.5 mm2) with negligible electrode impedance. Electrode sites of the IMA chip are first molecularly patterned with cell adhesion ligands while the rest of the surface is passivated with a nonfouling coating that resists protein adsorption and cell attachment. This surface modification strategy has been shown to decrease the distance between the cell and electrode and increase degree of cell coverage over the electrodes (Asphahani et al., 2008), which are critical factors that affect the cell signal-to-noise ratio (SNR), as the resulting shunt impedance would severely degrade the actual impedance characterization of the cell-electrode heterostructure.
Figure 1.

Illustration of the cell impedance monitoring system. Cells to be monitored are first patterned on IMA chips prior to loading in the chip carrier, which is attachable/detachable from the circuit board, and kept in a live-cell incubator chamber for real-time optical imaging and impedance measurements. Data acquisition is controlled in real-time by computer interface with the lock-in amplifier and MUX/Preamplifier circuit board through LabVIEW and processed post-time using MATLAB.
The IMA chip is housed inside a portable microchip carrier/holder that integrates to a multiplexer relay switching system with preamplification circuitry built on a printed circuit board (PCB) (pictured in supplementary Fig. 1). The chip securement is a custom-designed carrier (Aries Electronics, Bristol, PA) with an 5.5 mm hole in which a Teflon barrier is fitted through to immerse the electrode region with cell culture medium, which is stored above the carrier in the Teflon well containing up to 10 mL of medium. The MUX/preamp PCB is connected to a Stanford Research Systems SR810 lock-in amplifier (Sunnyvale, CA) that served as both the input waveform generator and output signal analyzer. All systems were remotely controlled in synchrony by a PC through GPIB interface protocol using laboratory virtual instrumentation engineering workbench (LabVIEW) software (National Instruments, Austin, TX).
The entire IMA chip carrier – MUX/preamp PCB is placed under an upright microscope (Nikon 80i, Melville, NY) encased within a non-humidified cell incubator chamber to maintain a controlled temperature and airflow environment. Environmental conditions such as pH, osmolarity, sterility, and temperature are held constant, otherwise compromising perceived cell impedance changes in response to an experimental analyte. Still, the primary system requirement is the selectivity of the cell patterning technique to precisely place individual cells on chemically-modified electrodes that retain cell viability and normal function.
3. Materials and methods
3.1 Materials
The following materials and chemicals were used as received: LOR5A/SPR3012, SPR220, and Remover PG (MicroChem, Newton, MA); 1-Octanethiol 98.5%, 3-Mercaptopropionoic acid 95% (3-MPA), Hydrochloric acid (HCl) 37%, N-hydroxysuccinimide 97% (NHS), and 1-ethyl-3-(3-(dimethylamino)-propyl) carbodiimide (EDAC) (Sigma-Aldrich, Milwaukee, WI); 2-[methoxy(polyethyleneoxy)propyl] trimethoxysilane (PEG) of Mw = 460–590 Da (Gelest, Morrisville, PA); 1X Phosphate Buffered Saline solution (PBS), Opti-MEM® I Reduced-Serum Medium (O-MEM), Dulbecco’s Modified Eagle’s Medium (DMEM), fetal bovine serum (FBS), penicillin-streptomycin-neomycin (PSN) antibiotic 100X mixture, and TrypLE™ Express Stable Trypsin Replacement (Invitrogen, Carlsbad, CA); lysine-arginine-glycine-aspartic acid (KRGD) oligopeptide (RS Synthesis, Louisville, KY); and r-Chlorotoxin (Alomone Labs Ltd., Jerusalem, Israel). All the solvents including toluene, isopropanol, and xylenes were HPLC grade and were purchased from Sigma-Aldrich. For cell viability assays, the Apoptotic & Necrotic & Healthy Cells Quantification Kit (30018) was used (Biotium, Hayward, CA). Absolute ethanol was always deoxygenated by dry N2 before use. U87MG human glioblastoma cells were obtained from the American Type Culture Collection (Manassas, VA).
3.2 IMA chip fabrication
IMA chips were fabricated on a 4 inch quartz wafer using microfabrication techniques that include photolithography, physical vapor metal deposition (PVD), lift-off process, plasma enhanced chemical vapor deposition (PECVD), and reactive ion etching (RIE). Dark-field photomasks were used in the chip fabrication and processed as follows. Positive photoresists spun on the chrome-coated Soda Lime blank masks were exposed under Heidelberg DWL66 laser writer (Heidelberg Instruments Mikrotechnik GmbH, Heidelberg, Germany) and developed. Transparent master patterns (or clear images with an opaque background) were then defined by wet-chemical etching of exposed chrome followed by photoresist stripping and cleaning. Prior to the chip fabrication process, the quartz wafer was cleaned with NanoStrip™ solution at 90 °C for 10 min, rinsed with DI water thoroughly, and dried using a spin dryer.
The IMA chip fabrication process began by first creating the microelectrodes and interconnections on the wafer (see figure 2 for the schematic of the microfabrication processes). In order to form these structures, photoresists LOR5A/SPR3012 were spun on the cleaned wafer, UV-exposed (356 nm) under the photomask consisting of the defined patterns, and developed. After removing the residual resists in the exposed regions by an oxygen descum, a Ti (125 Å)/Au (4000 Å) twin layer was deposited onto the wafer at a rate of 1.0 Å/s by electron-beam evaporation; the Ti layer was used to enhance the adhesion between the Au and the quartz. Microelectrodes and interconnections were then defined by a photoresist lift-off process. Interconnections were then over-coated with a conformal and electrically-insulating layer. To create such over-coating, a layer of SiO2 (~1 μm thick) was deposited by PECVD and was subsequently annealed in the furnace at ~250 °C for 2 hr under oxygen flow. After the annealing process, photoresist SPR220 was spun on the wafer, exposed, and developed to form a photoresist etch mask that covers and protects everywhere except for the regions above the electrodes. Cell-sized circular openings (of 20 μm, 30 μm and 250 μm diameter), known as via holes, over sensing microelectrodes and openings for two large counter electrodes through the SiO2 layer were created by RIE followed by the mask removal and oxygen plasma cleaning. The exposed electrodes were then coated with a second, thin Au layer (~1000 Å thick) to provide a rough, amorphous Au surface that was free of plasma-etch-induced surface impurities to lower the cell-free baseline impedance of Au microelectrodes (Thein et al., 2010). To obtain such coatings, photoresists LOR5A/SPR3012 were spun on the wafer, exposed, and developed to form opened patterns on top of exposed electrodes. After the residual resists in the exposed regions were removed by oxygen descum, an Au layer was deposited onto the wafer at a rate of 0.8 Å/s by electron-beam evaporation and then defined by photoresist lift-off. Finally, a 2.7 μm thick protective layer of photoresist was spun on the wafer to limit scratching and contamination, and a disco saw was used to cut the wafers to obtain 13 mm × 13 mm IMA chips.
Figure 2.

Schematic of the microfabrication processes of IMA chips. (1) Photolithography patterning, Ti and Au electron-beam deposition, and lift-off. (2) Plasma enhanced chemical vapor deposition of SiO2 and O2 passivation/annealing. (3) Photolithography patterning with reactive ion etching, mask removal, and O2 plasma cleaning. (4) Photolithography patterning for 2nd/final Au layer by electron-beam deposition.
3.3 Surface modification
Microelectrode array substrates were modified in the following manner based on previously established surface modification procedures (Veiseh et al., 2002; Veiseh et al., 2004; Veiseh et al., 2007b). The gold/silicon oxide substrates were washed with Remover PG, isopropanol, ethanol, and DI water, respectively, to remove the protective photoresist layer. The substrates were then placed in a BioForce ProCleaner™ UV/ozone chamber (BioForce Nanosciences, Des Moines, IA) for 60 min, after which they were rinsed thoroughly with ethanol, and placed in a 0.1 mM 1-octanethiol solution in ethanol for 16 hrs to form a self-assembled monolayer (SAM) over the gold electrodes. The silicon background was then passivated with PEG solution prepared in a nitrogen environment by adding 3 mM PEG in anhydrous toluene containing 0.1% concentrated HCl at room temperature for 18 hrs. Following the PEG reaction, the 1-octanethiol SAM was removed from the gold electrodes by heating in xylenes solvent at 120 °C for 2 hrs and sonicating in xylenes and ethanol, respectively, for 5 min each to dispel loosely bound moieties. The gold electrodes were then reacted with a 20 mM 3-MPA carboxylic acid-terminated alkanethiol for 16 hours at room temperature. For surfaces to be covalently linked with KRGD oligopeptide ligands, substrates were immersed in an aqueous solution of 150 mM EDAC and 30 mM N-hydroxysuccinimide (NHS) for 30 min to attach the NHS ester intermediate to activate carboxylate groups of the 3-MPA to chemically bond primary amino groups of KRGD. The substrates were then submerged in a 50 μg/mL KRGD solution in PBS buffer of 8.2 pH at room temperature for 1 hr. To remove loosely bound moieties after each step of the surface modification, the substrate was rinsed with its original buffer solution and DI water, respectively.
3.4 Seeding cells on IMA chips
Human glioblastoma cell line (U87MG) was cultured in 75 cm2 flasks at 37 °C in a humidified atmosphere with 5% CO2 using DMEM cell culture medium containing 10% FBS and 1% PSN antibiotic and supplemented with 4 mM L-glutamine, 1.5 g/L sodium bicarbonate, and 4.5 g/L glucose. The medium was changed every third day. For cell adhesion on IMA chips, the culture medium was changed to O-MEM containing the same supplements, and 1.0 mL of U87MG cells at a concentration of 2 × 10⁴ cells/mL was plated onto the peptide-patterned substrates. The cells were allowed to adhere to the electrodes for 24 hrs under the standard culture conditions and electrical measurements were recorded throughout the seeding process.
3.5 Electrical measurements of patterned cells
Cellular impedance measurements were taken in the following manner. The input signal of a 10 mV (peak-to-peak) sine wave within a frequency range of 500 Hz to 20 kHz was passed through a 100 kΩ resistor in a voltage divider circuit configuration to limit the current amplitude to 100 nA. Electrical characterization involved the measurement of the voltage amplitude between the detecting electrode and counter electrode (ΔV) and the signal phase shift (Δϕ) using a SR810 lock-in amplifier. Complex impedance was calculated and analyzed post processing from the measured output voltage using MATLAB® software.
3.6 Viability assay
The viability of single cells during continuous impedance monitoring was assessed with Hoechst 33342 (Hoechst) and ethidium homodimer III (EtD-III) staining reagents from a live-dead cell assay kit. U87MG cells patterned on IMA chips were repeatedly stimulated by 100 nA AC current at 2 kHz on each detecting electrode for one minute every half hour over the course of 24 hrs. Next, cell staining was carried out (per the manufacturer’s protocol) by diluting 5 μL of 500 μg/mL Hoechst and 200 μM EtD-III into 100 μL of 1X binding buffer, which was exchanged with existing cell medium in the IMA chip carrier. Fluorescent images and corresponding Brightfield images were taken for all cell-covered electrodes to determine viability. For comparison, U87MG-patterned IMA chips were also stimulated by 100 μA AC current at 2 kHz for no less than 2 hours, after which cell staining and imaging were performed. Cells were determined to be viable if Hoechst signal was detected and EtD-III was not, and distinguished as necrotic if both Hoechst and EtD-III signals were detected. All images were taken with a 20× dry lens using the UV and TRITC filter settings for the Hoechst and EtD-III stains, respectively. Experiments were repeated two more times.
3.7 Cell impedance response to CTX
To quantify the morphological changes of single cells and small cell populations using impedance measurements, U87MG cells were seeded onto the IMA chip with both single- and multi-cell hosting electrodes. After 24 hrs of seeding and attachment, the medium was replaced with fresh O-MEM culture medium containing CTX at a concentration of 5 μM, and the impedance data were acquired for 16 hrs of the exposure at a 2 kHz signal frequency and a sampling rate of 60 data points per hour per electrode. Optical images were taken throughout the experiment, and only single cells that were initially fully spread on 30 μm electrodes and cell populations that were initially fully confluent on 250 μm electrodes were selected for the single-cell and multi-cell data sets, respectively. Real complex impedance results were normalized to the data points before CTX inoculation and plotted as a function of time. Three runs of each experiment were performed. CTX dose-effect impedance monitoring experiments were performed under the same conditions except varying the CTX concentrations to 500 nM, 1 μM, 5 μM, and 10 μM.
4. Results and discussion
4.1 Single-cell impedance spectroscopy
The evaluation of cellular impedance on planar electrodes is a frequency-dependent measurement, by which cells attached and spread on the surface of the electrode hinder the free flow of charge carriers (i.e., electrical current) from the electrode into the bulk electrolyte. For a wide frequency range, the electrical current passing through a cell-electrode-electrolyte system is paracellular, where it has to bypass the cell along shunt pathways, e.g., through narrow channels that exist between the cell and electrode surface and along the pathways that may exist around the cell into the bulk electrolyte. Transcellular current may pass through the cell membrane at higher frequency, but the contribution of this type of current to the overall current is approximated at 2% (Huang et al., 2004). Thus, in order to monitor the bioelectrical impedance response of single and multiple cells to an analyte, be it for toxin detection or drug screening, it is necessary to examine the impedance signal at an optimal frequency where the greatest contribution to the measured impedance is due to the cell.
The optimal frequency of our cell impedance sensor platform was determined by performing an impedance spectral sweep within a frequency range of 500 Hz to 20 kHz to compare the cell signal to that of cell-free (baseline) electrode. This range was chosen to preserve the ability to monitor the dielectric properties of the cell that become incorporated into the overall system impedance at much higher frequencies. Figure 3 shows the impedance magnitudes of the frequency-dependent spectrum before and after U87MG cells were patterned on single- and multiple-cell hosting electrodes. The difference in the impedance magnitude between the cell and baseline measurements across the entire tested spectrum indicated that the cell impedance achieved the maximum value between 1 kHz to 10 kHz, where the largest cell-to-baseline ratio (CBR, calculated by Zcell-electrode − Zbaseline/Zbaseline) equal to 1.59 was observed for single-cell covered electrodes. Conversely, the largest CBR on multi-cell covered electrodes was only 0.62, which can be attributed to current leakage through gaps between neighboring cells, leading to a lower seal resistance (Rseal) and reduced SNR.
Figure 3.

Frequency spectroscopy plot of impedance magnitude |Z| at a frequency range from 500 to 20 kHz when cell-free electrodes of 30 μm and 250 μm diameters are seeded with U87MG cells (n = 18 per condition).
In our IMA impedance system, the lower end of the spectrum (500 Hz) showed that the detectable impedance was dominated by the electrode-electrolyte interface rather than the presence of cells, which yielded CBRs of 0.18 and 0.02 for 30 μm and 250 μm electrodes, respectively. At the higher end of the frequency spectrum (20 kHz), the detectable impedance was dominated by the electrolyte and system wiring as the cell membrane becomes more capacitive and current-leaking (ultimately acting as a short circuit for frequencies greater than 50 kHz) (Gordon et al., 1989), which yielded a CBR of 0.46 and 0.24, respectively. Thus, 2 kHz was selected as the designated frequency for all the cell impedance measurements reported in this study. At this frequency, the attained CBR from single-cell electrodes was 9 × higher than the CBR at 500 Hz and 3 × higher than the CBR at 20 kHz, which are the highest among all CBRs for both sizes.
4.2 Assessment of cell viability on IMA chips
To assess the viability of cells after cell patterning and continuous exposure to electrical current on the IMA chips, U87MG cells were stained with Hoechst and EtD-III 24 hrs after impedance spectroscopy data acquisition. Hoechst is a cell membrane-permeant, minor groove-binding DNA stain that emits bright blue fluorescence upon binding to DNA (Belloc et al., 1994). EtD-III is a positively charged nucleic acid probe impermeant to the cell membrane of live or apoptotic cells that indicates necrotic cells with red fluorescence (Laing et al., 2006). Figure 4a shows typical U87MG single cells on 30 μm electrodes subjected to 100 nA and 100 μA of electrical current and stained with the live-dead assay fluorescent dyes for quantifying healthy (blue only) and necrotic (red and blue) cells by fluorescence microscopy. All cells monitored using 100 nA current showed Hoechst fluorescence but not EtD-III, indicating that cells remained viable under this condition. Alternatively, cells excited by 100 μA current exhibited a necrotic response, as indicated by the combination of Hoechst and EtD-III signals, signifying a compromised cell membrane. The normalized viability count displayed in figure 4b confirmed that 100% of the cells stimulated by 100 nA current were viable while only 3.8% of the cells survived the 100 μA current excitation.
Figure 4.

(a) Brightfield and fluorescence images of U87MG single-cell adhered to 30 μm detecting electrodes of an IMA chip after continuous impedance monitoring for 24 hours using 100 nA current (top row) and 100 μA current (bottom row). From left to right: Brightfield, Hoechst 33342 staining on UV fluorescence channel, EtD-III staining on TRITC fluorescence channel, and the fluorescent overlay images. The scale bar is 30 μm. (b) Viability of U87MG cells, as determined by presence of Hoechst 33342 and absence of EtD-III signal and normalized to the total count.
When large electric current pulses are applied to cells and tissue, thermal energy may be generated at the electrode site causing undesired heating of cells. In our IMA system, a current of 100 nA through a single-cell hosting electrode would create a current density in the mA/cm2 range, which is at a level sufficiently low to preserve cell viability (Akanji et al., 2008). However, raising the current by three orders of magnitude proportionally elevates the current density to an A/cm2 level. Such current flow through conducting medium most likely causes Joule effects that consequently increase cell temperatures above 43 °C, which can denature proteins in the cell resulting in cell necrosis (Lackovic et al., 2009). Therefore, it is important to restrict the current density magnitude to a level that does not damage cell structure or function while also meeting the system requirements to resolve the cell signal from noise.
4.3 Circuit model for cell coverage change
An equivalent electrical circuit model (ECM) of a single-cell covered planar electrode (figure 5) has been developed based on models established previously (Asphahani et al., 2008; Thein et al., 2010) to analyze the effect of diminutive changes in morphology (e.g., retraction of U87MG cell coverage on the electrode due to CTX) on the electrically transduced signal comparing the electrode’s initial degree of cell coverage, i.e., adhesion and spreading. In developing the ECM, the following assumptions were made. First, it was assumed that a ‘fully spread’ single cell covers approximately 95–98% of the electrode initially, and thus the electrode possesses both cell-occupied Ac (rc) and cell-free Afree (rc) areas, where Afree (rc) = Ae (re) − Ac (rc) Next, cell adhesion was expected to be very tightly coupled to the modified electrode due to the manner of surface mediated cell adhesion, and thus a very large seal impedance (Rseal, the variable resistance between the cell and substrate, increasing with increased degree of cell spreading and focal adhesions sites) exists for a single cell patterned on the electrode (Asphahani et al., 2008; Thein et al., 2010). It was assumed that cell impedance (Zc) is much larger than the impedance of electrode surface occupied by the cell (Ze,c) or cell-free (Ze,free) for the frequency used in this study (e.g., 2 kHz). And finally, the spreading resistance through the electrolytic solution (Rsoln) was much smaller than other ECM components.
Figure 5.

ECM of the single-cell electrode heterostructure.
Based on the ECM, the overall impedance of the single-cell–electrode heterostructure was formulated to be (please see “Notations used in the text” at the end of the article for definitions of symbols and variables):
| (1) |
where the surface impedance of electrode occupied by the cell is defined as:
| (2) |
the surface impedance of unoccupied electrode is defined as:
| (3) |
the impedance of cell is defined as:
| (4) |
the impedance of sealed resistance is defined as:
| (5) |
and the spreading resistance through the electrolytic solution is defined as:
| (6) |
The impedance of the overall single-cell–electrode heterostructure for all frequencies can be described by equation (1). Yet, at a frequency of 2 kHz where a tight cell adhesion between the cell and the electrode exists, the term providing the largest contribution is Ze,free, also written as Ze,free (jω, rc) = ze (jω)/[Ae (re) − Ac (rc)] (Huang et al., 2004). Therefore, the overall impedance is proportional to 1/[1 − (rc/re)2].
For the overall multiple-cell–electrode heterostructure, the equivalent impedance is simply the parallel combination of the individual single-cell–electrode domains. In this case, the total area covered by individual cells was treated as a single, large area covered by a very large cell, i.e., the effective radius of the combined area of individual cells expressed .
The averaged percent change in the averaged radius of individual cells due to the effect of CTX uptake is directly correlated to the change in effective radius. However, in multiple-cell electrodes, the percentage of cell-free area on the electrode is significantly larger than that in single-cell electrodes due to the presence of cell-to-cell gaps in the multi-cell monolayer. Therefore, the initial cell-occupied area in the multiple-cell electrode is usually less than that in single-cell electrode, i.e., rc,eff/re,large < rcell/re,small.
The dependent relationship of the normalized real impedance to the initial cell coverage on the electrode is shown in figure 6 and expressed as Re [Z (rc)]/Re [Zo (rc,o)] ∞ [1 − (rc,o/re)2]/[1 − (rc/re)2]. The plot demonstrates the considerable effect on normalized real impedance change (or different overall impedance changes (Re[Zo] − Re[Zss]) from four varying degrees of initial cell coverage on the electrode (e.g., 98%, 90%, 81%, 73%) up to a 16% reduction in cell radius. It can be seen that the higher the initial cell coverage or rc,o/re ratio, the greater reduction of normalized real impedance for the same degree of cell retraction.
Figure 6.
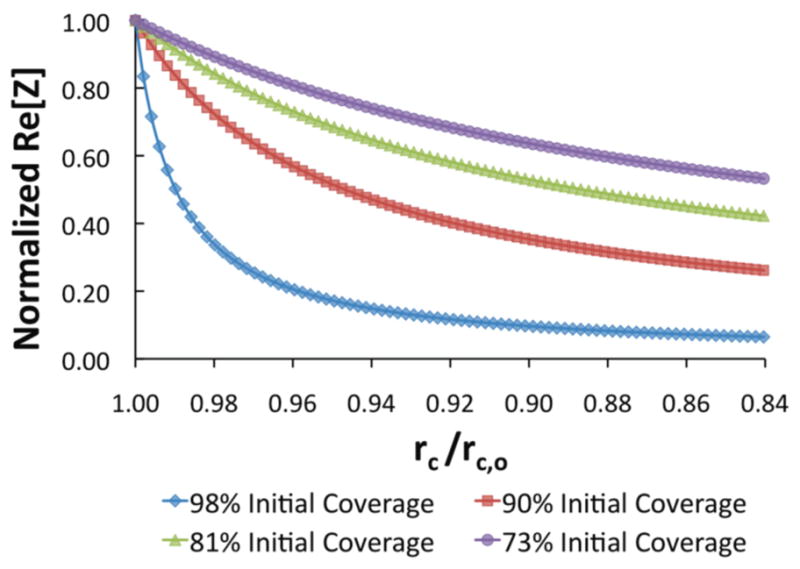
Influence of initial cell coverage (rc,o/re) on normalized real impedance (Re[Z]) as a result of reduced coverage and retraction of cell morphology on the electrode (rc/rc,o).
It is also believed that the percent of U87MG cell membrane retraction on the single-cell electrode due to CTX would be substantially larger than that on a larger, multiple-cell electrode due to the cell–cell junctions formed between adjacent cells in the monolayer. Because adjacent cells are linked and held together, the overall uptake of CTX and resultant morphological variation would be less than that of a single cell. Therefore, it was expected that the overall change in cell retraction would not be observable in the multiple-cell impedance measurement. While less cell–cell linkages and higher cell confluency of the monolayer may improve the multiple-cell measurement, the single-cell level analysis can provide more control over initial electrode coverage and thus greatly improve sensitivity to study more nuanced morphological effects on the cell.
4.4 Glioblastoma impedance response to CTX
To evaluate the detection sensitivity of our cellular impedance biosensor, we used the chloride ion channel blocker CTX to treat cells, which has been reported to inhibit invasion and induce cellular shape change, but not detachment or death of glioma cells (Deshane et al., 2003). We analyzed this phenomenon using single- and multi-cell covered electrodes on a single IMA chip concurrently over a time course while qualitatively comparing optical micrographs with the quantitative data. Figure 7a illustrates the morphological change of four U87MG single-cell electrodes (right panel) and one multi-cell electrode (left panel) with a confluent U87MG monolayer through optical differential interference contrast (DIC) images on the IMA chip before and 16 hrs after inoculation of 5 μM CTX. Prior to CTX inoculation, U87MG cells were fully spread over both types of detecting electrodes. It is understood that the cellular internalization of CTX occurs through the endocytosis of lipid raft-bound ion channels that are necessary for volume regulation (Sontheimer, 2008). This causes a well-spread cell to retract along the electrode surface and translate to a round and distended form, consequently exposing electrode surface area to the electrolytic solution. This observed reduction in cell-electrode coverage corresponded to a substantial reduction in the recorded real impedance signal for single-cell hosting electrodes.
Figure 7.

(a) Schematic of IMA chip featuring optical epi-DIC micrographs of four single live U87MG cells on 30 μm detecting electrodes (right panel) and one 250 μm detecting electrode hosting a confluent monolayer of live U87MG cells (left panel) before and 16 hours after 5 μM CTX treatment. Both scale bars represent 30 μm. (b)–(e) Normalized real impedance waveforms of the four U87MG single cells exposed to 5 μM CTX over a period of 16 hours. Real impedance was normalized to the point just prior to CTX inoculation.
Data was normalized to the point just prior to CTX inoculation to demonstrate the direct effects of CTX on the patterned glioblastoma cells, as seen in figure 7b–e. By normalizing impedance to the time point before drug inoculation, initial variation of impedance values caused by inequalities of electrode surface roughness was made negligible, and therefore average responses could be compared. Impedance changes shown in these graphs correspond to the responses of the four single-cells featured (top to bottom, respectively) in figure 7a over a 16-hour period after the CTX was introduced. After 8 hrs of exposure to 5 μM CTX, a concentration shown to effectively inhibit glioma invasion (Soroceanu et al., 1999), the detected impedance decreased by 50% or more for all four cells. Although all the single cells exhibited the same trend in impedance reduction over the 16-hour period, some variation in the initial temporal response was observed among the single-cell data (figure 7b–e). The morphological changes undergone by each individual cell transduced by the impedance sensor did not occur at the same time, and not necessarily in the same way, which highlights the heterogeneous behavior of cells and the requisite of single-cell analysis to identify cell–cell differences. While impedance analysis alone cannot provide a complete explanation for the mechanisms of cellular shape change, it can provide rapid, quantitative data to aid in the design of other bioassays that would be able to provide a more comprehensive picture.
Figure 8 shows the average normalized real impedance waveforms for single- and multi-cells treated with CTX, along with single cells receiving no CTX treatment. From this graph, it is evident that the morphological change of U87MG cells due to CTX inoculation is indeed discernible on 30 μm single-cell electrodes, but not on 250 μm electrodes with a confluent population of the same cells. While the same shape changes can be qualitatively interpreted from microscopy data on the multi-populated large electrode, the impedance response stayed approximately the same as before the CTX was introduced. A similar nonfluctuating response was also seen by U87MG single cells receiving no CTX treatment acting as a control. Although multi-cell electrodes did not exhibit enough sensitivity to the subtle electrical signal changes of the cell-electrode heterostructure, this technique is still useful in studying cell population responses to analytes where more dramatic physiological changes at the electrode site occur, such as cell adhesion and viability. Yet for cell-based impedance analysis intended to study more diminutive changes, single-cell experiments are shown to be more sensitive, precise, and effective.
Figure 8.

Average normalized real impedance waveform of multiple U87MG cells (blue) and single U87MG cells (green) in response to 5 μM CTX, as well as to single cells receiving no CTX treatment (brown). Real impedance was normalized to the point just prior to CTX inoculation.
We further evaluated the response of cells to varying concentrations of CTX (500 nM, 1 μM, 5 μM, and 10 μM) (figure 9), as an example of identifying effective drug dose for a particular treatment as commonly exercised in drug screening applications. The higher concentrations of 5 and 10 μM shared essentially the same impedance response curve, i.e., a 50% decrease in normalized real impedance. However, impedance changes with the lower concentrations of CTX, such as 500 nM and 1 μM, showed different characteristics during the 16-hour monitoring period. Single-cells exposed to 500 nM showed an essentially unvarying impedance waveform, indicating that this dose level was insufficient to alter the cell morphology through volume regulation. Single-cells exposed to 1 μM exhibited a notable impedance reduction over time, but not as significant as single-cells exposed to 5 and 10 μM CTX. Only a few single cells showed the CTX-induced effects at this dose, which lowered the average impedance response somewhat, but not to the magnitude consistent with the higher doses where the drug-induced change was detected among virtually all individual glioblastoma cells. These results suggest that 5 μM is an effective dose for this particular treatment and that the concentration-dependent effects of CTX can be delineated using a single-cell impedance system.
Figure 9.

Average normalized real impedance waveforms of U87MG single cells in response to CTX at concentrations of 500 nM (dark yellow), 1.0 μM (light blue), 5.0 μM (green), and 10.0 μM (blue), respectively, over a period of 16 hours. Real impedance was normalized to the point just prior to CTX inoculation.
5. Conclusions
We have presented a new biosensing platform to study single- and multiple-cells on microarrays of electrodes simultaneously that is addressable through microscopy and impedance spectroscopy and demonstrated that subtle morphological alterations of individual cells can be characterized through impedance waveform alterations. It was established that the impedance monitoring technique is suitable and sensitive enough to detect very subtle cellular responses at a single-cell level that are not always discernable by cell populations on larger electrodes, holding implications for use of this type of high throughput data acquisition system in primary drug screening applications for personalized medical treatment. By studying impedance of single glioblastoma cells, we have shown the ability to detect the concentration-dependent effects of CTX and cell-to-cell variation in their morphological and impedance response without interference of cell–cell interactions, which could have otherwise been lost in bulk cell population measurements. The system has also shown the potential of identifying the effective drug dose for a particular treatment. Additional attributes of this system include real-time recording, high throughput, and readdressability of individual cells.
Supplementary Material
Acknowledgments
The authors acknowledge the funding support from the National Institutes of Health (R01GM075095) and the lab assistance of Yu Chun Chen, Yuan Yuan Ho, Shulun Liu, and Sau Shun Wong.
Notations used in the text
- Ac [μm2]
Surface Area of the electrode occupied by the cell/cells
- Afree [μm2]
Surface Area of the electrode unoccupied by the cell/cells
- Ae [μm2]
Surface Area of the electrode
- rc [μm]
Radius of the cell
- rc,o [μm]
Initial radius of the cell
- re [μm]
Radius of the electrode
- re,large [μm]
Radius of the single-cell hosting electrode
- re,small [μm]
Radius of the multiple-cell hosting electrode
- rc,eff [μm]
Effective radius of combined area of individual cells
- rc,avg [μm]
Averaged radius of individual cells in the monolayer
- Rseal [Ω]
Sealed resistance
- Rsoln [Ω]
Spreading resistance through the electrolytic solution
- Ze,c [Ω]
Surface impedance of electrode occupied by the cell/cells
- Ze,free [Ω]
Surface impedance of the electrode unoccupied by the cell/cells
- ze [Ω–cm2]
Specific surface impedance of the electrode
- Zc [Ω]
Impedance of the cell/cells
- zc [Ω–cm2]
Specific impedance of the cell/cells
- Z [Ω]
Overall cell–electrode heterostructure impedance
- Zo [Ω]
Initial overall cell–electrode heterostructure impedance
- Zss [Ω]
Steady–state overall cell–electrode heterostructure impedance
- ρsoln [Ω–cm]
Resistivity of tissue culture media (bulk)
- ρ′soln [Ω–cm]
Resistivity of tissue culture media in the area between the cell and the electrode (the cleft region)
- t [nm]
Averaged cell–to–electrode separation distance
References
- Akanji OO, Lee DA, Bader DA. The effects of direct current stimulation on isolated chondrocytes seeded in 3D agarose constructs. Biorheology. 2008;45:229–43. [PubMed] [Google Scholar]
- Asphahani F, Thein M, Veiseh O, Edmondson D, Kosai R, Veiseh M, Xu J, Zhang MQ. Influence of cell adhesion and spreading on impedance characteristics of cell-based sensors. Biosensors & Bioelectronics. 2008;23:1307–13. doi: 10.1016/j.bios.2007.11.021. [DOI] [PMC free article] [PubMed] [Google Scholar]
- Asphahani F, Zhang M. Cellular impedance biosensors for drug screening and toxin detection. Analyst. 2007;132:835–41. doi: 10.1039/b704513a. [DOI] [PMC free article] [PubMed] [Google Scholar]
- Bahar R, Hartmann CH, Rodriguez KA, Denny AD, Busuttil RA, Dolle MET, Calder RB, Chisholm GB, Pollock BH, Klein CA, Vijg J. Increased cell-to-cell variation in gene expression in ageing mouse heart. Nature. 2006;441:1011–4. doi: 10.1038/nature04844. [DOI] [PubMed] [Google Scholar]
- Belloc F, Dumain P, Boisseau MR, Jalloustre C, Reiffers J, Bernard P, Lacombe F. A flow cytometric method using Hoechst 33342 and propidium iodide for simultaneous cell cycle analysis and apoptosis determination in unfixed cells. Cytometry. 1994;17:59–65. doi: 10.1002/cyto.990170108. [DOI] [PubMed] [Google Scholar]
- Chen CS, Jiang XY, Whitesides GM. Microengineering the environment of mammalian cells in culture. MRS Bull. 2005;30:194–201. [Google Scholar]
- Cho Y, Kim HS, Frazier AB, Chen ZG, Shin DM, Han A. Whole-Cell Impedance Analysis for Highly and Poorly Metastatic Cancer Cells. J Microelectromech Syst. 2009;18:808–17. [Google Scholar]
- Curtis TM, Widder MW, Brennan LM, Schwager SJ, van der Schalie WH, Fey J, Salazar N. A portable cell-based impedance sensor for toxicity testing of drinking water. Lab Chip. 2009;9:2176–83. doi: 10.1039/b901314h. [DOI] [PubMed] [Google Scholar]
- Deshane J, Garner CC, Sontheimer H. Chlorotoxin inhibits glioma cell invasion via matrix metalloproteinase-2. J Biol Chem. 2003;278:4135–44. doi: 10.1074/jbc.M205662200. [DOI] [PubMed] [Google Scholar]
- Dharia S, Ayliffe HE, Rabbitt RD. Single cell electric impedance topography: Mapping membrane capacitance. Lab Chip. 2009;9:3370–7. doi: 10.1039/b912881f. [DOI] [PMC free article] [PubMed] [Google Scholar]
- Ferrier GA, Romanuik SF, Thomson DJ, Bridges GE, Freeman MR. A microwave interferometric system for simultaneous actuation and detection of single biological cells. Lab Chip. 2009;9:3406–12. doi: 10.1039/b908974h. [DOI] [PubMed] [Google Scholar]
- Garcia AJ. Polymers For Regenerative Medicine. 2006:171–90. [Google Scholar]
- Giaever I, Keese CR. A Morphological Biosensor For Mammalian-Cells. Nature. 1993;366:591–2. doi: 10.1038/366591a0. [DOI] [PubMed] [Google Scholar]
- Gordon LGM, Kottra G, Fromter E. Electrical-impedance analysis of leaky epithelia -Theory, techniques, and leak artifact problems. Method Enzymol. 1989;171:642–63. doi: 10.1016/s0076-6879(89)71036-3. [DOI] [PubMed] [Google Scholar]
- Han A, Frazier AB. Ion channel characterization using single cell impedance spectroscopy. Lab Chip. 2006;6:1412–4. doi: 10.1039/b608930e. [DOI] [PubMed] [Google Scholar]
- Heidemann SR, Buxbaum RE. Cell crawling: First the motor, now the transmission. Journal Of Cell Biology. 1998;141:1–4. doi: 10.1083/jcb.141.1.1. [DOI] [PMC free article] [PubMed] [Google Scholar]
- Holmes D, Pettigrew D, Reccius CH, Gwyer JD, van Berkel C, Holloway J, Davies DE, Morgan H. Leukocyte analysis and differentiation using high speed microfluidic single cell impedance cytometry. Lab Chip. 2009;9:2881–9. doi: 10.1039/b910053a. [DOI] [PubMed] [Google Scholar]
- Hua SZ, Pennell T. A microfluidic chip for real-time studies of the volume of single cells. Lab Chip. 2009;9:251–6. doi: 10.1039/b806003g. [DOI] [PMC free article] [PubMed] [Google Scholar]
- Huang XQ, Nguyen D, Greve DW, Domach MM. Simulation of microelectrode impedance changes due to cell growth. Ieee Sensors Journal. 2004;4:576–83. [Google Scholar]
- Huttenlocher A, Sandborg RR, Horwitz AF. Adhesion In Cell-Migration. Current Opinion in Cell Biology. 1995;7:697–706. doi: 10.1016/0955-0674(95)80112-x. [DOI] [PubMed] [Google Scholar]
- Hynes RO. Integrins: versatility, modulation, and signaling in cell adhesion. Cell. 1992;69:11–25. doi: 10.1016/0092-8674(92)90115-s. [DOI] [PubMed] [Google Scholar]
- Kovacs GTA. Electronic sensors with living cellular components. Proceedings Of The Ieee. 2003;91:915–29. [Google Scholar]
- Lackovic I, Magjarevic R, Miklavcic D. Three-dimensional Finite-element Analysis of Joule Heating in Electrochemotherapy and in vivo Gene Electrotransfer. IEEE Trns Dielectr Electr Insul. 2009;16:1338–47. [Google Scholar]
- Laing JM, Gober MD, Golembewski EK, Thompson SM, Gyure KA, Yarowsky PJ, Aurelian L. Intranasal administration of the growth-compromised HSV-2 vector Delta RR prevents kainate-induced seizures and neuronal loss in rats and mice. Mol Ther. 2006;13:870–81. doi: 10.1016/j.ymthe.2005.12.013. [DOI] [PMC free article] [PubMed] [Google Scholar]
- Le Mercier M, Fortin S, Mathieu V, Kiss R, Lefranc F. Galectins and Gliomas. Brain Pathol. 2010;20:17–27. doi: 10.1111/j.1750-3639.2009.00270.x. [DOI] [PMC free article] [PubMed] [Google Scholar]
- Levsky JM, Singer RH. Gene expression and the myth of the average cell. Trends Cell Biol. 2003;13:4–6. doi: 10.1016/s0962-8924(02)00002-8. [DOI] [PubMed] [Google Scholar]
- Liu QJ, Yu JJ, Xiao L, Tang JCO, Zhang Y, Wang P, Yang M. Impedance studies of bio-behavior and chemosensitivity of cancer cells by micro-electrode arrays. Biosensors & Bioelectronics. 2009;24:1305–10. doi: 10.1016/j.bios.2008.07.044. [DOI] [PubMed] [Google Scholar]
- McFerrin MB, Sontheimer H. A role for ion channels in glioxna cell invasion. Neuron Glia Biol. 2006;2:39–49. doi: 10.1017/S17440925X06000044. [DOI] [PMC free article] [PubMed] [Google Scholar]
- Park H, Kim D, Yun K-S. Single-cell manipulation on microfluidic chip by dielectrophoretic actuation and impedance detection. Sensors and Actuators B: Chemical. 2010;150:167–73. [Google Scholar]
- Ross SB, Fuller CM, Bubien JK, Benos DJ. Amiloride-sensitive Na+ channels contribute to regulatory volume increases in human glioma cells. Am J Physiol-Cell Physiol. 2007;293:C1181–C5. doi: 10.1152/ajpcell.00066.2007. [DOI] [PubMed] [Google Scholar]
- Sontheimer H. An unexpected role for ion channels in brain tumor metastasis. Exp Biol Med. 2008;233:779–91. doi: 10.3181/0711-MR-308. [DOI] [PMC free article] [PubMed] [Google Scholar]
- Soroceanu L, Manning TJ, Sontheimer H. Modulation of glioma cell migration and invasion using Cl− and K+ ion channel blockers. J Neurosci. 1999;19:5942–54. doi: 10.1523/JNEUROSCI.19-14-05942.1999. [DOI] [PMC free article] [PubMed] [Google Scholar]
- Spegel C, Heiskanen A, Skjolding LHD, Emneus J. Chip based electroanalytical systems for cell analysis. Electroanalysis. 2008;20:680–702. [Google Scholar]
- Teodorczyk M, Martin-Villalba A. Sensing Invasion: Cell Surface Receptors Driving Spreading of Glioblastoma. J Cell Physiol. 2010;222:1–10. doi: 10.1002/jcp.21901. [DOI] [PubMed] [Google Scholar]
- Thein M, Asphahani F, Chang A, Buckmaster R, Zhang M, Xu J. Response Characteristics of Single–Cell Impedance Sensors Employed with Surface–Modified Microelectrodes. Biosens Bioelectron. 2010;25:1963–9. doi: 10.1016/j.bios.2010.01.023. [DOI] [PMC free article] [PubMed] [Google Scholar]
- Veiseh M, Gabikian P, Bahrami SB, Veiseh O, Zhang M, Hackman RC, Ravanpay AC, Stroud MR, Kusuma Y, Hansen SJ, Kwok D, Munoz NM, Sze RW, Grady WM, Greenberg NM, Ellenbogen RG, Olson JM. Tumor paint: a chlorotoxin:Cy5.5 bioconjugate for intraoperative visualization of cancer foci. Cancer Res. 2007a;67:6882–8. doi: 10.1158/0008-5472.CAN-06-3948. [DOI] [PubMed] [Google Scholar]
- Veiseh M, Veiseh O, Martin MC, Asphahani F, Zhang MQ. Short peptides enhance single cell adhesion and viability on microarrays. Langmuir. 2007b;23:4472–9. doi: 10.1021/la062849k. [DOI] [PMC free article] [PubMed] [Google Scholar]
- Veiseh M, Veiseh O, Martin MC, Bertozzi C, Zhang M. Single-cell-based sensors and synchrotron FTIR spectroscopy: a hybrid system towards bacterial detection. Biosensors & Bioelectronics. 2007c;23:253–60. doi: 10.1016/j.bios.2007.04.010. [DOI] [PMC free article] [PubMed] [Google Scholar]
- Veiseh M, Wickes BT, Castner DG, Zhang M. Guided cell patterning on gold-silicon dioxide substrates by surface molecular engineering. Biomaterials. 2004;25:3315–24. doi: 10.1016/j.biomaterials.2003.10.014. [DOI] [PubMed] [Google Scholar]
- Veiseh M, Zareie MH, Zhang MQ. Highly selective protein patterning on gold-silicon substrates for biosensor applications. Langmuir. 2002;18:6671–8. [Google Scholar]
- Veiseh O, Gunn JW, Kievit FM, Sun C, Fang C, Lee JSH, Zhang MQ. Inhibition of Tumor-Cell Invasion with Chlorotoxin-Bound Superparamagnetic Nanoparticles. Small. 2009;5:256–64. doi: 10.1002/smll.200800646. [DOI] [PMC free article] [PubMed] [Google Scholar]
- Wang L, Yin HY, Xing WL, Yu ZY, Guo M, Cheng J. Real-time, label-free monitoring of the cell cycle with a cellular impedance sensing chip. Biosensors & Bioelectronics. 2010;25:990–5. doi: 10.1016/j.bios.2009.09.012. [DOI] [PubMed] [Google Scholar]
Associated Data
This section collects any data citations, data availability statements, or supplementary materials included in this article.