Abstract
In this paper we develop a computational model of the anatomy of a spinal cord. We address a long-standing ambition of neuroscience to understand the structure–function problem by modeling the complete spinal cord connectome map in the 2-day old hatchling Xenopus tadpole. Our approach to modeling neuronal connectivity is based on developmental processes of axon growth. A simple mathematical model of axon growth allows us to reconstruct a biologically realistic connectome of the tadpole spinal cord based on neurobiological data. In our model we distribute neuron cell bodies and dendrites on both sides of the body based on experimental measurements. If growing axons cross the dendrite of another neuron, they make a synaptic contact with a defined probability. The total neuronal network contains ∼1,500 neurons of six cell-types with a total of ∼120,000 connections. The anatomical model contains random components so each repetition of the connectome reconstruction procedure generates a different neuronal network, though all share consistent features such as distributions of cell bodies, dendrites, and axon lengths. Our study reveals a complex structure for the connectome with many interesting specific features including contrasting distributions of connection length distributions. The connectome also shows some similarities to connectivity graphs for other animals such as the global neuronal network of C. elegans. In addition to the interesting intrinsic properties of the connectome, we expect the ability to grow and analyze a biologically realistic spinal cord connectome will provide valuable insights into the properties of the real neuronal networks underlying simple behavior.
Keywords: tadpole, spinal cord, developmental approach, connections, axon growth
Introduction
A key to understanding the operation of any central nervous neuronal network is knowledge of the architecture of that network: where the neurons, dendrites, axons, and synapses are located in a three-dimensional structure. This detailed architecture of inter-neuronal connections provides a framework into which accumulated experimental information can be mapped. It may then be possible to model the activity of the network using these connections. In most cases, the morphology of nervous systems, or even regions of nervous systems, is highly complex, making it extremely challenging to define the real connection architecture of the component networks. Within the vertebrates, there is now extensive information on the brainstem and spinal cord neurons and networks that control locomotion (e.g., Ziskind-Conhaim et al., 2010; Kiehn, 2011). However, in all cases, the detailed architecture of these networks remains ill defined. The best understood locomotor networks have been described in lower vertebrates like the adult lamprey (Grillner, 2003), zebrafish larva (McLean and Fetcho, 2007), and frog tadpole (Roberts et al., 2010). Studying developing animals reminds us that all these networks have to self-assemble and grow appropriate connectivity. In an attempt to get insights into both the development and the connection architecture that it produces, we have used detailed experimental knowledge of the identity and synaptic connections of young tadpole spinal and brainstem neurons (Li et al., 2007) to model the “growth” of a biologically realistic connectome for this simple, vertebrate brainstem, and spinal cord network.
In the developing frog tadpole spinal cord, we have detailed information on the brainstem and spinal neurons active during swimming, their physiology, synaptic connections, and morphology (Roberts et al., 2010). On the basis of a large dataset of paired recordings, we proposed that the location or geography of axons and dendrites plays a fundamental role in establishing synaptic connectivity during early development (Li et al., 2007). Simple factors such as morphogen gradients controlling dorso-ventral soma, dendrite, and axon positions may constrain the synaptic connections made between different types of neuron sufficiently as the spinal cord first develops and in this way allow functional networks to form rapidly. For example, if “geographically” the dendrites of some neurons are located mainly dorsally while the axons of other neurons are located mostly ventrally, then it is unlikely that they will form synapses. This analysis implies that detailed cellular recognition between spinal neuron types may not be necessary for the reliable formation of functional networks which generate early behavior like swimming. If we model such mechanisms, the process of network formation is based on an interplay between deterministic and stochastic components. Repeated simulations of such a model result in different coupling architectures which nevertheless have many similarities and common features. The most important requirement is that different detailed connection patterns result in the same functionality, in the case of the tadpole spinal cord: a pattern of spiking activity corresponding to swimming.
We have used a “developmental” approach to modeling the connectome of the young Xenopus tadpole spinal cord, which means that connections are not prescribed but rather appear as a result of the developmental process of axon growth. A first, simplified mathematical model (Li et al., 2007; Borisyuk et al., 2008) was based on a non-linear system of difference equations with a random component. This model included only four parameters and was fitted to a wide variety of experimental measurements to reproduce successfully the patterns of axon growth of a number of different neuron types. Our model is based on experimental evidence from a database of anatomical and electrophysiological information which has been collected over 30 years (University of Bristol, Alan Roberts and Steve Soffe Lab). This information has now allowed us to construct a connectome using anatomical data to allocate positions of cell bodies, dendrites, and places where axons originate, and then to use an algorithm to grow the axons and to specify synaptic connections where axons cross dendrites. An important feature of this approach to axon growth is that these models are biologically realistic; statistical characteristics of the axons generated are not distinguishable from experimental measurements. Repetition of the axon growth results in generation of the complete connectome. The total modeled neuronal network contains nearly 2,000 neurons of six types with around 120,000 synapses. The anatomical model contains random components; therefore, each repetition of the reconstruction procedure generates a connectome which differs from others, though all networks show common features.
Studying and modeling the connectome of the tadpole spinal cord is interdisciplinary and involves diverse aspects from informatics, mathematics, and biology. In this paper we focus on methodological aspects of modeling the connectome which are relevant to neuroinformatics. Starting from our accumulated experimental data, we present a theoretical study in which we consider axon growth modeling, our reconstruction algorithm and analysis of the resulting connectome before providing a preliminary assessment of the possible significance of the connectome for understanding the functioning of the tadpole spinal cord. We are not, at this stage, describing a functional model of the spinal cord.
Materials and Methods
Experimental measurements for building a connectome model
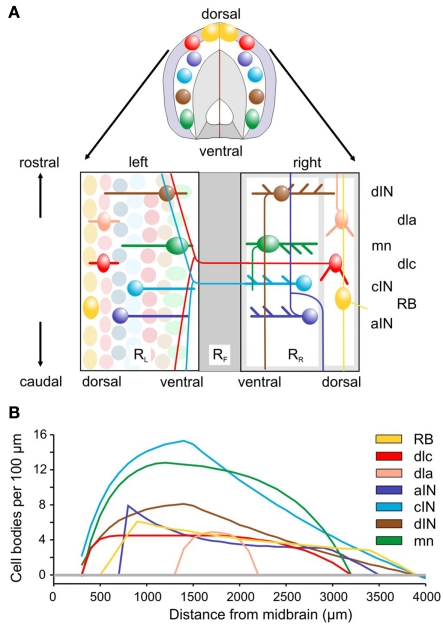
The anatomical details used to inform the connectome modeling were obtained using a variety of techniques. These details have been published previously but, since they are fundamental to construction of the connectome, they are briefly reviewed here. Most measurements were made in isolated nervous systems of chemically fixed tadpoles where individual neurons had been filled with neurobiotin. Filling was done using whole-cell recording electrodes. After the recording, tadpoles were fixed and processed to show the neurobiotin. The CNS was then removed and mounted between glass coverslips so that neurons could be viewed, traced, and photographed from either side at ×200 on a bright-field microscope (Li et al., 2002). This allowed identification of different types of neuron using their anatomical features and measurement of the dorso-ventral and longitudinal positions of their cell bodies, dendrites, and axonal processes when viewed from the side (Li et al., 2001, 2007). By joining together the left and right lateral views of the spinal cord along their ventral edge, we obtain views and data on neurons in a two-dimensional plan view of the CNS as if it had been opened along its dorsal midline (Figure 1A). Additional information was obtained by backfilling groups of neurons following application of the marker HRP to muscles or CNS and allowing it to travel up the axons to label cell bodies and dendrites. Some information was also obtained following immunocytochemical labeling for transmitters (glycine or GABA) or transcription factors (engrailed; Roberts et al., 1988; Roberts, 2000; Li et al., 2004).
Figure 1.
Spinal cord anatomy and experimental measurements. (A) A short length of spinal cord shown in section and after cutting down the dorsal midline and opening flat. Rectangles containing neurons represent the two sides (RL and RR), separated by the ventral floor plate (dark gray rectangle, RF). Examples of the cell body positions (ellipses), dendrites (thick lines), and axon projections (thin lines) are illustrated. Neuron types are listed on the right: RB, Rohon Beard sensory neuron; dla, dlc, dorsolateral ascending and dorsolateral commissural sensory interneurons; dIN, cIN, aIN, descending, commissural, and ascending premotor interneurons; mn, motoneurons. (B) Longitudinal distributions of neuron cell body numbers (per 100 μm). The curves show smoothed, theoretical distributions based on current anatomical estimates and updated from Li et al. (2001). The color coding indicated for each cell type is used throughout this paper.
Longitudinal distributions of somata for the populations of the main spinal cord neuron types are given in Yoshida et al. (1998), Roberts et al. (1999), and Li et al. (2002) and summarized in Figure 1B. The best estimates are based on immunocytochemistry (aIN and cIN). Other estimates are based on counts of neurons labeled anatomically following HRP backfilling (dIN, dlc, and MN), or following intracellular labeling with neurobiotin (dla). In each case the distribution is approximated by simple equations describing the numbers of cell bodies per 100 μm lengths of each side of the spinal cord.
As an initial measure of dendrite distributions, the dorsal and ventral-most extents of dendritic branching have been measured for a sample of neurons of each type. For each neuron, the dendritic field was assumed to extend evenly between these dorso-ventral extremes. Measurements of individual fields were then combined to provide an overall dorso-ventral distribution for each neuron type (Li et al., 2007).
Simple model of axon growth
In this Section we consider our simple mathematical model of axon growth (Li et al., 2007; Borisyuk et al., 2008). This model has been studied in detail and has been used here for generation of the connectome model of the whole spinal cord. For the convenience of the reader we include here a brief review of this simple model. For modeling axon growth, the tadpole spinal cord is considered as a horizontal cylinder, opened along the top (i.e., the most dorsal position) with, on each side, a very thin 10 μm layer (the marginal zone) separated ventrally by a further strip, the floor plate. We neglect the third dimension corresponding to the thickness of the marginal zone and, for modeling, consider the two sides of the spinal cord as two rectangles connected by the ventral floor plate (Figure 1A). Thus, positions within each rectangle are labeled by coordinates (x, y), where x corresponds the longitudinal axis giving rostro-caudal (RC) position along the body and y corresponds to the vertical, dorso-ventral (DV) axis. The size of each rectangle is standardized: 600 < x < 4,000, 0 < y < 100 (these units are given in micrometers). It is important to note that, for the young developing tadpole, this length corresponds to the majority of the CNS controlling motor behavior; it only omits more rostral regions concerned with some additional sensory functions.
A simple mathematical model is described by a system of three difference equations (i.e., time is discrete) corresponding to the growth angle θ and two positions of the growth cone, the structure which forms the tip of the growing axon and which characterizes the direction of growth. The rostro-caudal (RC) horizontal position (coordinate) is denoted by the x and the dorso-ventral (DV) vertical coordinate is denoted by y. These equations describe in mathematical notations a simple rule of axon growth: if the number of iterations is large then the growth angle tends to zero (flattening the axon trajectory) therefore the axon tends to grow horizontally at a prescribed DV position which is denoted by . The model also includes a random variable which perturbs the growth angle at each step of iterations (Li et al., 2007; Borisyuk et al., 2008).
The model equations are:
| (1) |
where, xn is the RC coordinate of the current axon position at the nth iteration, yn is the DV coordinate of the current axon position; θn is the current growth angle. Parameters are: The random variable ξn is independent and uniformly distributed in the interval (−α, α), where α is a parameter. Parameter Δ is the elongation of the axon in one iteration (Δ = 1 μm). The parameter γ characterizes the tendency of an axon to grow straight in a horizontal direction. The parameter represents the dorso-ventral position of an axon attractor and the parameter μ characterizes a rate of attraction.
This simple model is used below to reconstruct a connectome of the spinal cord. Parameter values were calculated using an optimization procedure to fit the model to available experimental measurements of both ascending and descending axons of different cell-types. The axon growth procedure does not start from the cell body so the initial portion of the axon is ignored (for details see Li et al., 2007 and Borisyuk et al., 2008).
Reconstruction algorithm for a connectome model
The connectome we describe includes almost all the spinal cord cell-types. Since these spinal neurons form populations that extend uninterrupted into the caudal part of the hindbrain, and since this caudal part of the hindbrain is needed for generating sustained locomotion (Li et al., 2006), we have included it in what we refer to as the spinal cord connectome. To model the connectome of the young tadpole spinal cord, we have used the simple axon growth model (see above) together with a new network reconstruction algorithm. Unlike the one reported previously (Borisyuk et al., 2008), networks on both sides of the spinal cord are reconstructed and biological data from experimental measurements have been used to assign distributions of cell bodies, dendrites, and axon lengths. Modeling the connectome began by assigning cell body distributions along the spinal cord; dendrites were added to these cell bodies and lastly axons were grown using our simple growth model.
The procedure for assigning cell body distribution is applied independently to left and right side of the CNS. The region of CNS being considered here is defined by RC coordinates from 600 to 4000 μm (measured from the tadpole midbrain; the region from 600 to ∼850 μm is caudal hindbrain, see above). The length of this region we divide to small spatial steps D = L/m, where L is the total length of the spinal cord (L = 3,400 μm) and m is the number of spatial steps (in our model the spatial step or a gap between cell bodies is D = 1.5 μm). The spinal cord is divided lengthwise into 34 subintervals (100 μm each) and the cell body distribution procedure is executed independently for each subinterval. Each subinterval has 100/D positions where neurons can be allocated; some of these positions will be empty. The goal is to allocate the neurons of different types in a random order within each subinterval keeping the prescribed number of neurons of each type (in fact, taken from experimental measurements). To reach the goal the following procedure is executed for each subinterval.
Suppose that cell-types are labeled by numbers: 1 – means RB cell-type, 2 – dlc cell-type, 3 – aIN cell-type, 4 – cIN cell-type, 5 – dIN cell-type, 6 – mn cell-type. First of all the number of cells of each type (1–6) inside the subinterval is calculated according to the longitudinal distribution of neuron cell body numbers (per 100 μm) which are denoted by n1,…,n6. Thus, neurons of cell type 1 (i.e., RB) are allocated at the first n1 positions with a gap D between neurons. Neurons of cell type 2 (i.e., dlc) are allocated at the next n2 positions with a gap D between neurons, etc. There will be some empty spaces inside the subinterval because the number of possible positions is larger than the total number of neurons inside the subinterval. After that the positions are shuffled. It means all pairs of consecutive positions (from low to higher coordinate) are swapped. More precisely, consider a pair of consecutive positions, e.g. (i, i + 1) where the position i is either occupied by a neuron of cell-type Qi or is empty and the (i + 1) position is either occupied by the neuron of cell-type Qi + 1 or is empty. Swap means that position i is occupied by either the neuron of cell-type Qi + 1 or is empty and the position (i + 1) is occupied either by the neuron of cell-type Qi or is empty. This shuffling procedure is repeated 10,000 times to provide a random uniform distribution of neurons and empty positions of different cell-types inside the subinterval.
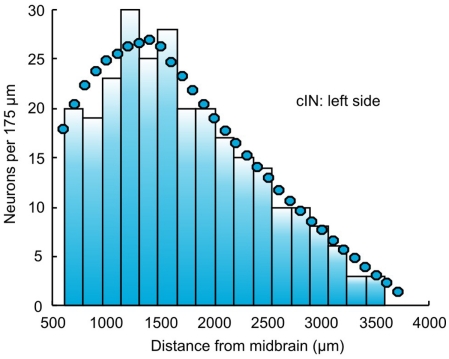
After filling all subintervals with appropriate numbers of neurons, the total number of neurons of each cell type can be calculated. These numbers, shown for one side of the body in Table 1, are then used to independently and randomly populate the other side of the spinal cord. Thus, the total number of neurons on one side is 944 and the total number of neurons in the spinal cord is 1,888. Figure 2 shows an example of the longitudinal distribution of cIN cells along the left side of the spinal cord.
Table 1.
Total neuron numbers per side.
| Cell type | # |
|---|---|
| 1 (RB) | 107 |
| 2 (dlc) | 86 |
| 3 (aIN) | 97 |
| 4 (cIN) | 271 |
| 5 (dIN) | 135 |
| 6 (mn) | 248 |
Figure 2.
The distribution of cIN neurons along the left side of the body. Bars indicate the connectome distribution (bin width is 175 μm); circles indicate the experimental estimate.
The dendrite of each neuron is allocated the same RC position as its cell body. The dendrite is represented by a vertical bar, the coordinates of whose ventral and dorsal extremes are randomly selected within the overall DV interval of 100 μm. Values are based on experimental measurements that provide distributions of pairs of low (l) high (h) DV coordinates for the dendrites of each cell-type: (lk, hk), k = 1,2,…K, where K is the total number of dendrite measurements for a given cell-type. These data are used to generate a random distribution of dendrite DV extents for each cell type.
Cell body and dendrite distributions are summarized in a text file. In this file, numbers of neurons on the left side range from 1 to 944 and the numbers of neurons on the right side range from 945 to 1,888. For each neuron the cell type is given as well as the rostro-caudal coordinate of the cell body (in a range from 600 to 4,000 μm). It is assumed that the RC coordinate of the cell body coincides with the RC coordinate of the dendrite. The DV position of the dendrite is represented by the most dorsal coordinate of the dendrite in μm and the most ventral coordinate of the dendrite in μm (in a range from 0 to 100). It should be noted that neurons of RB cell-type have no dendrites and, therefore, dorsal and ventral positions are set to zero.
Generation of axons and synaptic contacts
Once the neuron cell bodies and dendrites are positioned, the process of axon generation starts and axons are grown for each neuron. All axons are generated sequentially and independently from each other using our simple model of axon growth (see above; Li et al., 2007; Borisyuk et al., 2008).
To start growth of an axon the dorso-ventral coordinates of the initial point (x0, y0) and the initial angle of the axon growth (θ0) are specified. After that, by applying the iterative formulas (1), the first point of axon (x1, y1) will be generated and continuing these iterations the whole axon will be generated: (xi, yi), i = 0,1,2…,k, where k is the total number of points of the generated axon. In fact, the length of the generated axon is a random number where the shape of the random distribution is derived from the experimental measurements. Thus the number k corresponds to the selected axon length.
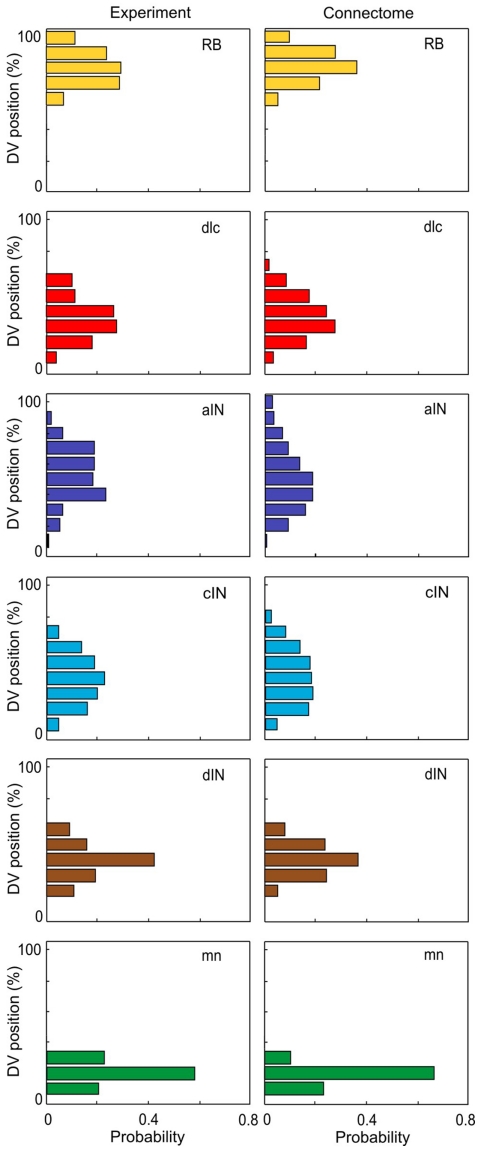
In the current version of the connectome reconstruction model, axon growth starts from a point whose RC coordinate is the same as the RC coordinate of the cell body. For commissural neurons (dlc and cIN) the initial stage of axon growth from the cell body to the ventral floor plate, crossing the floor plate and growing up the opposite side of the spinal cord to a branching point is not considered. Instead, the initial point of axon growth has the same RC coordinate as the cell body but on the opposite side. The DV coordinate of the start point, the initial angle of axon growth, and the length of generated axon are randomly selected based on distributions from experimental data (for details see Li et al., 2007). Equation 1 describe an iterative process of axon growth from the start point continuously to the prescribed the axon length. Each iteration increases the axon length by 1 μm. Because the iterative process includes a random component, different axons starting from the same initial conditions have different trajectories. Thus, each run of the connectome model generates a slightly different connectome. However, all generated connectomes have similar properties. The axon data are stored in a further text file. Figure 3 compares the DV distributions of experimentally measured axons (from Li et al., 2007) with those for generated axons in the connectome.
Figure 3.
Distributions of axon projections in the DV axis. There is a good match between distributions from experimental measurements (left, based on Li et al., 2007) and the connectome (right). In each case DV is divided into 10 bins.
Once the axons are grown for all the neurons, the connectome is completed by assigning the locations of synapses. Every time that a growing axon crosses the dendrite of another neuron, a synapse can form with a probability 0.46 (this value is based on experimental observations: Li et al., 2007). Information about all synapses is recorded to a text file. Thus, the connectome data are distributed between three text files which contain information on cell bodies and dendrites, axons, and synapses.
Results
Visualizing the tadpole spinal cord connectome
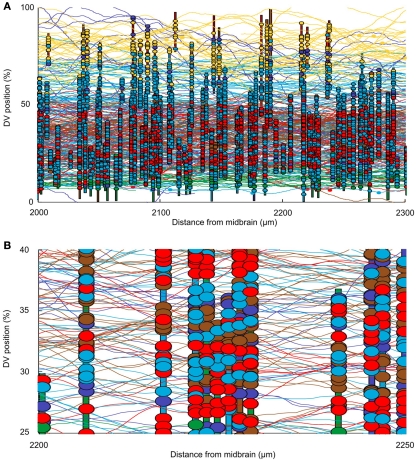
The connectome model shows a complex structure of connections. In this section we first present some approaches to visualization of the connectome. We then present some analysis to allow us to illustrate the kinds of information that the connectome model yields. In considering the spinal cord, some particular features of the connectome should be noted. For example, the fact that neurons are distributed on two sides of the spinal cord is very important; the cell bodies of dlc and cIN cell-types are located on one side but their axons project to the opposite side. The neurons of these cell-types therefore make their connections onto neurons on the opposite side. Figure 4A shows a fragment of the connectome for the left side and shows cell bodies, dendrites, axons, and synapses. It is clear that the dorsal part of the spinal cord (top in Figure 4A) visually appears predominantly “yellow” due a high number of RB axons. Similarly, the ventral part (bottom part of Figure 4A) visually appears predominantly “green” due to the fact that axons of motor neurons are allocated there. Figure 4B shows a close-up of the same fragment. It is clear that visualization of the connectome is a difficult problem and we plan to address this problem in more detail in a separate publication. All figures and graphs presented here are derived from one particular generated connectome because, although each reconstruction results in a new connectome, the statistical characteristics of each connectome are the same.
Figure 4.
Visualizing the connectome. (A) A 300-μm long region of the connectome showing the network on one side of the spinal cord. Note: this is ∼10% of the longitudinal extent of the model. Vertical colored bars indicate the dendrites of individual neurons; horizontal curved lines indicate the trajectories of grown axons. Dendrites and axons are color coded for cell type as in Figure 1. Small colored ellipses indicate individual synaptic contacts. In each case, the contact is color coded according to the presynaptic cell type. (B) A small fragment of one side of the connectome, color coded as in (A).
Schematically the connectome can be described in the following way. There are two networks, one on each side of the CNS: left side and right side networks. Each network contains 944 neurons of six cell-types. The left side network contains non-commissural neurons with mutual connections and commissural neurons which also receive connections from non-commissural neurons but send their connections to the right side network. The right side network has the same organization. Thus, the connectome model contains left side and right side networks of mutually coupled excitatory (RB, dIN, mn) and inhibitory (aIN) neurons and these two networks are connected by inhibitory commissural neurons (dlc and cIN cell-types).
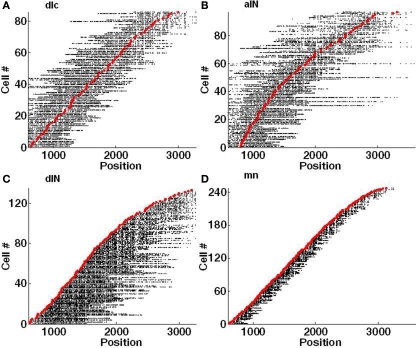
Each side of the connectome contains about 30,000 internal connections (both excitatory and inhibitory synapses) and there are about 30,000 inhibitory connections from left to right and the same from right to left. One way to visualize the pattern of outgoing synapses from the axons of neurons in the connectome is shown in Figure 5. This method of visualization summarizes the spatial distribution of synapses from the axons of individual neurons of each type along the length of the spinal cord. For example: it highlights a relatively local range of ascending and descending connections from dlc neurons compared with aINs (Figure 5A,B). A similar contrast can be made between the synapses from the descending axons of dINs and mns (Figures 5C,D). However, it is clearly difficult to resolve patterns of individual connections and again illustrates difficulties in visualizing the connectome.
Figure 5.
Visualization of individual axons with synapses. Each red marker shows the RC position of a soma and each horizontal line of black dots indicates the RC positions of individual synapses on each single axon. Synapses on the left of the soma are located on an ascending axon (toward the head) and synapses on the right side are located on a descending axon (toward the tail). (A) dlc. (B) aIN. (C) dIN; note that the ascending axons present on a few spinal cord dINs were not included in this connectome. (D) mn.
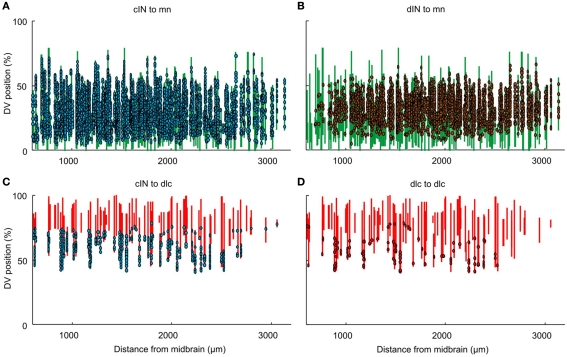
A second way to visualize the synapses in the connectome is from the perspective of the post-synaptic neurons, by mapping the incoming synapses onto their dendrites (Figure 6). This approach allows us to give a clear impression of the spatial distribution of incoming synapses. For example, it shows how synapses from cINs (on the opposite side) and dINs onto mns are generally more dense on neurons located rostral to ∼ 2,500 of the RC coordinate (Figures 6A,B). Also, while synapses between some neuron pairs span much of the DV extent of the dendrites, others (like those from cINs or dlcs onto other dlcs) are restricted to less dorsal dendrites (Figures 6C,D).
Figure 6.
Visualization of individual dendrites with synapses. Each vertical line of the figure corresponds to an individual dendrite. Dots indicate the DV positions of individual synapses. Dendrites and presynaptic contacts (dots) are color coded as in Figure 1. See text for details. (A) from cIN to mn. (B) from dIN to mn. (C) from cIN to dlc. (D) from dlc to dlc.
Analyzing the structure of the connectome
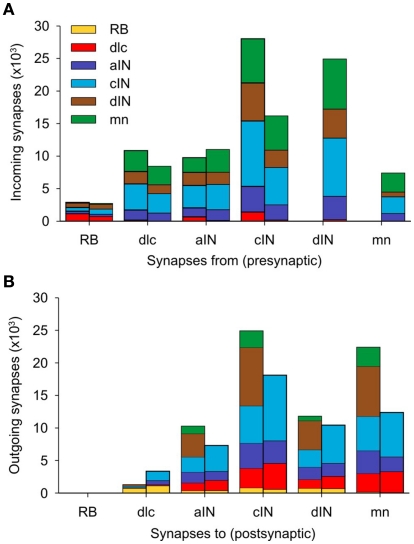
The total number of connections in the connectome is 122,221 of which 51,530 are ascending and 70,691 are descending. The distribution of these connections between neuron types is illustrated in Figure 7 and listed in Table 2 The largest number of outgoing connections (summation by rows in Table 2) is 44,221 made from cINs to other neurons (i.e., the number of synapses which are located on axons of cIN neurons). Among these connections from cIN neurons, the largest number (15,798) are onto other cIN neurons (on the opposite side). The next largest number (12,056) of connections from cIN are onto dendrites of motoneurons. Overall, the smallest number of outgoing connections is 5,613 from RB to neurons of other neuron types.
Figure 7.
Distribution of synapses in a single connectome model. (A) For each neuron type, the two stacked columns show outgoing synapses onto all other neuron types; post-synaptic neuron types (color coded as in Figure 1A) receive incoming synapses from descending axons (right columns) and ascending axons (left columns). (B) Like (A), but each stacked column shows the distribution of incoming synapses from all other cell-types, made via descending axons (left columns) and ascending axons (right columns). See Table 2 for data.
Table 2.
Distribution of connections between all types of presynaptic neurons and all post-synaptic neurons in the connectome.
| Presynaptic neurons | Post-synaptic neurons | Total from | |||||
|---|---|---|---|---|---|---|---|
| RB | dlc | aIN | cIN | dIN | mn | ||
| RB | 0 | 1,842 | 744 | 1,373 | 1,408 | 246 | 5,613 |
| dlc | 0 | 187 | 2,780 | 6,982 | 3,266 | 6,057 | 19,272 |
| aIN | 0 | 757 | 3,044 | 7,336 | 3,879 | 5,769 | 20,785 |
| cIN | 0 | 1,585 | 6,275 | 15,798 | 8,507 | 12,056 | 44,221 |
| dIN | 0 | 247 | 3,576 | 8,955 | 4,447 | 7,706 | 24,931 |
| mn | 0 | 0 | 1,169 | 2,573 | 718 | 2,939 | 7,399 |
| Total to | 0 | 4,618 | 17,588 | 43,017 | 22,225 | 34,773 | 122,221 |
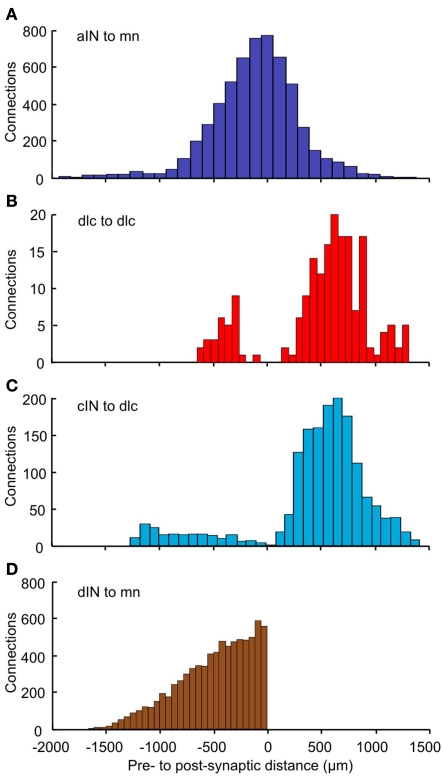
To analyze the pattern of incoming synaptic connections, we examined the distances from which particular neuron types receive incoming synapses from other particular types. These distances were calculated by the following procedure. A neuron of cell type p(p = 1,2,…6) was fixed. The longitudinal (RC) distances of all presynaptic neurons of cell type q(q = 1,2,…6) with sufficiently long axons to contact the fixed neuron were then calculated. We did not take into account distances between sides for neurons with commissural axons. Each histogram shows the distribution of distances from pre- to post-synaptic cells for neurons of cell-types p, q(p = 1,2,…6, q = 1,2,…6). These histograms show a variety of different distributions (Figure 8). The distribution of synapses from aIN to mn shows a simple distribution in which most connections are from neighboring neurons with numbers from more rostral and more caudal aINs decreasing with distance (Figure 8A). In contrast, connections onto dlcs from other dlcs at the same longitudinal position (though with cell bodies on the opposite side) are absent. Instead, connections, while relatively low overall, are broadly bimodal, being highest from some distance rostrally and caudally (Figure 8B). In a third example, connections from cINs to dlcs (again on opposite sides) are relatively few and are also roughly bimodal, but with an even stronger proportion of connections at some distance and particularly from more caudal cINs (Figure 8C). These types of differences will arise when axons change their DV position as they grow away from the cell body or have different DV positions when they grow in different directions. Synapses from dINs to mns are exclusively descending and decrease with distance (Figure 8D).
Figure 8.
Distributions of the number of connections as a function of distance. For each pair of neuron types, distance zero is the soma position of the post-synaptic neurons; the bars show the relative positions of the presynaptic neurons. Connections are shown: (A) from aIN to mn; (B) from dlc to dlc; (C) from cIN to dlc; (D) from dIN to mn. Colors (as in Figure 1) indicate the presynaptic neuron type. Bin widths: (A) = 111 μm; (B) = 67 μm; (C) = 90 μm; (D) = 55 μm.
As well as examining the patterns of incoming and outgoing synapses, we have used the connectome to explore the probabilities of connection between neurons of different types (Table 3). As an example, the first row shows the probabilities of connections from RB to all other cell-types (dlc, aIN, cIN, dIN, mn). These range from 0.33 (connections to dlc) down to 0.04 (connections to mn). Remarkably, contact probabilities derived from the connectome model correlate well (Pearson correlation coefficient 0.62; p < 0.001) with previous values obtained from experimental pairwise recordings of connections between different cell-types (Li et al., 2007). This correlation supports the view that the connectome model is biologically realistic.
Table 3.
Probabilities of connections between all types of presynaptic neurons and all post-synaptic neurons in the connectome.
| Presynaptic neurons | Post-synaptic neurons | |||||
|---|---|---|---|---|---|---|
| RB | dlc | aIN | cIN | dIN | mn | |
| RB | 0.00 | 0.33 | 0.13 | 0.24 | 0.25 | 0.04 |
| dlc | 0.00 | 0.01 | 0.14 | 0.36 | 0.17 | 0.31 |
| aIN | 0.00 | 0.04 | 0.15 | 0.35 | 0.19 | 0.28 |
| cIN | 0.00 | 0.04 | 0.14 | 0.36 | 0.19 | 0.27 |
| dIN | 0.00 | 0.01 | 0.14 | 0.36 | 0.18 | 0.31 |
| mn | 0.00 | 0.00 | 0.16 | 0.35 | 0.10 | 0.40 |
| total | 0.00 | 0.04 | 0.14 | 0.35 | 0.18 | 0.28 |
General properties of the tadpole spinal connectome
In addition to details of the distributions of neurons, their axons and particularly their synaptic connections, the connectome model can also be analyzed to allow comparison with connections found in other systems.
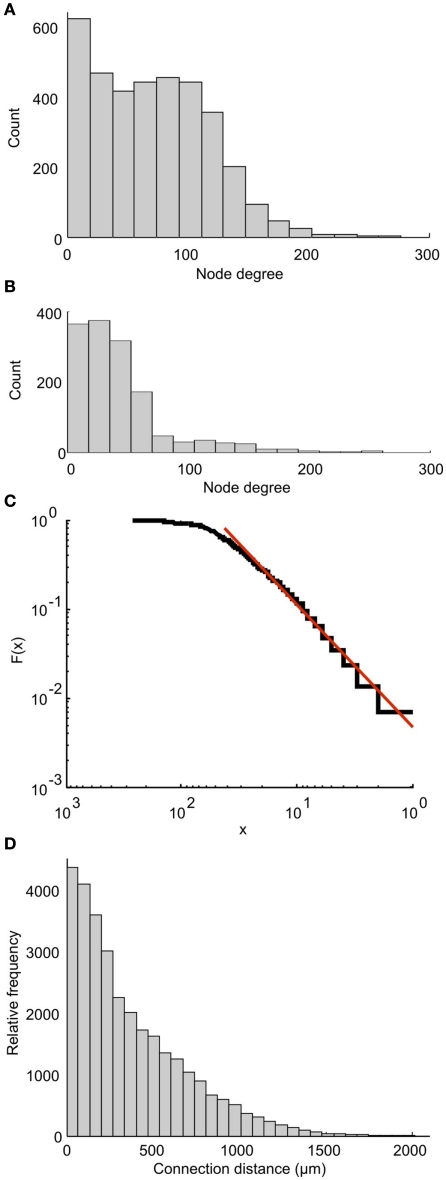
Each part of the connectome on either side of the CNS can be characterized as a scale-free network. This property was shown by calculating the degree distribution of the connectome in which the nodes are individual neurons. Each node’s degree is defined as the total number of connections (incoming plus outgoing) for each node. The degree distribution of a scale-free network follows a power law. Figure 9A shows the distribution of node degree for the whole connectome. It is clear that this distribution is very different from the power law. However, the distribution for one side of the connectome (Figure 9B) is very similar to the power law. A plot of cumulative function (on a log scale) can be closely approximated by a straight line (Figure 9C), showing that the networks on each side of the tadpole spinal connectome are of the scale-free type. Including both sides of the spinal cord destroys the free-scale nature.
Figure 9.
Properties of the connectome. Node degree distributions for the whole connectome (A) and one side of the connectome (B) show that only the network on one side shows a distribution similar to the power law, and is therefore scale-free. (C) The cumulative function from (B) (blue) and a linear approximation (red) plotted on a log scale. (D) The overall distribution of connection distances for synapses between neurons on a single side of the tadpole connectome.
We have also analyzed the distribution of overall connection lengths, combining lengths from all neuron types and ignoring the direction of connection. It has recently been shown that this distribution is similar for different neural networks of different animals (Kaiser et al., 2009). In the tadpole spinal cord connectome, connection distances ranged from 1.5 to 1941 μm (Figure 9D). The distribution is similar to the connection length distribution for the large network of C. elegans (see Figure 2D of Kaiser et al., 2009). Fitting a Gamma Distribution gives the shape parameter a = 0.53 and scaling parameter b = 0.06 for the tadpole (compared with a = 0.541 and b = 0.419 for C. elegans).
Lastly, the edge density (or connectivity) characterizes how many potential connections between network nodes are really present. For a directed network, each of N nodes can be connected with some other nodes where the number of other nodes ranges from 0 to (N − 1). The formula for the edge density is d = E/[N(N − 1)], where E is the number of directed connections present in the network; N is the number of nodes (neurons; Kaiser, 2011). The edge density of the tadpole connectome is 0.03 or 3%. This figure is comparable with the edge density of C. elegans (Kaiser, 2011), which is 3.85% (for corticocortical connections of the mammalian brain, the edge density ranges from 10 to 30%).
Discussion
A key feature of the connectome modeling that we describe here is that it is based on detailed (though of course still not complete) knowledge of the neuronal components of the comparatively simple tadpole nervous system (Roberts et al., 2010). Furthermore, this nervous system belongs to a very simple animal at an early point in its development, but one with a well-defined set of simple behavioral responses. These features are important for several reasons. Firstly, we have already been able to base construction of the connectome on detailed biological data. Secondly, we can compare the connectivity with real patterns of synaptic contact between the component neuron types. Thirdly, we have the possibility of interpreting the connectome in terms of its known biological function(s) in generating behavior.
With the exception of C. elegans (White et al., 1986) and perhaps the crustacean stomatogastric nervous system (see: Harris-Warrick et al., 1992), it has not yet been possible to reveal a whole connectome purely through experimental analysis. The modeled connectome on the other hand allows us to consider features of the whole network as well as to peer in to look at individual neurons. Obvious values of the connectome model are as a source of predictions for future experiments and in perhaps revealing unexpected properties. For example, a striking difference was revealed in the patterns of longitudinal distance from which neurons can receive incoming synapses. Unexpectedly, and in contrast to other connections, the largest numbers of incoming synapses to dlc neurons from other dlc neurons or cIN neurons on the opposite side are not from neurons at the same longitudinal position but from some distance more caudal. The biological significance of this is not immediately clear, but it must now be considered. Testing predictions will in turn allow us to refine the model.
One simple prediction from the connectome is the number of synapses an individual neuron is likely to receive. In the case of motoneurons, this can be compared to an independent experimental estimate. Assuming an equal distribution of synapses, the connectome would predict an average number of synapses per mn as: total synapses onto mn (34,773) per total mn (496) = 70 synapses. An experimental estimate based on combined light and electron microscopy data estimated an overall average of 118–236 per mn depending on synapse spacing on each dendrite (Roberts et al., 1999). Two factors which could explain the lower prediction from the connectome are axons contacting the motoneurons from outside the region modeled (descending from the brain) or underestimating the extent of the mn dendritic tree (see below). Given the uncertainties, this reasonable match between prediction and observation reinforces our confidence that the connectome model is biologically realistic.
The tadpole connectome model describes neuronal networks connecting between the two sides of the CNS. Biologically, this interconnection underpins control of motor responses like rhythmic swimming which alternate on left and right sides (Roberts et al., 2010). An extension of the connectome model is therefore to use the connectivity revealed to produce a functional model of swimming. Although the details are beyond the scope of the present paper, it has now been possible to combine the network structure of the connectome with Hodgkin–Huxley-type model neurons to produce a functional network for swimming. Although at an early stage, this preliminary functional model is able to “swim,” generating rhythmic firing of the relevant neuron populations in a sequence that alternates between sides and progresses down the body on each cycle, mimicking the properties of real swimming behavior.
Modeling the connectome of the tadpole is clearly an ongoing process and very much linked to accumulating the biological data that is needed to guide its construction. We are in the process of introducing what is the next stage in axon growth modeling, a gradient model of axon guidance. The importance of this new model will be its greater basis in biological reality, replacing rather artificial parameters of growth with more realistic responses to morphogen gradients. A further addition to be introduced when suitable biological data are available will be a more realistic description of the dendritic branches of the various spinal cord neuron types. It is likely that this will alter the DV pattern of connections, but it is too soon to predict whether the change will be rather subtle or more significant.
The construction and analysis of models of nervous system networks continues to be an area of huge interest (e.g., see: Bullmore and Sporns, 2009; Cahalane et al., 2011; Prettejohn et al., 2011). Many studies aim to understand the properties of highly complex areas of the nervous system, typically regions of the adult brain, where the detailed experimental information is still very limited and, of necessity, the analysis remains primarily theoretical. It is important to stress that the strength of our approach lies in the way we can use our considerable biological knowledge of a relatively simple system to grow our networks with realistic connectivity using simple rules of axon growth and synapse formation. This situation has allowed us to aim for a close match between the modeled network and real biology.
Conflict of Interest Statement
The authors declare that the research was conducted in the absence of any commercial or financial relationships that could be construed as a potential conflict of interest.
Acknowledgments
This work is supported by BBSRC grants (BB/G006369/1 and BB/G006652/1).
References
- Borisyuk R., Cooke T., Roberts A. (2008). Stochasticity and functionality of neural systems: mathematical modelling of axon growth in the spinal cord of tadpole. Biosystems 93, 101–114 10.1016/j.biosystems.2008.03.012 [DOI] [PubMed] [Google Scholar]
- Bullmore E., Sporns O. (2009). Complex brain networks: graph theoretical analysis of structural and functional systems. Nat. Rev. Neurosci. 10, 186–198 10.1038/nrn2618 [DOI] [PubMed] [Google Scholar]
- Cahalane D. J., Clancy B., Kingsbury M. A., Graf E., Sporns O., Finlay B. L. (2011). Network structure implied by initial axon outgrowth in rodent cortex: empirical measurement and models. PLoS ONE 6, e16113. 10.1371/journal.pone.0016113 [DOI] [PMC free article] [PubMed] [Google Scholar]
- Grillner S. (2003). The motor infrastructure: from ion channels to neuronal networks. Nat. Neurosci. 4, 573–586 10.1038/nrg1139 [DOI] [PubMed] [Google Scholar]
- Harris-Warrick R. M., Marder E., Selverston A. I., Moulins M. (eds). (1992). Dynamic Biological Networks: The Stomatogastric Nervous System. Cambridge: MIT Press [Google Scholar]
- Kaiser M. (2011). A tutorial in connectome analysis: topological and spatial features of brain networks. Neuroimage 57, 892–907 10.1016/j.neuroimage.2011.05.025 [DOI] [PubMed] [Google Scholar]
- Kaiser M., Hilgetag C., van Ooyen A. (2009). A simple rule for axon outgrowth and synaptic competition generates realistic connection lengths and filling fractions. Cereb. Cortex 19, 3001–3010 10.1093/cercor/bhp071 [DOI] [PubMed] [Google Scholar]
- Kiehn O. (2011). Developmental and functional organization of spinal locomotor circuits. Curr. Opin. Neurobiol. 21, 100–109 10.1016/j.conb.2010.09.004 [DOI] [PubMed] [Google Scholar]
- Li W.-C., Cooke T., Sautois B., Soffe S. R., Borisyuk R., Roberts A. (2007). Axon and dendrite geography predict the specificity of synaptic connections in a functioning spinal cord network. Neural Dev. 2, 17. 10.1186/1749-8104-2-17 [DOI] [PMC free article] [PubMed] [Google Scholar]
- Li W.-C., Higashijima S., Parry D. M., Roberts A., Soffe S. R. (2004). Primitive roles for inhibitory interneurons in developing frog spinal cord. J. Neurosci. 24, 5840–5848 10.1523/JNEUROSCI.1370-04.2004 [DOI] [PMC free article] [PubMed] [Google Scholar]
- Li W.-C., Perrins R., Soffe S. R., Yoshida M., Walford A., Roberts A. (2001). Defining classes of spinal interneuron and their axonal projections in hatchling Xenopus tadpoles. J. Comp. Neurol. 441, 248–265 10.1002/cne.1410 [DOI] [PubMed] [Google Scholar]
- Li W.-C., Soffe S. R., Roberts A. (2002). Spinal inhibitory neurons that modulate cutaneous sensory pathways during locomotion in a simple vertebrate. J. Neurosci. 22, 10924–10934 [DOI] [PMC free article] [PubMed] [Google Scholar]
- Li W.-C., Soffe S. R., Wolf E., Roberts A. (2006). Persistent responses to brief stimuli: feedback excitation among brainstem neurons. J. Neurosci. 26, 4026–4035 10.1523/JNEUROSCI.4720-05.2006 [DOI] [PMC free article] [PubMed] [Google Scholar]
- McLean D. L., Fetcho J. R. (2007). Using imaging and genetics in zebrafish to study developing spinal circuits in vivo. Dev. Neurobiol. 68, 817–834 10.1002/dneu.20617 [DOI] [PMC free article] [PubMed] [Google Scholar]
- Prettejohn B. J., Berryman M. J., McDonnell M. D. (2011). Methods for generating complex networks with selected structural properties for simulations: a review and tutorial for neuroscientists. Front. Comput. Neurosci. 5:11. 10.3389/fncom.2011.00011 [DOI] [PMC free article] [PubMed] [Google Scholar]
- Roberts A. (2000). Early functional organisation of spinal neurons in developing lower vertebrates. Brain Res. Bull. 53, 585–593 10.1016/S0361-9230(00)00392-0 [DOI] [PubMed] [Google Scholar]
- Roberts A., Dale N., Ottersen O. P., Storm-Mathisen J. (1988). Development and characterization of commissural interneurons in the spinal cord of Xenopus laevis embryos revealed by antibodies to glycine. Development 103, 447–461 [DOI] [PubMed] [Google Scholar]
- Roberts A., Li W.-C., Soffe S. R. (2010). How neurons generate behaviour in a hatchling amphibian tadpole: an outline. Front. Behav. Neurosci. 4:16. 10.3389/fnbeh.2010.00016 [DOI] [PMC free article] [PubMed] [Google Scholar]
- Roberts A., Walford A., Soffe S. R., Yoshida M. (1999). The motoneurons of the axial swimming muscles in hatchling Xenopus tadpoles: their features, distribution and central synapses. J. Comp. Neurol. 411, 472–486 [DOI] [PubMed] [Google Scholar]
- White J. G., Southgate E., Thomson J. N., Brenner S. (1986). The structure of the nervous system of the nematode Caenorhabditis elegans. Philos. Trans. R. Soc. B Lond. Biol. Sci. 314, 1–340 10.1098/rstb.1986.0056 [DOI] [PubMed] [Google Scholar]
- Yoshida Y., Roberts A., Soffe S. R. (1998). Axon projections of reciprocal inhibitory interneurons in the spinal cord of young Xenopus tadpoles and implications for the pattern of inhibition during swimming and struggling. J. Comp. Neurol. 400, 504–518 [DOI] [PubMed] [Google Scholar]
- Ziskind-Conhaim L., Fetcho J. R., Hochman S., MacDermott A. B., Stein P. S. G. (eds). (2010). Neurons and Networks in the Spinal Cord. Oxford: Blackwells [Google Scholar]


