

Abstract
Mutations of the neurofibromin gene (NF1) cause neurofibromatosis type 1 (NF1), a disease in which learning disabilities are common. Learning deficits also are observed in mice with a heterozygous mutation of Nf1 (Nf1+/−). Dysregulation of regulated neurotransmitter release has been observed in Nf1+/− mice. However, the role of presynaptic voltage-gated Ca2+ channels mediating this release has not been investigated. We investigated whether Ca2+ currents and transmitter release were affected by reduced neurofibromin in Nf1+/− mice. Hippocampal Ca2+ current density was greater in neurons from Nf1+/− mice and a greater fraction of Ca2+ currents was activated at less depolarized potentials. In addition, release of the excitatory neurotransmitter, glutamate, was increased in neuronal cortical cultures from Nf1+/− mice. Dendritic complexity and axonal length were also increased in neurons Nf1+/− mice compared to wild-type neurons, linking loss of neurofibromin to developmental changes in hippocampal axonal/cytoskeletal dynamics. Collectively, these results show that altered Ca2+ channel density and transmitter release, along with increased axonal growth may account for the abnormal nervous system functioning in NF1.
Keywords: Neurofibromin, N-type calcium channels/CaV2.2, Glutamate release, Hippocampus, Axonal growth, Sholl analysis
1. Introduction
Neurofibromatosis type 1 (NF1) affects an estimated 1 in 3000 people worldwide. NF1 is caused by a heterozygous mutation in the gene encoding neurofibromin, a Rasspecific GTPase-activating protein (Ras GAP). Neurofibromin attenuates activity of Ras-mediated signaling by activating the hydrolysis of Ras-GTP to inactive Ras-GDP. Neurofibromin mutations result in increased Ras activity which causes a spectrum of clinical manifestations – benign tumors, bone defects, and vascular malformations. Almost 50% of people with NF1 have deficits in cognitive function, which may include learning disabilities, attentional disorders, and altered visual-spatial skills [1]. These behavioral abnormalities are recapitulated in a mouse strain with a germ line mutation in the Nf1 gene (Nf1+/−) [2–4] and Nf1 null Drosophila [5]. A homozygous mutant mouse for Nf1 was also created; however, the double knock-out of the Nf1 gene was found to be embryonic lethal [2]. Because the Nf1+/− mouse expresses about half the amount of functional neurofibromin protein compared to wildtype mice and is a close representation of the human disease, it provides a powerful genetic model for delineating the signaling pathways affected in NF1.
The learning deficits seen in the Nf1+/− mice include difficulties in spatial learning and decreased hippocampal long-term potentiation (LTP) [6], a cellular mechanism of memory and learning. Although the mechanisms by which reduced neurofibromin function culminates in defects in hippocampal LTP and subsequent deficits in cognition and learning are not well understood, several lines of evidence suggest a multifactorial etiology. Genetic restoration of Ras activity to normal levels corrects the learning deficits and gamma-aminobutyric acid (GABA) receptor antagonists restore LTP to normal levels in these mice [6]. Impairments in synaptic connectivity may account for 4 these LTP deficits. In support of this notion, several studies have suggested that neurofibromin also plays a key role in neuronal differentiation and actin cytoskeletal reorganization [7]. The GAP related domain (GRD) of neurofibromin is important in neuronal differentiation since expression of a dominant negative form of neurofibromin GRD in hippocampal neurons resulted in reduced axonal and dendritic branching/extension [7].
It is well established that entry of Ca2+ into presynaptic terminals through Ca2+ channels is an essential step in the neurotransmitter release cascade [8,9]. Consequently, the modulation of Ca2+ channel activity by intracellular messengers/proteins is a fundamental cellular mechanism for regulating synaptic transmission. However, to date there have been no studies addressing if calcium channel activity is altered in neurons from neurofibromin deficient mice. Using whole cell voltage clamp analysis, it was shown that potassium currents are altered in neurofibromin deficient Schwann cells [10–12], and a recent study demonstrated augmented sodium currents in sensory neurons from Nf1+/− mice [13]. Here, we examined the complement of calcium channels underlying transmitter release in hippocampal neurons from wildtype and Nf1+/− mice. We also tested if loss of neurofibromin caused impairments in synaptic connectivity in cortical neurons. Our results show that increased Ca2+ currents and transmitter release, along with increased axonal length and dendritic complexity may contribute to learning and memory deficits observed in NF1.
2. Experimental Procedures
2.1 Primary hippocampal neuronal cultures
Procedures involving animals and their care were in accordance with the Guide for the Care and Use of Laboratory Animals (National Institutes of Health publication 85-23, Bethesda, MD, USA) and approved by the Institutional Animal Care and Use Committee of the Indiana University School of Medicine. Mice heterozygous for the Nf1 mutation on a background of C57BL/6J were originally developed by Dr. Tyler Jacks [2]. Wildtype C57BL/6J and Nf1+/− mice littermates were housed and bred in the Indiana University Laboratory Animal Research Center. Mouse hippocampal neuron cultures were prepared from hippocampi dissected from postnatal day 1 (PN1) wild-type or Nf1+/− mice as described previously [14,15]. Cells were cultured in growth media which consisted of Neurobasal medium containing 2% NuSerum, 5% NS21 [16], supplemented with penicillin/streptomycin (100 U/ml; 50 μg/ml), 0.1 mM L-Glutamine and 0.4 mML-glutamax (Invitrogen). The antimitotic agent Cytosine β-Darabinofuranoside (5 μM; Sigma) was added 24–36 h after plating to reduce the number of non-neuronal cells.
2.2 Primary cortical neuronal cultures
Primary cortical cultures containing both glia and neurons were prepared from PN1 wildtype and Nf1+/− mice as described [15]. Following an aseptic dissection of cerebral cortices, the olfactory bulb and meninges were removed, and cortices were minced and incubated for 20–25 min at 37°C in Papain solution as described above. The enzymatically dissociated tissue was then rinsed twice with Hank’s balanced salt solution (HBSS) lacking Ca2+ and Mg2+. Cells were dissociated by trituration and isolated as described above for hippocampal neurons. Cells were plated at a density of ~2 hemispheres per three 24-well plates or approximately 250,000 to 300,000 cells. Cells were fed twice a week with growth media (500 μl/well) and at 3–5 days in vitro (DIV) they were treated with cytosine β-D-arabinofuranoside (5 μM) to eliminate the dividing glia from the cultures. The cultures were used for release experiments at 7–10 DIV.
2.3 Synaptosome isolation from wild-type and Nf1+/− mice
Synaptosomes were prepared from brains of juvenile wild-type and Nf1+/− mice [14] and were lysed in NF1 lysis buffer [17] containing 20 mM Tris-HCl, pH7.5, 5 mM MgCl2, 150 mM NaCl, 1 mM EDTA, and 0.1% Nonidet P-40 (NP-40/Igepal), and supplemented with freshly added protease and phosphatase inhibitors: 1 μg/ml leupeptin, 2 μg/ml aprotinin, 1 mM PMSF together with a protease inhibitor cocktail (Roche Applied Science) and 2 mM sodium orthovanadate. Protein concentration was determined using a BCA assay (Thermo Fisher Scientific, Shelbyville, IN) and fractions were stored at −80°C until use.
2.4 Whole-cell patch-clamp recordings
Whole-cell voltage recordings were performed at room temperature on primary cultured hippocampal neurons using an EPC 10 Amplifier (HEKA Electronics, Germany) as described before [14]. Electrodes were pulled from thin-walled borosilicate glass capillaries (Warner Instruments, Hamden, CT) with a P-97 electrode puller (Sutter Instrument, Novato, CA) such that final electrode resistances were 2–3 MΩ when filled with internal solutions. The internal solution for recording total Ca2+ currents contained (in mM): 110 CsCl, 5 MgSO4, 10 EGTA, 4 ATP Na2-ATP, and 25 HEPES (pH 7.2, 290–310 mOsm/l). The external solution contained (in mM): 128 NaCl, 5 KCl, 10 TEA-Cl, 10 BaCl2, 1 MgCl2, 10 D-glucose, and 10 HEPES (pH 7.3, 310–315 mOsm/l). For recording N-type and P/Q-type Ca2+ currents, 1 μM TTX and 10 μM nifedipine were added just to this solution before use to block voltage-gated Na+ and L-type Ca2+ channels, respectively.
Whole-cell capacitance and series resistance were compensated with the amplifier. Series resistances compensation (70–80%) was routinely applied. Cells were considered only when the seal resistance was more than 1GΩ and the series resistance was less than 10 MΩ. Linear leak currents were digitally subtracted by P/4. Statistical differences between the recordings from the two genotypes were determined by using either a Student’s t-test or an ANOVA. When a significant difference was obtained with an ANOVA, post hoc analyses were performed using a Tukey test. Values of p<0.05 were judged to be statistically significant.
2.5 Data acquisition and analysis
Signals were filtered at 10 kHz and digitized at 10–20 kHz. Analysis was performed using Fitmaster and origin8.1 (OriginLab Corporation, MA). For activation curves, conductance (G) through ion (Na+ and Ca2+) channels was calculated using the equation G= I/(Vm −Vrev), where Vrev is the reversal potential, Vm is the membrane potential at which the current was recorded, and I is the peak current. Activation and inactivation curves were fitted to a Boltzmann function G/Gmax = 1/{1+exp[(V−V50/k]}, where G is the peak conductance, Gmax is the fitted maximal G, V50 is the half-activation voltage, and k is the slope factor. Additional details of specific pulse protocols are 8 described in the results text or figure legends. The electrophysiologist was blinded to the genotype of the neurons.
2.6 Glutamate release
Glutamate released from wild-type and Nf1+/− cortical neurons was measured using the Amplex Red glutamic acid/glutsamate oxidase assay kit (Invitrogen) as per the manufacturer’s instructions. In this assay, L-glutamic acid is oxidized by glutamate oxidase to produce α-ketoglutarate, NH3 and H2O2. H2O2 reacts with the Amplex Red reagent in a 1:1 stoichiometry in a reaction catalyzed by horseradish peroxidase (HRP) to generate the highly fluorescent product resorufin. After 30 minutes, fluorescence of resorufin was measured in a Victor3 V multilabel plate reader (Perkin Elmer, Shelton, CT) using excitation at 530 nm and emission at 590 nm.
To generate samples, neurons growing in 12-well plates were washed three times (300 μl each) with non-depolarizing buffer (119 mM NaCl, 2.5 mM KCl, 2 mM CaCl2, 2 mM MgCl2, 25 mM HEPES, and 30 mM D-Glucose). A 100 μl sample was collected after the third wash for basal samples. After a 15 minute stimulation with depolarizing buffer (32 mM NaCl, 90 mM KCl, 2 mM CaCl2, 2 mM MgCl2, 25 mM HEPES, and 30 mM D-Glucose), 100 μl of culture supernatant was collected and stored at −20°C. Finally, neurons were bathed in non-depolarizing buffer for 15 min to reestablish resting levels. The non-transportable glutamate transporter inhibitor DL-threo-β-benzyloxyaspartate (DL-TBOA; 500 μM) was present during the stimulation to prevent reuptake of released glutamate [18]. The remaining glutamate content in each well was determined by exposing the cells to 2% Triton X-100 in non-depolarizing buffer. The glutamate released during the 15 min stimulation period is expressed as percent of the total content. Standard curves for the assay with known concentrations of exogenous glutamate demonstrated high reproducibility and sensitivity of the assay, up to concentrations of 15 fmol glutamate. Standard curves were constructed for each assay. The concentrations of K+ and time period for stimulation were chosen because they lie on the middle of the sloped portion of the concentration response curve for KCl-stimulated glutamate release. In additional control experiments, the general Ca2+ channel blocker CdCl2 (500 μM) blocked basal and K+-stimulated glutamate release (not shown). A minimum of seven different animals were used for each genotype.
2.7 Morphology analysis: neurite/dendrite outgrowth and Sholl analysis of dendritic complexity
Neurite outgrowth was determined from low-density hippocampal neurons transfected with EGFP using Lipofectamine as described [14]. The morphometric analysis of neurite lengths of transfected green fluorescent cells was performed with Nikon Elements software by measuring neurites from neurons with a process longer than one neuronal cell body diameter [19]. In hippocampal cultures at 7 DIV, axons extending processes >20 μm at orthogonal angles to the axon were characterized as branches. Additionally, axons were identified by immunolabeling with tau 1 antibodies (not shown). Over-expression of enhanced green fluorescent protein (EGFP) facilitated these analyses as EGFP expressing neurons could be optically identified and their axonal arborization could be easily assessed (see Figure 4A).
Figure 4.

Increased dendritic complexity and axon lengths in Nf1 mice. (A) Representative inverted black and white images of hippocampal neurons, from wild-type (Nf1+/+) and Nf1+/− mice, 48 h after transfection with EGFP. (B) Dendritic branching was calculated by Sholl analysis [20], which measures the number of neurites crossing concentric circles (intersections or branch points) at various radial distances from the cell soma. Sholl analysis of low-density cultures of hippocampal neurons (n=18–28 per condition from at least four separate animals) transfected at 5 DIV (and grown for 48h) revealed a significant increase in the number of processes, reaching a peak of ~20 crossings at about 200–250 μm from the soma in neurons from Nf1+/− mice compared with Nf1+/− mice which reached a peak crossing of 12 (*, p <0.05 vs. Nf1 neurons at each distance between 150 and 225 μm; Student’s t- test). (C) Length of axons was determined 48 h after transfection using ImageJ analysis software. At least 18 neurons (from ≥ 4 separate animals) were analyzed, in a blinded manner for each condition. Neurons from Nf1+/− mice had greater axon lengths compared with wild-type neurons (*, p <0.05, Student’s t-test).
Sholl analysis [20] was performed with ImageJ using an automated Sholl analysis plugin, in which the soma boundary is approximated by an ellipsoid and dendrite intersections are assessed at radial distances from the soma [19]. This technique measures the number of neurites crossing concentric circles (denoted as intersections or branch points) at various radial distances from the cell soma. This consecutive-circles (cumulative intersection) analysis specifies dendritic geometry, ramification richness, and dendritic branching patterns. The dendritic tree was examined in 10 μm increments. Processes arising from the soma or from higher-order dendritic segments that were shorter than 3 μm were rejected because they could not be distinguished from filopodia. Each neuron that fit these criteria was imaged and analyzed by an investigator blind to the genotype conditions. At least 18 neurons and at least 300 intersections (from ≥4 separate animals) were analyzed, in a blinded manner for each condition. All statistical analysis was performed via parametric and/or nonparametric analyses, as appropriate, with a minimum significance level set at P<0.05.
3. Results
3.1 Calcium channel density is higher in hippocampal neurons from Nf1+/− mice
Using whole-cell patch clamp electrophysiology, we tested for total Ca2+ current properties in primary hippocampal neurons from postnatal day 1 wild-type and Nf1+/− mice cultured for 5–7 days in vitro (DIV). When stimulated from a holding potential of −80 mV, 200 msec depolarizing step potentials more positive than −50 mV elicited an inward current (Figure 1A, B). Representative activating and rapidly inactivating voltage-dependent inward currents from a wild-type (top traces) and Nf1+/− neuron (lower traces) are shown in Figure 1A. A summary of the mean peak current density versus voltage plot revealed an increase in the mean Ca2+ current density in neurons from Nf1+/− mice (Figure 1B, C) as well as an ~13 mV shift in the estimated reversal potential of the Ca2+ current (Figure 1B). At 5–7 DIV, the Ca2+ current density was ~75% higher in neurons from Nf1+/− versus wild-type mice: 37.7 ± 4.2 (n=9) versus 21.5 ± 3.7 (n=10) pA pF−1 (Vt=0 mV, p<0.05, Student’s t-test).
Figure 1.

Total Ca2+ current density is higher in neurons from Nf1+/− mice. (A) Exemplar current traces obtained from a hippocampal neuron from wild-type (top traces) and Nf1+/− mice (bottom traces) in response to 200 ms steps in 5 mV increments applied from a holding potential of −80 mV as shown in the voltage protocol. For clarity, current traces are shown for every 10 mV step between −55 and +35 mV. Line labeled 0 indicates the zero-current level. (B) Summary of current-versus-voltage (I–V) relationship for neurons from wild-type (open squares) and Nf1+/− mice (filledsquares). Peak currents were normalized to cell capacitance. (C) Peak current density at 0 mV was significantly higher in neurons from Nf1+/− mice (*, p < 0.05, Student’s t-test). Summary of normalized current versus voltage relationship for activation (D) and inactivation (E) of Ca2+ current gating in neurons from wild-type (open squares, n=10) and Nf1+/− mice (filled squares, n=9). Neither V50% of inactivation nor the slope values derived from the Boltzmann fits of the data revealed any significant differences between the two genotypes (see Results for further details).
Next, we examined voltage-dependent properties of activation and inactivation in 5–7 DIV hippocampal neurons from Nf1+/− versus wild-type mice. The steady-state activation of Ca2+ channels from Nf1+/− versus wild-type mice neurons was well described by the Boltzmann relation (see Experimental Procedures). As shown in Figure 1D, for wild-type neurons, V50% was −10.0 ± 2.6 mV (n=7), which was not significantly different from that of Nf1+/− neurons (−13.9 ± 1.0 mV, n=8; p>0.05, Student’s t-test). The slope factors for the Boltzmann fits (mV/e-fold change in conductance) were also not significantly different: 14.5 ± 2.6 (n=7) and 12.8 ± 1.4 (n=8) for wild-type and Nf1+/− neurons, respectively (p>0.05). The voltage-dependent properties of inactivation were determined by applying 2-second conditioning pre-pulses that ranged successively from −110 mV to +10 mV in 10 mV steps, followed by a 200-msec step to 10 mV (Figure 1E). The relationship of the normalized test pulse voltage to peak current amplitude was plotted against its corresponding holding potential and fitted with the Boltzmann equation (see Experimental Procedures). As shown in Figure 1E, for wild-type neurons, V50% was −43.2 ± 4.5 mV (n=8), which was not significantly different from that of Nf1+/− neurons (−32.9 ± 1.7 mV, n=7; p>0.05, Student’s t-test). The slope factors for the Boltzmann fits (mV/e-fold change in conductance) were not significantly different: 15.3 ± 3.5 (n=9) and 15.6 ± 1.6 (n=7) for wild-type and Nf1+/− neurons, respectively (p>0.05). These results demonstrate that Nf1+/− neurons have larger total Ca2+ current density but that these currents have identical activation and inactivation properties compared to wild-type neurons.
3.2 Activation of CaV2.2 currents is altered in Nf1+/− mice
To test the possibility that the increase in total Ca2+ current density in Nf1+/− neurons was due to N-type channels, we measured Ca2+ currents with nifedipine (1 μM) in the bath solution to block L-type Ca2+ channels. Under these recording conditions, the primary Ca2+ current component should be via N- and P/Q-type Ca2+ channels [21]. Whole-cell CaV2.2 currents were elicited from a holding potential of −80 mV to depolarizing test potentials (ranging from −60 to +50 mV) for 200 msec. Figure 2A shows representative voltage-dependent inward currents from a wild-type (top traces) and Nf1+/− neuron (lower traces). At 7 DIV, the Ca2+ current density was similar in neurons from Nf1+/− versus wild-type mice: 24.4 ± 2.5 (n=13) versus 22.7 ± 2.0 (n=11) pA pF−1 (Vt= 0 mV, p>0.05, Student’s t-test; Figure 2B). In the presence of nifedipine, the steady-state activation of Ca2+ channels from Nf1+/− versus wild-type mice neurons was well described by the Boltzmann relation (Figure 2C) and V50% was −7.7 ± 1.1 mV (n=9) for wild-type neurons, which was significantly different from that of wild-type neurons (−16.3± 1.9 mV, n=7; p<0.05, Student’s t-test). The slope factors for the Boltzmann fits (mV/efold change in conductance) were not significantly different: 8.7 ± 1.6 (n=9) and 7.4 ± 1.6 (n=7) for wild-type and Nf1+/− neurons, respectively (p>0.05). The voltage dependence of inactivation was also similar for currents recorded from Nf1+/− and wildtype neurons, as shown by the conductance versus voltage relationships (Figure 2D). For wild-type neurons, V50% was −32.4 ± 2.8 mV (n=5), which was not significantly different from that of Nf1+/− neurons (−29.6 ± 2.9 mV, n=9; p>0.05; Figure 2D). The slope factors were also similar: 18.2 ± 2.4 mV (n=6) for wild-type neurons and 16.5 ± 1.9 (n=7; p>0.05) for Nf1+/− neurons. These results indicate that the increase in total Ca2+ current density seen in Nf1+/− neurons is not mediated by N-type calcium currents but that the N-type calcium currents in Nf1+/− activate earlier (i.e. at less depolarized potentials) than in wild-type neurons. This increase in activation may contribute to an enhanced propensity for N-type calcium currents to contribute to transmitter release and suggests regulation of other Ca2+ channels (L-type, P/Q-type) by neurofibromin and/or other as yet undetermined proteins.
Figure 2.

Altered CaV2.2 Ca2+ currents activation properties in neurons of Nf1+/− mice. (A) Representative current traces obtained from a hippocampal neuron from wild-type (top traces) and Nf1+/− mice (bottom traces) in response to 200 ms steps in 5 mV increments applied from a holding potential of −80 mV. For clarity, current traces are shown for every 10 mV step between −60 and +50 mV. Line labeled 0 indicates the zero-current level. (B) Summary of current-versus-voltage (I–V) relationship for neurons from wild-type (open squares) and Nf1+/− mice (filled squares). Peak currents were normalized to cell capacitance. (C) Summary of normalized current versus voltage relations for activation of Ca2+ current gating in neurons from wild-type (open squares, n=7) and Nf1+/− mice (filled squares, n=9). The V50% of activation for Ca2+ currents from Nf1+/− mice was shifted by almost 10 mV in the hyperpolarizing direction (*) whereas no change was observed in the slope of activation between the two genotypes. Bath solutions contained 1 μM TTX, 10 mM TEA, and 1 μM nifedipine to block Na+, K+, and L-type voltage-gated Ca2+ channels, respectively. (D) Summary of normalized current versus voltage relations for inactivation gating of Ca2+ currents in neurons wild-type (open squares, n=7) and Nf1+/− mice (filled squares, n=7). Neither V50% of inactivation nor the slope values derived from the Boltzmann fits of the data revealed any significant differences between the two genotypes.
3.3 Increased glutamate release from cortical cultures of Nf1+/− mice
To address if the increase in total Ca2+ current density and the hyperpolarizing shift in N-type Ca2+ current activation properties could affect release of the excitatory neurotransmitter, glutamate, we examined release of glutamate from cortical neurons. As shown in Figure 3A, the initial basal or resting release of glutamate was not significantly different between genotypes: 11.2 ± 0.5% total glutamate content/15 min (n=117 wells) for wild-type and 11.9 ± 1.1 % total glutamate content/15 min (n=48 wells) for Nf1+/− neurons. In contrast, potassium (50 mM KCl)-stimulated glutamate release was ~45% higher in neurons from Nf1+/− cells compared with wild-type cells; 63.0 ± 3.3% total glutamate content/15 min versus 43.1 ± 1.8% total glutamate content/15 (n=48–177 wells for each genotype from 7 different animals, p<0.05, t-test). Poststimulation basal release was not more than 20% different than initial basal levels indicating that exposure to high extracelluar potassium did not damage the cells or induce cell lysis. The evoked glutamate release (stimulated – initial basal release) was also higher in Nf1+/− cells compared with wild-type cells; 51.1 ± 3.4% total glutamate content/15 min versus 31.9 ± 1.8% total glutamate content/15 (n=48–117 wells for each genotype from 7 different animals, p<0.05, t-test; Figure 3B).
Figure 3.
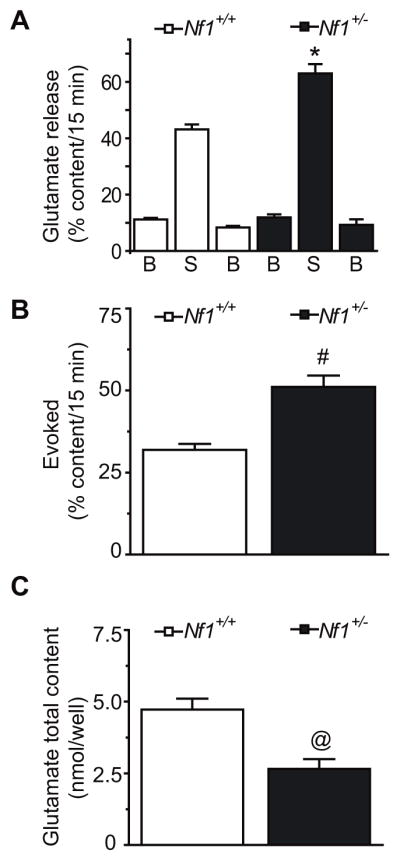
Increased glutamate release in Nf1+/− mice. Mice cortical neurons were maintained in culture for 7–10 DIV prior to the release experiments. (A) Bar graph of glutamate release expressed as mean percent total glutamate content of cells in each well ± S.E.M (n = 48–117 wells per condition). Glutamate release was measured from cells treated with successive incubations of normal non-depolarizing HEPES buffer containing 2.5 mM KCl (basal), depolarizing HEPES buffer containing 50 mM KCl (stimulated), and non-depolarizing HEPES buffer containing 2.5 mM KCl again. Asterisk (*) indicates statistically significant differences in glutamate release between neurons from wild-type (Nf1+/+) and Nf1+/− mice using an ANOVA with Dunnett’s posthoc test (p < 0.05). In all cases, release stimulated by high extracellular K+ was significantly higher than basal release. (B) Evoked release, the difference of stimulated minus initial basal releases, was significantly higher in Nf1+/− mice compared with wildtype mice (#, p <0.05, t-test). (C) The total content of glutamate was measured at the end of the release experiment. There were a significantly lower amount of total glutamate (nmol/well) in neurons from Nf1+/− mice compared with wild-type mice (@, p <0.05, t-test).
Interestingly, we observed a significant increase in the total cellular content of glutamate in cells from wild-type versus Nf1+/− mice: 47.3 ± 3.8 nmol/well (n = 117 wells) versus 26.6 ± 3.4 (n = 48 wells), p<0.05, t-test; Figure 3C). Since the stimulated release of glutamate was normalized to total glutamate content in the cultures, this observation suggests that a larger percentage of the glutamate in the Nf1+/− neurons is available for release. To test this assertion, we measured glutamate content from intact brain synaptosomes and found no difference between the two genotypes: 140.1 ± 20.0 versus 143.0 ± 4.0 nmol/well/mg protein in wild-type and Nf1+/− mice, respectively (not shown). This finding suggests the total tissue content changes are a result of differential glutamate compartmentalization within the cytosol, in non-excitable cells, and in blood or differential glutamate metabolism between the two genotypes.
3.4 Dendritic complexity and axon length are increased in hippocampal neurons from Nf1+/− mice
Since neurofibromin has been shown to be important for neurite outgrowth [17], we tested if reduced neurofibromin could alter dendritic complexity and axon length in wild-type and Nf1+/− hippocampal neurons. First, we performed Sholl analysis [20] to quantify the pattern of dendritic/neuritic branching. Sholl analysis of hippocampal neurons, transfected at 5 DIV and analyzed at 7 DIV, revealed a significant increase in the number of processes in neurons from Nf1+/− mice. This increase reached a peak of ~20 crossings at about 150–250 μm from the soma in EGFP transfected Nf1+/− neurons compared with EGFP–expressing wild-type cells which reached a peak complexity of ~14 crossings (Figure 4B). Second, we measured the length of the axons. Axon length was increased in Nf1+/− neurons compared with wild-type neurons (Figure 4C). The numbers of primary and secondary dendrites were also significantly increased in Nf1+/− neurons compared with wild-type neurons (not shown). These results suggest that reduced expression of neurofibromin leads to an increase in the complexity of dendritic branching and axon lengths of hippocampal neurons.
4. Discussion
In this study we demonstrate that hippocampal neurons from mice with a heterozygous mutation in the Nf1 gene have increased calcium currents and glutamate release compared with wild-type neurons. Longer axon lengths and a more complex dendritic arborization were also observed in neurons from Nf1+/− compared with wildtype mice.
4.1 Calcium channel dysregulation in Nf1+/− mice hippocampal neurons
Although whole cell voltage clamp analysis on neurofibromin deficient Schwann cells has demonstrated alterations in potassium currents [10–12], to date there have been no studies addressing if ion channel activity is altered in neurons from Nf1+/− mice. Our study addressed this gap in knowledge by measuring calcium currents from hippocampal neurons of wild-type and Nf1+/− mice. Hippocampal neurons isolated from neonatal mice express an equal mixture of N-, P/Q-, and L-type currents with R-type currents contributing to less than 3% of the total Ca2+ current [22]. Our analysis revealed that overall Ca2+ current density was ~1.75-fold higher in Nf1+/− mice. This increase was likely due to an increase in L-type Ca2+ channels in neurons from Nf1+/− mice as the density of nifedipine-resistant current was similar between the genotypes. Consistent with the increased current density observed in Nf1+/− mice, a recent genomic analysis of hippocampus from Nf1+/− mice demonstrated an increase in the mRNA level of Cacna 1c, the gene encoding the L-type Ca2+ channel [23]. However, since we did not pharmacologically isolate N-type from P/Q-type channels in our recordings, it may be that N-type channels are up-regulated while P/Q-type channels are unaffected. While we did not investigate changes in open probability, we observed a hyperpolarizing shift in non–L-type calcium current activation in neurons from Nf1+/− compared with wildtype mice reflecting an increased sensitivity to small depolarizations (Figure 2). Taken together, the data demonstrate that a reduction in neurofibromin results in changes in non-L-type calcium current activation and overall calcium current density, both of which could result in increased stimulus-evoked transmitter release.
4.2 Increased synaptic transmission in Nf1+/− mice
Elegant work from the Silva laboratory has established a prominent role for altered GABAergic signaling in Nf1+/− mice [1,3]. These studies have demonstrated that reduced neurofibromin (1) leads to an abnormally high GABA-mediated inhibition and (2) impairment in synaptic plasticity leading to the learning deficits observed in this animal model of NF1. It has been previously shown that spinal cord slices as well as sensory neurons from Nf1+/− mice exhibit an increased release of the neuropeptides, substance P (SP) and calcitonin gene-related peptide (CGRP), upon chemical stimulation [24]. Consistent with these studies, our results demonstrated that chemically stimulated glutamate release from Nf1+/− neonatal cortical cultures was ~1.5-fold higher than from wild-type mice. Taken together, the increase transmitter release observed in this and the aforementioned studies of GABA and neuropeptides suggests that loss of neurofibromin alters Ca2+ channel properties to increase the efficiency of release, “primes” the synaptic vesicle release machinery for release, and/or upregulates expression of synaptic proteins. As neurotransmitter release is dependent on Ca2+ influx via Ca2+ channels [8], our results of an increase in Ca2+ channel density and reduced threshold for opening are in agreement with the increase in transmitter release. While N- and P/Q-type account for most of the Ca2+ influx required for triggering fast transmitter release [8], L- and R-type channels have also been shown to be involved at a variety of central synapses [25–28]. Consistent with the increased efficiency of release and altered synaptic protein profiles, several important synaptic signaling proteins are up-regulated in hippocampi from Nf1+/− mice including the neurotransmitter vesicle trafficking/recycling proteins, synapse formation, maintenance and synaptic structure proteins, and proteins involved in regulating synaptic plasticity and learning [23]. Thus, an increase in synaptic transmission may be explained by an up-regulation of proteins or an increase in coupling between proteins of the transmitter release site apparatus [29,30]. Further studies are underway to explore these possibilities.
Studies from the Silva laboratory have demonstrated that neurofibromin does not play a critical role in excitatory presynaptic terminals [3]. Although these results may at first seem contradictory to our findings of increased evoked glutamate release from cortical neurons of Nf1+/− mice, it is important to note that the unregulated enhancement of excitation per se and not the increased level of glutamate release itself observed in Nf1+/− mice, is what causes loss of functional and structural neuronal integrity [31]. Another possibility remains that the increase in glutamate release in Nf1+/− mice may be modest when compared to the abnormally high GABA release and that this latter alteration may result in increased excitability of Nf1+/− neurons and in deficits in LTP [1,3]. Remarkably, increase in L-type channel activity has been found to be inversely correlated with learning and spatial memory in CA1 hippocampal neurons of older animals [32,33], suggesting that our observed increase in L-type channel activity in Nf1+/− mice may account for LTP impairment and cognitive deficits observed in NF1 patients.
4.3 Neurofibromin controls axon length and dendritic complexity in Nf1+/− mice
A few studies have demonstrated an important role for neurofibromin in axon/neurite outgrowth [7,17,34]. Notably, neurofibromin localizes to neurite-like processes of PC12 cells [17] as well as in neurites and synapses (not shown). Neurofibromin plays a role in acute cytoskeletal reorganization and cell motility [34] presumably via its neurofibromin-gap related domain (GRD) to mediate neurite extension in PC12 cells mediated by NGF [17]. We observed an increase in overall axon length as well as increased dendritic complexity in hippocampal neurons from Nf1+/− compared with wild-type mice (Figure 4). While these findings appear contradictory to the observations that siRNA-mediated loss of neurofibromin causes a reduction in neurite outgrowth of PC12 cells and rat embryonic hippocampal neurons [17], this may be a result of differences in acute reduction of neurofibromin with siRNA as opposed to cells that have experienced a reduced level of neurofibromin throughout development to the time of tissue harvest (neonatal). The latter model (this study) may better reflect processes occurring in children with NF1. Indeed, adult sensory neurons with reduced neurofibromin demonstrated increased axonal length and branching, particularly after injury [35]. The role of neurofibromin in axonal length and process complexity may not be dependent on GAP-related actions of the protein only, since expression of a dominant negative form of the neurofibromin GRD in hippocampal neurons resulted in reduced axonal and dendritic branching/extension [7]. An increase in structural overelaboration of dendritic and axonal processes is observed in Fragile × syndrome, a broad spectrum neurological disorder with impairments in synaptic plasticity [36]; a similar overgrowth of dendritic arbors and increased axon processes may account for the impairment in long term potentiation observed in Nf1+/− mice.
In conclusion, this study has shown that Nf1+/− mice have a greater amount of Ca2+ channels that activate at less depolarized potentials than their wild-type counterparts. As the amount of Ca2+ determines the strength of transmitter release, the higher levels of neurotransmitter release observed in Nf1+/− mice coupled with the abnormal dendritic complex may disrupt LTP and learning. Ca2+ channels may represent a new pharmacotherapeutic target for NF1 treatment, although this claim needs to be further investigated.
Acknowledgments
We thank Dr. Grant Nicol (IUSM, Indiana) for helpful discussions on this project and Shannon Roy, Alicia S. Garcia, and Minh Tuan Tat for excellent technical assistance. Supported by grants from the Indiana State Department of Health – Spinal Cord and Brain Injury Fund [Grant 4786219 to R.K.] and The Indiana University Biomedical Committee – Research Support Funds [Grant 2286501 to R.K.] and from the National Institutes of Health NINDS R01 NS051668 [C.M.H.].
References
- 1.Costa RM, Silva AJ. Molecular and cellular mechanisms underlying the cognitive deficits associated with neurofibromatosis 1. J Child Neurol. 2002;17:622–626. doi: 10.1177/088307380201700813. [DOI] [PubMed] [Google Scholar]
- 2.Jacks T, Shih TS, Schmitt EM, Bronson RT, Bernards A, Weinberg RA. Tumour predisposition in mice heterozygous for a targeted mutation in Nf1. Nat Genet. 1994;7:353–361. doi: 10.1038/ng0794-353. [DOI] [PubMed] [Google Scholar]
- 3.Cui Y, Costa RM, Murphy GG, Elgersma Y, Zhu Y, Gutmann DH, Parada LF, Mody I, Silva AJ. Neurofibromin regulation of ERK signaling modulates GABA release and learning. Cell. 2008;135:549–560. doi: 10.1016/j.cell.2008.09.060. [DOI] [PMC free article] [PubMed] [Google Scholar]
- 4.Zhu Y, Romero MI, Ghosh P, Ye Z, Charnay P, Rushing EJ, Marth JD, Parada LF. Ablation of NF1 function in neurons induces abnormal development of cerebral cortex and reactive gliosis in the brain. Genes Dev. 2001;15:859–876. doi: 10.1101/gad.862101. [DOI] [PMC free article] [PubMed] [Google Scholar]
- 5.Guo HF, Tong J, Hannan F, Luo L, Zhong Y. A neurofibromatosis-1-regulated pathway is required for learning in Drosophila. Nature. 2000;403:895–898. doi: 10.1038/35002593. [DOI] [PubMed] [Google Scholar]
- 6.Costa RM, Federov NB, Kogan JH, Murphy GG, Stern J, Ohno M, Kucherlapati R, Jacks T, Silva AJ. Mechanism for the learning deficits in a mouse model of neurofibromatosis type 1. Nature. 2002;415:526–530. doi: 10.1038/nature711. [DOI] [PubMed] [Google Scholar]
- 7.Yunoue S, Tokuo H, Fukunaga K, Feng L, Ozawa T, Nishi T, Kikuchi A, Hattori S, Kuratsu J, Saya H, Araki N. Neurofibromatosis type I tumor suppressor neurofibromin regulates neuronal differentiation via its GTPase-activating protein function toward Ras. J Biol Chem. 2003;278:26958–26969. doi: 10.1074/jbc.M209413200. [DOI] [PubMed] [Google Scholar]
- 8.Catterall WA, Few AP. Calcium channel regulation and presynaptic plasticity. Neuron. 2008;59:882–901. doi: 10.1016/j.neuron.2008.09.005. [DOI] [PubMed] [Google Scholar]
- 9.Sudhof TC. The synaptic vesicle cycle: a cascade of protein-protein interactions. Nature. 1995;375:645–653. doi: 10.1038/375645a0. [DOI] [PubMed] [Google Scholar]
- 10.Fieber LA. Ionic currents in normal and neurofibromatosis type 1-affected human Schwann cells: induction of tumor cell K current in normal Schwann cells by cyclic AMP. J Neurosci Res. 1998;54:495–506. doi: 10.1002/(SICI)1097-4547(19981115)54:4<495::AID-JNR7>3.0.CO;2-H. [DOI] [PubMed] [Google Scholar]
- 11.Xu Y, Chiamvimonvat N, Vazquez AE, Akunuru S, Ratner N, Yamoah EN. Gene-targeted deletion of neurofibromin enhances the expression of a transient outward K+ current in Schwann cells: a protein kinase A-mediated mechanism. J Neurosci. 2002;22:9194–9202. doi: 10.1523/JNEUROSCI.22-21-09194.2002. [DOI] [PMC free article] [PubMed] [Google Scholar]
- 12.Fieber LA. Voltage-Gated ion currents of schwann cells in cell culture models of human neurofibromatosis. J Exp Zool A Comp Exp Biol. 2003;300:76–83. doi: 10.1002/jez.a.10312. [DOI] [PubMed] [Google Scholar]
- 13.Wang Y, Duan JH, Hingtgen CM, Nicol GD. Augmented sodium currents contribute to enhanced excitability of small diameter capsaicin-sensitive Nf1+/− mouse sensory neurons. J Neurophysiol. 2010 doi: 10.1152/jn.01010.2009. [DOI] [PMC free article] [PubMed] [Google Scholar]
- 14.Brittain JM, Piekarz AD, Wang Y, Kondo T, Cummins TR, Khanna R. An atypical role for collapsin response mediator protein 2 (CRMP-2) in neurotransmitter release via interaction with presynaptic voltage-gated Ca2+ channels. J Biol Chem. 2009;284:31375–31390. doi: 10.1074/jbc.M109.009951. [DOI] [PMC free article] [PubMed] [Google Scholar]
- 15.Goslin K, Banker G. Experimental observations on the development of polarity by hippocampal neurons in culture. J Cell Biol. 1989;108:1507–1516. doi: 10.1083/jcb.108.4.1507. [DOI] [PMC free article] [PubMed] [Google Scholar]
- 16.Chen Y, Stevens B, Chang J, Milbrandt J, Barres BA, Hell JW. NS21: re-defined and modified supplement B27 for neuronal cultures. J Neurosci Methods. 2008;171:239–247. doi: 10.1016/j.jneumeth.2008.03.013. [DOI] [PMC free article] [PubMed] [Google Scholar]
- 17.Patrakitkomjorn S, Kobayashi D, Morikawa T, Wilson MM, Tsubota N, Irie A, Ozawa T, Aoki M, Arimura N, Kaibuchi K, Saya H, Araki N. Neurofibromatosis type 1 (NF1) tumor suppressor, neurofibromin, regulates the neuronal differentiation of PC12 cells via its associating protein, CRMP-2. J Biol Chem. 2008;283:9399–9413. doi: 10.1074/jbc.M708206200. [DOI] [PubMed] [Google Scholar]
- 18.Taylor AL, Hewett SJ. Potassium-evoked glutamate release liberates arachidonic acid from cortical neurons. J Biol Chem. 2002;277:43881–43887. doi: 10.1074/jbc.M205872200. [DOI] [PubMed] [Google Scholar]
- 19.Charych EI, Akum BF, Goldberg JS, Jornsten RJ, Rongo C, Zheng JQ, Firestein BL. Activity-independent regulation of dendrite patterning by postsynaptic density protein PSD-95. J Neurosci. 2006;26:10164–10176. doi: 10.1523/JNEUROSCI.2379-06.2006. [DOI] [PMC free article] [PubMed] [Google Scholar]
- 20.SHOLL DA. Dendritic organization in the neurons of the visual and motor cortices of the cat. J Anat. 1953;87:387–406. [PMC free article] [PubMed] [Google Scholar]
- 21.Zhang JF, Randall AD, Ellinor PT, Horne WA, Sather WA, Tanabe T, Schwarz TL, Tsien RW. Distinctive pharmacology and kinetics of cloned neuronal Ca2+ channels and their possible counterparts in mammalian CNS neurons. Neuropharmacology. 1993;32:1075–1088. doi: 10.1016/0028-3908(93)90003-l. [DOI] [PubMed] [Google Scholar]
- 22.Lorenzon NM, Foehring RC. Characterization of pharmacologically identified voltage-gated calcium channel currents in acutely isolated rat neocortical neurons. II. Postnatal development. J Neurophysiol. 1995;73:1443–1451. doi: 10.1152/jn.1995.73.4.1443. [DOI] [PubMed] [Google Scholar]
- 23.Park CS, Zhong L, Tang SJ. Aberrant expression of synaptic plasticity-related genes in the NF1+/− mouse hippocampus. J Neurosci Res. 2009;87:3107–3119. doi: 10.1002/jnr.22134. [DOI] [PubMed] [Google Scholar]
- 24.Hingtgen CM, Roy SL, Clapp DW. Stimulus-evoked release of neuropeptides is enhanced in sensory neurons from mice with a heterozygous mutation of the Nf1 gene. Neuroscience. 2006;137:637–645. doi: 10.1016/j.neuroscience.2005.09.030. [DOI] [PubMed] [Google Scholar]
- 25.Belhage B, Frandsen A, Schousboe A. Temporal and spatial differences in intracellular Ca++ changes elicited by K+ and glutamate in single cultured neocortical neurons. Neurochem Int. 1996;29:247–253. doi: 10.1016/0197-0186(96)00011-3. [DOI] [PubMed] [Google Scholar]
- 26.Tokunaga T, Miyazaki K, Koseki M, Mobarakeh JI, Ishizuka T, Yawo H. Pharmacological dissection of calcium channel subtype-related components of strontium inflow in large mossy fiber boutons of mouse hippocampus. Hippocampus. 2004;14:570–585. doi: 10.1002/hipo.10202. [DOI] [PubMed] [Google Scholar]
- 27.Miyazaki K, Ishizuka T, Yawo H. Synapse-to-synapse variation of calcium channel subtype contributions in large mossy fiber terminals of mouse hippocampus. Neuroscience. 2005;136:1003–1014. doi: 10.1016/j.neuroscience.2005.08.049. [DOI] [PubMed] [Google Scholar]
- 28.Jun K, Piedras-Renteria ES, Smith SM, Wheeler DB, Lee SB, Lee TG, Chin H, Adams ME, Scheller RH, Tsien RW, Shin HS. Ablation of P/Q-type Ca(2+) channel currents, altered synaptic transmission, and progressive ataxia in mice lacking the alpha(1A)-subunit. Proc Natl Acad Sci U S A. 1999;96:15245–15250. doi: 10.1073/pnas.96.26.15245. [DOI] [PMC free article] [PubMed] [Google Scholar]
- 29.Khanna R, Li Q, Schlichter LC, Stanley EF. The transmitter release-site CaV2.2 channel cluster is linked to an endocytosis coat protein complex. Eur J Neurosci. 2007;26:560–574. doi: 10.1111/j.1460-9568.2007.05681.x. [DOI] [PubMed] [Google Scholar]
- 30.Khanna R, Li Q, Bewersdorf J, Stanley EF. The presynaptic CaV2.2 channeltransmitter release site core complex. Eur J Neurosci. 2007;26:547–559. doi: 10.1111/j.1460-9568.2007.05680.x. [DOI] [PubMed] [Google Scholar]
- 31.Cepeda C, Levine MS. Where do you think you are going? The NMDA-D1 receptor trap. Sci STKE. 2006;2006:e20. doi: 10.1126/stke.3332006pe20. [DOI] [PubMed] [Google Scholar]
- 32.Thibault O, Landfield PW. Increase in single L-type calcium channels in hippocampal neurons during aging. Science. 1996;272:1017–1020. doi: 10.1126/science.272.5264.1017. [DOI] [PubMed] [Google Scholar]
- 33.Thibault O, Hadley R, Landfield PW. Elevated postsynaptic [Ca2+]i and L-type calcium channel activity in aged hippocampal neurons: relationship to impaired synaptic plasticity. J Neurosci. 2001;21:9744–9756. doi: 10.1523/JNEUROSCI.21-24-09744.2001. [DOI] [PMC free article] [PubMed] [Google Scholar]
- 34.Ozawa T, Araki N, Yunoue S, Tokuo H, Feng L, Patrakitkomjorn S, Hara T, Ichikawa Y, Matsumoto K, Fujii K, Saya H. The neurofibromatosis type 1 gene product neurofibromin enhances cell motility by regulating actin filament dynamics via the Rho-ROCK-LIMK2-cofilin pathway. J Biol Chem. 2005;280:39524–39533. doi: 10.1074/jbc.M503707200. [DOI] [PubMed] [Google Scholar]
- 35.Romero MI, Lin L, Lush ME, Lei L, Parada LF, Zhu Y. Deletion of Nf1 in neurons induces increased axon collateral branching after dorsal root injury. J Neurosci. 2007;27:2124–2134. doi: 10.1523/JNEUROSCI.4363-06.2007. [DOI] [PMC free article] [PubMed] [Google Scholar]
- 36.Tessier CR, Broadie K. Drosophila fragile × mental retardation protein developmentally regulates activity-dependent axon pruning. Development. 2008;135:1547–1557. doi: 10.1242/dev.015867. [DOI] [PMC free article] [PubMed] [Google Scholar]