Abstract
Background:
The standard 12-lead ECG (electrocardiogram) continues to be the most frequently recorded noninvasive test in medicine. A prolonged ECG QT interval and Tpeak-Tend (Tpe) interval are predictors of ventricular arrhythmia and sudden cardiac death.
Aim:
The aim of this study is to analyze the relation between QT interval and T-wave variables in hypertensive patients, with and without left ventricular hypertrophy (LVH).
Materials and Methods:
Fifty-nine consecutive patients with grade 2 essential hypertension were included in the study. They underwent standard 12-lead ECG, and QT intervals: QTmax (the maximal duration of the QT interval in the 12 ECG leads), QTc (heart rate corrected QTmax), QTm (mean QT interval), QTII (the QT interval in lead DII), QTcII (heart rate corrected QTII), and QTd (QT dispersion); and T-wave variables: T0e (T wave duration), T0em (mean T0e), Tpe, Tpem (mean Tpem), Ta (T wave amplitude), and Tam (mean Ta) were manually assessed. LVH was diagnosed using both echocardiography and the ECG criteria.
Results:
QTc was prolonged in 41 patients (69%). Multiple regression analysis revealed a significant association between QT intervals and T-wave variables: QTmax and Tpe (P = 0.015), QTd and Tpe (P = 0.022) and Ta (P = 0.004), and Tpe with QTd and T0e (P < 0.05). A moderate but significant correlation was found between Tpe and QTmax, Tpe and QTII, and Ta and QTd. A prolonged QTc was more prevalent in hypertensive patients with LVH (85%), compared to hypertensive patients without LVH (50%). QTm, QTd, QTII, Tpe, Tpem were significantly elevated (P < 0.05) in patients with LVH.
Conclusions:
Hypertension is associated with an increased prevalence of prolonged QT intervals. QT intervals and T-wave variables are closely connected in hypertensive patients. QTm, T0em, Tpem, and Tam, do not provide significant additional information compared to QTmax, T0e, Tpe, and Ta. Left ventricular hypertrophy is associated with prolonged QT interval and Tpeak-Tend interval in hypertensive patients.
Keywords: Hypertension, left ventricular hypertrophy, QT interval, Tpeak-Tend interval
The standard 12-lead ECG is still the most frequently recorded noninvasive test in medicine due to its accessibility and simplicity.
The QT interval is defined as the interval from the onset of the QRS complex (the earliest indication of ventricular depolarization) to the end of the T wave (the latest indication of ventricular repolarization).[1] The QT interval is a reflection of the sum of the ventricular action potential durations[2] in the heart, and it is considered the ‘outer’ manifestation of the underlying cardiac action potential.[3]
Significant differences exist in the duration of the QT interval when measured in the individual leads. QT dispersion, the difference between maximal and minimal QT interval duration in all measurable ECG leads, is considered a marker of arrhythmia and sudden cardiac death risk, and a quantitative noninvasive method to determine myocardial repolarization inhomogeneities,[4] although there are several trials that deny the prognostic value of QTd.[5] Lately, its value has been reconsidered by some authors.[6,7]
The Tpeak-Tend interval (Tpe), the interval from the T-wave peak to the end of the T wave, has been accepted as easy, assessable measure of transmural dispersion of repolarization, related to arrhythmogenesis.[8,9]
Full repolarization of the epicardial action potential coincides with the peak of the T wave, and repolarization of the M cells with the end of the T wave. The duration of the M cell action potential determines the QT interval, whereas, the duration of the epicardial action potential determines the QT peak interval.[3]
A prolonged ECG QT interval and Tpe interval are predictors of ventricular arrhythmia and sudden cardiac death.[10–13] Some authors consider that a prolonged Tpe is a better predictor of sudden cardiac death compared to a prolonged QT interval.[3]
Sudden cardiac death, one of the leading causes of mortality, remains a health problem of epidemic proportions.[13,14] Ventricular arrhythmias, the most important causes of sudden cardiac death, are common in hypertensive patients. The underlying mechanisms are: left ventricular hypertrophy (LVH), myocardial ischemia, and impaired left ventricular function.[15]
Aim
The aim of the study is to analyze the relation between QT interval and T-wave variables in hypertensive patients, with and without left ventricular hypertrophy (LVH).
Materials and Methods
Study population
Fifty-nine consecutive patients with grade 2 essential hypertension were enrolled in the study. The patients underwent standard 12-lead ECG and 2D-echocardiography.
The most important inclusion criteria were: grade 2 hypertension, diagnosed considering the criteria of the European Society of Cardiology[16] and a written informed consent of the patient.
The most important exclusion criteria were: atrial flutter or fibrillation, electrolyte imbalances, active infections, peripheral edema, and chronic obstructive pulmonary disease.
The investigations conformed to the principles outlined in the Declaration of Helsinki (Cardiovascular Research 1997; 35:2-4) and were approved by the Ethics Committee of the University.
Electrocardiographic measurements
The patients underwent standard 12-lead ECG at a paper speed of 25 mm/second, using a Cardioline Delta 3 Plus ECG unit. All subjects were in sinus rhythm. QTmax (the maximal duration of the QT interval in the 12 ECG leads), QTc (heart rate corrected QTmax), QTm (mean QT interval), QTd (QT dispersion), QTII (the QT interval in lead DII), QTcII (heart rate corrected QTII), and T-wave parameters: T0e (T wave duration), T0em (mean T0e), Tpe, Tpem (mean Tpe), Ta (T wave amplitude), and Tam (mean Ta) were manually measured in all 12 ECG leads.
The QT interval duration was measured from the beginning of the Q wave (or R wave) to the end of the T wave. The T-wave end-points were determined by drawing the baseline and a line tangent to the T wave.[12] Leads where the end of the T wave could not be determined or where the T wave had a low amplitude or was isoelectric or biphasic were eliminated.[13] If a U wave was present, the QT interval was measured to the nadir of the curve between the T and U wave.[17] Two consecutive QT intervals were measured in each lead, and the arithmetic mean was calculated. A minimum of eight leads was measured for each patient.[12] Twelve-lead ECGs were examined by two independent observers, who were blinded to the clinical data and in case of a difference of >20 ms in each measurement, an agreement was obtained.
QTmax was the maximum duration of the QT interval in all 12 ECG leads.[1] QTm represented the mean QT interval of all the ECG leads wherein the QT interval was measurable.[12] The QT interval was corrected for rate using the Bazett formula: QTc = QT/√ RR, where QTc was the heart rate corrected QTmax interval, and RR represented the R-R distance.[18] QTd was the QT dispersion, calculated as the difference between the maximal and minimal QT interval duration.[19]
T-wave duration (T0e) was determined by the intersection of the ‘base line’ with the line that followed the steepest part of the T wave before and after its peak, considering the maximal value in all the measurable leads.[20] T0em was the mean of T0e in all the ECG leads where the QT interval was measurable. Tpe was measured in each lead and obtained from the difference between the QT interval and the QT-peak interval (from the beginning of the QRS to the peak of the T wave).[8,21] The peak of the T wave was defined as a point of highest amplitude of T-wave deflection.[9]
Tpe represented the maximal Tpeak-Tend duration in all the ECG leads where the QT interval was measurable, and Tpem, the mean of Tpe from all the ECG leads where the QT interval was measurable. Ta was the maximal T-wave amplitude considering all ECG leads in which it was measurable and Tam the mean value of the T-wave amplitude in all ECG leads.
Left ventricular hypertrophy
Left ventricular hypertrophy was diagnosed using both echocardiography[22] (septal thickness and posterior wall thickness >1 cm in women and >1,1 cm in men) and the ECG[23–25] criteria.
Statistical analysis
Continuous variables are presented as means ± SD (standard deviation). Multiple regression analysis, Bravais-Pearson correlation coefficient (r), sensitivity, specificity, and Student's t-test were used as statistical methods. Differences between groups were evaluated using the Student's t-test. A P < 0.05 was considered statistically significant.
Results
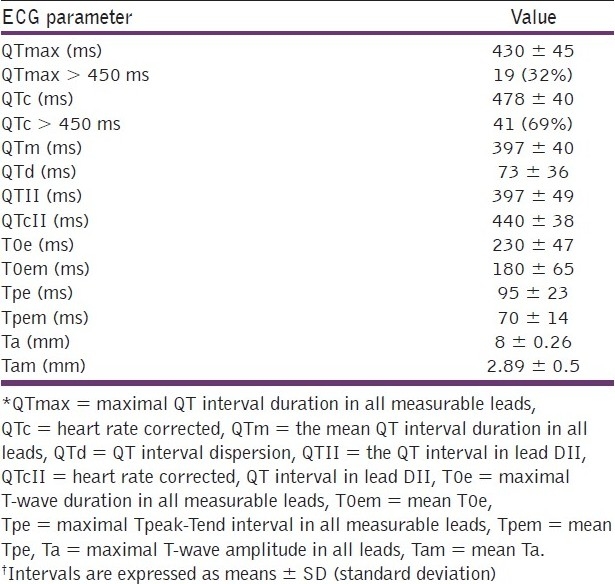
The clinical characteristics of the study population are included in Table 1. The following cardiovascular risk factors were identified: dyslipidemia, obesity (Body Mass Index >30 kg/m2), type 2 diabetes mellitus, and a family history of premature cardiovascular disease. Dyslipidemia was diagnosed considering the guidelines of the European Society of Cardiology: total cholesterol (>190 mg/dl), LDL-cholesterol (>115 mg/dl), HDL-cholesterol <40 mg/dl in men and <46 mg/dl in women), and triglycerides (>150 mg/dl).[16] The ECG parameters values are included in Table 2. QTc was prolonged in 41 patients (69%).
Table 1.
Clinical characteristics of the patients
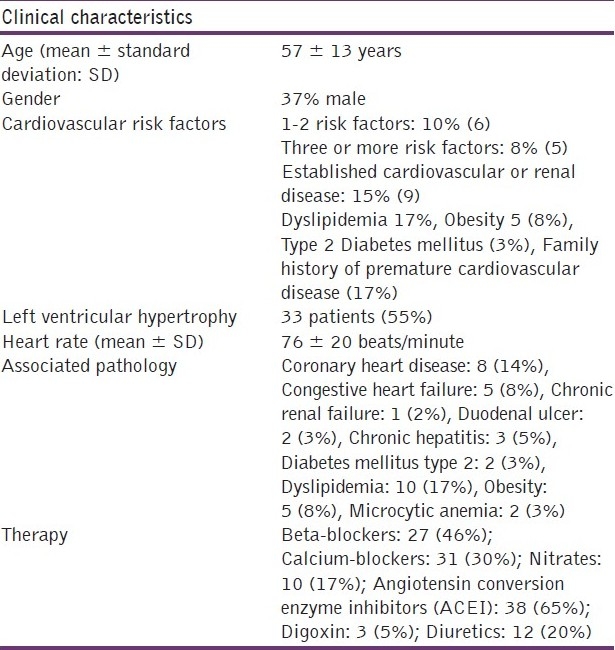
Table 2.
ECG parameters in the study population
Multiple regression analysis
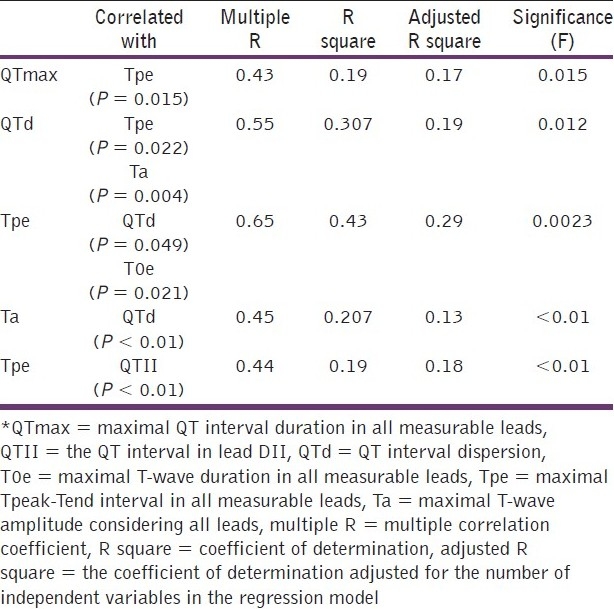
Multiple regression analysis revealed a significant association between QT intervals and T-wave parameters. QTmax was significantly associated with Tpe (P = 0.015), QTd with Tpe (P = 0.022) and Ta (P = 0.004), and Tpe with QTd and T0e (P < 0.05) [Table 3]. A P value of <0.05 was considered statistically significant. The most important association with regard to R square was, Tpe with QTd and T0e.
Table 3.
Multiple regression analysis
Correlations
A moderate, but significant correlation was found between QT intervals and T-wave parameters: Tpe and QTmax (r = 0.43, P < 0.01), Tpe and QTII (r = 0.44, P < 0.01), and between Ta and QTd (r = 0.45, P < 0.01), where r was the Bravais-Pearson correlation coefficient.
Patients with left ventricular hypertrophy
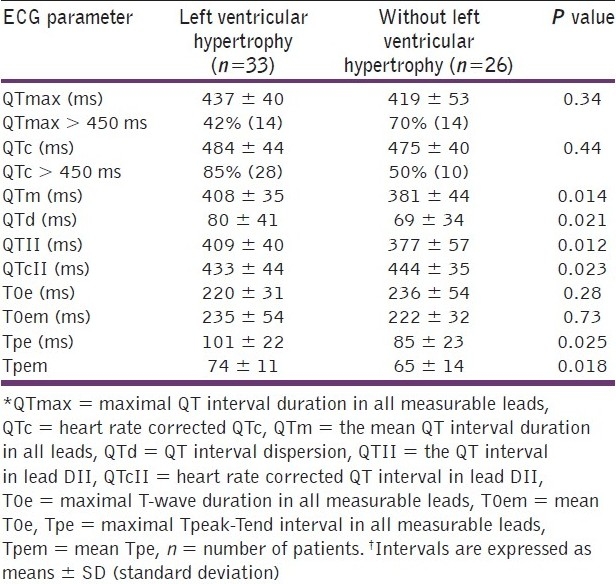
A prolonged QTc was more prevalent in hypertensive patients with LVH (85%), compared to hypertensive patients without LVH (50%). QTm, QTd, QTII, Tpe, and Tpem were significantly elevated (P < 0.05) in patients with LVH [Table 4].
Table 4.
ECG parameters in hypertensive patients with and without left ventricular hypertrophy
Sensitivity and specificity of T-wave variables in predicting prolonged QT intervals
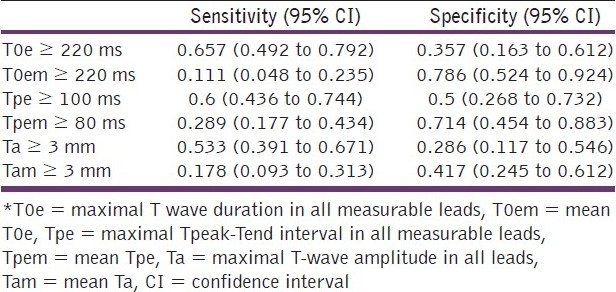
The most sensitive ECG T-wave parameter was T0e ≥ 220 ms for both prolonged QTmax and QTc [Tables 5 and 6]. The most specific T-wave parameter was Tam ≥ 3 mm for prolonged QTmax and T0em ≥ 220 ms for prolonged QTc [Tables 5 and 6].
Table 5.
Sensitivity and specificity of T.wave parameters as predictors of prolonged maximal QT interval (QTmax ≥ 450 ms)
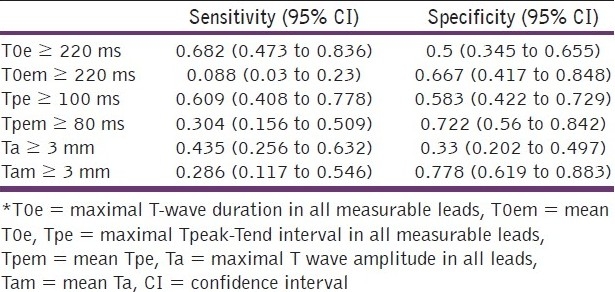
Table 6.
Sensitivity and specificity of T.wave parameters as predictors of prolonged heart rate corrected QT interval (QTc ≥ 450 ms)
Discussion
The main findings of our study are the high prevalence of prolonged QT intervals, the close connection between QT interval and T-wave variables, and QT and Tpe prolongation with left ventricular hypertrophy, in hypertensive patients.
Essential hypertension prolongs the QT interval, despite the blood pressure-lowering therapy.[10] A few studies have already demonstrated that LVH results in prolonged and nonuniform ventricular repolarization, increased action potential duration, and delayed ventricular conduction.[8,10,26] The prolonged QT interval may be attributed to the increased thickness of the left ventricle wall and to intramural fibrosis, which distorts and prolongs transmural impulse propagation; it may be a manifestation of the intraventricular or interventricular conduction delay or block, or it may be due to the down regulation of several potassium currents responsible for repolarization.[27,28]
The Tpe interval has been accepted as a measure of transmural dispersion of repolarization, related to arrhythmogenesis.[8,9] This suggests that in LVH there is a high transmural heterogeneity of repolarization, and a high arrhythmic risk.[8]
The close connection between the QT interval and T-wave variables was not demonstrated before in hypertensive patients, and no other study, as far as we know, predicted a prolonged QT interval using T-wave parameters. This could mean a similar prognostic value for ventricular arrhythmia and sudden cardiac death, but it should be the aim of another study.
The values obtained for QT intervals and Tpe in the present study are similar to those of other studies.[10,26] Zhao et al.,[8] obtained lower values for QTc and Tpe compared to the present study. The most obvious reason for the differences is purely methodological: Zhao et al., used only leads V4-V6 for their electrocardiographic analyses, whereas, the present study has used all measurable leads and chosen the longest intervals from those leads as the principal measures.
It has been demonstrated earlier that LVH leads to a notable increase in the Tp-e/QT ratio, which may serve as a good clinical predictor of sudden cardiac death.[21]
Study limitations
The main limitations were: the sample size, difficulties in delineating the end of the T wave in some leads, no clear consensus about the normal values for T-wave variables and QTd, and several additional QT interval prolonging and shortening factors.
Considering the low number of patients and very few patients with a known history of ventricular arrhythmia, the results need to be confirmed in larger groups and follow-up studies.
Difficulties in delineating the end of the T-wave in some leads are mentioned in several articles.[10–13,17] This is the reason why, leads in which the end of the T wave could not be assessed, were eliminated.
There are no large population Tpe studies and there is no clear consensus about the normal values for Tpe.[21] The Tpe data of our study are comparable to those of other studies.[29,30]
Several factors may have had a contribution to QT interva[l prolongation and shortening. QT interval elongation is caused by: diabetes mellitus,[31] advanced age, heart failure, obesity,[32,33] coronary heart disease,[34] renal impairment,[35] and dyslipidemia.[36] The number of patients with comorbidities has been low in our study. QT interval shortening may be caused by digitalis,[37] angiotensin converting enzyme inhibition,[38] and beta-blockers.[39] The prevalence of patients with a prolonged QTc has still been high (69%), despite therapy.
Age and gender have obvious effects on the repolarization time.[1] This is the reason why they have been matched in the two hypertensive groups: with and without LVH.
Conclusion
Hypertension is associated with an increased prevalence of prolonged QT intervals. QT interval and T-wave variables are closely connected in hypertensive patients. A prolonged QT interval can be predicted using T-wave parameters. QTm, T0em, Tpem, and Tam, do not provide significant additional information compared to QTmax, T0e, Tpe, and Ta. Left ventricular hypertrophy is associated with a prolonged QT interval and Tpeak-Tend interval.
Footnotes
Source of Support: Nil
Conflict of Interest: None declared.
References
- 1.Rautaharju PM, Surawicz B, Gettes LS. AHA/ACCF/HRS recommendations for the standardization and interpretation of the electrocardiogram: Part IV: The ST segment, T and U waves, and the QT interval: A scientific statement from the American Heart Association Electrocardiography and Arrhythmias Committee, Council on Clinical Cardiology; the American College of Cardiology Foundation; and the Heart Rhythm Society. J Am Coll Cardiol. 2009;53:982–91. doi: 10.1016/j.jacc.2008.12.014. [DOI] [PubMed] [Google Scholar]
- 2.Goldberger JJ, Cain ME, Hohnloser SH, Kadish AH, Knight BP, Lauer MS, et al. American Heart Association/American College of Cardiology Foundation/Heart Rhythm Society scientific statement on noninvasive risk stratification techniques for identifying patients at risk for sudden cardiac death: A scientific statement from the American Heart Association Council on Clinical Cardiology Committee on Electrocardiography and Arrhythmias and Council on Epidemiology and Prevention. J Am Coll Cardiol. 2008;52:1179–99. doi: 10.1016/j.jacc.2008.05.003. [DOI] [PubMed] [Google Scholar]
- 3.Gussack I, Antzelevitch C. Springer: London Limited. Verlag; 2008. Electrical Diseases of the Heart.Genetics, Mechanisms, Treatment, Prevention. [Google Scholar]
- 4.Zabel M, Portnoy S, Franz MR. Electrocardiographic indices of dispersion of ventricular repolarization: An isolated heart validation study. J Am Coll Cardiol. 1995;25:746–52. doi: 10.1016/0735-1097(94)00446-W. [DOI] [PubMed] [Google Scholar]
- 5.Malik M, Batchvarov V. Measurement, interpretation and clinical potential of QT dispersion. J Am Coll Cardiol. 2000;36:1749–66. doi: 10.1016/s0735-1097(00)00962-1. [DOI] [PubMed] [Google Scholar]
- 6.Celi A. QT dispersion: Time for a revival? Intern Emerg Med. 2006;1:262–3. doi: 10.1007/BF02934758. [DOI] [PubMed] [Google Scholar]
- 7.Mozos I, Hancu M, Jost N, Cristescu A. Multipolar QRST isointegral maps and QT dispersion in old myocardial infarction. Acta Physiol Hung. 2010;97:11–21. doi: 10.1556/APhysiol.97.2010.1.2. [DOI] [PubMed] [Google Scholar]
- 8.Zhao Z, Yuan Z, Ji Y, Wu Y, Qi Y. Left ventricular hypertrophy amplifies the QT, and Tp-e intervals and the Tp-e/QT ratio of left chest ECG. J Biomed Res. 2010;24:69–72. doi: 10.1016/S1674-8301(10)60011-5. [DOI] [PMC free article] [PubMed] [Google Scholar]
- 9.Gupta P, Patel C, Patel H, Narayanaswamy S, Malhotra B, Geen JT, et al. Tp-e/QT ratio as an index of arrhythmogenesis. J Electrocardiol. 2008;41:567–74. doi: 10.1016/j.jelectrocard.2008.07.016. [DOI] [PubMed] [Google Scholar]
- 10.Mozos I, Costea C. The QT interval and left ventricular hypertrophy in essential hypertension. In: Sobieszczanska M, Jagielski J, Macfarlane PW, editors. Electrocardiology. Wroclaw, Poland: JAKS Publishing Company; 2010. pp. 203–9. 2009. Proceedings of the 36th International Congress on Electrocardiology. [Google Scholar]
- 11.Fish JM, Di Diego JM, Nesterenko VV, Antzelevitch C. Epicardial activation of left ventricular wall prolongs QT interval and transmural dispersion of repolarization: Implications for biventricular pacing. Circulation. 2004;109:2136–42. doi: 10.1161/01.CIR.0000127423.75608.A4. [DOI] [PubMed] [Google Scholar]
- 12.Mozos I, Costea C, Serban C, Susan L. Factors associated with a prolonged QT interval in liver cirrhosis patients. J Electrocardiol. 2011;44:105–8. doi: 10.1016/j.jelectrocard.2010.10.034. [DOI] [PubMed] [Google Scholar]
- 13.Mozos I, Hancu M, Cristescu A. Ventricular arrhythmia risk in elderly heart failure patients. Rev Glob Med Healthcare Res. 2010;1:18–29. [Google Scholar]
- 14.Kunavarapu C, Bloomfield D. Role of noninvasive studies in risk stratification for sudden cardiac death. Clin Cardiol. 2004;27:192–7. doi: 10.1002/clc.4960270404. [DOI] [PMC free article] [PubMed] [Google Scholar]
- 15.Baguet JP, Erdine S, Mallion JM. Hypertension and arrhythmia. European Society of Hypertension Scientific Newsletter: Update Hypertens Manag. 2005;6:24. doi: 10.1097/01.hjh.0000199806.03058.a3. [DOI] [PubMed] [Google Scholar]
- 16.Mancia G, De Baker G, Dominiczak A, Cifkova R, Fagard R, Germano G, et al. Guidelines for the management of arterial hypertension. Eur Heart J. 2007;28:1462–536. doi: 10.1093/eurheartj/ehm236. [DOI] [PubMed] [Google Scholar]
- 17.Turrini P, Corrado D, Basso C, Nava A, Bauce B, Thiene G. Dispersion of Ventricular Depolarisation-Repolarisation. Circulation. 2001;103:3075–80. doi: 10.1161/01.cir.103.25.3075. [DOI] [PubMed] [Google Scholar]
- 18.Bazett HC. An analysis of the time-relations of the electrocardiogram. Heart. 1920;7:353–70. [Google Scholar]
- 19.Jain H, Avasthi R. Correlation between dipsersion of repolarization (QT dispersion) and ventricular ectopic beat frequency in patients with acute myocardial infarction: A marker for risk of arrhythmogenesis? Int J Cardiol. 2004;93:69–73. doi: 10.1016/s0167-5273(03)00127-x. [DOI] [PubMed] [Google Scholar]
- 20.Ibanez A, Ferrero Jr. The ECG T-wave duration as an index of dispersion of ventricular repolarization: Insights from simulations. Comput Cardiol. 2006;33:793–6. [Google Scholar]
- 21.Hevia JC, Antzelevitch C, Tornés Bárzaga F, Sanchez MD, Balea FD, Molina RZ, et al. Tpeak-Tend and Tpeak-Tend Dispersion as Risk Factors for Ventricular Tachycardia/Ventricular Fibrillation in Patients With the Brugada Syndrome. J Am Coll Cardiol. 2006;47:1828–34. doi: 10.1016/j.jacc.2005.12.049. [DOI] [PMC free article] [PubMed] [Google Scholar]
- 22.Lang RM, Bierig M, Devereux RB, Flachskampf FA, Foster E, Pellikka PA, et al. Recommendations for Chamber Quantification: A Report from the American Society of Echocardiography's Guidelines and Standards Committee and the Chamber Quantification Writing Group, Developed in Conjunction with the European Association of Echocardiography. J Am Soc Echocardiogr. 2005;18:1440–63. doi: 10.1016/j.echo.2005.10.005. [DOI] [PubMed] [Google Scholar]
- 23.Romhilt DW, Estes EH., Jr A point-score system for the ECG diagnosis of left ventricular hypertrophy. Am Heart J. 1968;75:752–8. doi: 10.1016/0002-8703(68)90035-5. [DOI] [PubMed] [Google Scholar]
- 24.Sokolov M, Lyon TP. The ventricular complex in left ventricular hypertrophy as obtained by unipolar precordial and limb leads. Am Heart J. 1949;37:161–86. doi: 10.1016/0002-8703(49)90562-1. [DOI] [PubMed] [Google Scholar]
- 25.Casale PN, Devereux RB, Kligfield P, Eisenberg RR, Miller DH, Chaudhary BS, et al. Electrocardiographic detection of left ventricular hypertrophy: Development and prospective validation of improved criteria. J Am Coll Cardiol. 1985;6:572–80. doi: 10.1016/s0735-1097(85)80115-7. [DOI] [PubMed] [Google Scholar]
- 26.Oikarinen L, Nieminen MS, Viitasalo M, Toivonen L, Jern S, Dahlof B, et al. QRS Duration and QT Interval Predict Mortality in Hypertensive Patients with Left Ventricular Hypertrophy.The Losartan Intervention for Endpoint Reduction in Hypertension Study. Hypertension. 2004;43:1029–34. doi: 10.1161/01.HYP.0000125230.46080.c6. [DOI] [PubMed] [Google Scholar]
- 27.Hancock EW, Deal BJ, Mirvis DM, Okin P, Kligfield P, Gettes LS. AHA/ACCF/HRS Recommendations for the Standardization and Interpretation of the Electrocardiogram: Part V: Electrocardiogram changes associated with cardiac chamber hypertrophy. Circulation. 2009;19:e251–61. doi: 10.1161/CIRCULATIONAHA.108.191097. [DOI] [PubMed] [Google Scholar]
- 28.Xu X, Rials SJ, Wu Y, Salata JJ, Liu T, Bharucha DB, et al. Left ventricular hypertrophy decreases slowly but not rapidly activating delayed rectifier potassium currents of epicardial and endocardial myocytes in rabbits. Circulation. 2001;103:1585–90. doi: 10.1161/01.cir.103.11.1585. [DOI] [PubMed] [Google Scholar]
- 29.Kanters JK, Haarmark C, Vedel-Larsen E, Andersen MP, Graff C, Struijk JJ, et al. Tpeak Tend interval in long QT syndrome. J Electrocardiol. 2008;41:603–8. doi: 10.1016/j.jelectrocard.2008.07.024. [DOI] [PubMed] [Google Scholar]
- 30.Wolk R, Mazurek T, Lusawa T, Wasek W, Rezler J. Left ventricular hypertrophy increases transepicardial dispersion of repolarisation in hypertensive patients: A differential effect on QTpeak and QTend dispersion. Eur J Clin Invest. 2001;31:563–9. doi: 10.1046/j.1365-2362.2001.00850.x. [DOI] [PubMed] [Google Scholar]
- 31.Kumar R, Fisher M, Macfarlane PW. Diabetes and the QT interval: Time for debate. Br J Diabetes Vasc Dis. 2004;4:146–50. [Google Scholar]
- 32.Crouch MA, Limon L, Cassano AT. Clinical relevance and management of drug-related QT interval prolongation. Pharmacotherapy. 2003;23:881–908. doi: 10.1592/phco.23.7.881.32730. [DOI] [PubMed] [Google Scholar]
- 33.Schutte D, Obel WP. Dangerous and life-threatening drugs-practical lessons from the long QT syndrome. Cardiovasc J S Afr. 2002;13:54–61. [PubMed] [Google Scholar]
- 34.Sohaib SM, Papacosta O, Morris R, Macfarlane PW, Whincup PH. Length of the QT interval: Determinants and prognostic implications in a population-based prospective study of older men. J Electrocardiol. 2008;41:704–10. doi: 10.1016/j.jelectrocard.2008.01.010. [DOI] [PubMed] [Google Scholar]
- 35.Mozos I, Serban C, Costea C. The renal function and the QT interval in hypertensive patients. Rom Rev Lab Med. 2010;2/4(18):36. [Google Scholar]
- 36.Mozos I, Costea C. Serum cholesterol, triglycerides and the QT interval in hypertensive patients. Atheroscler Suppl. 2010;2:132. [Google Scholar]
- 37.Funada A, Hayashi K, Ino H, Fujino N, Uchiyama K, Sakata K, et al. Assessment of QT intervals and prevalence of short QT syndome in Japan. Clin Cardiol. 2008;31:270–4. doi: 10.1002/clc.20208. [DOI] [PMC free article] [PubMed] [Google Scholar]
- 38.Dias da Silva VJ, Ferreira Neto E, Salgado HC, Fazan R., Jr Chronic converting enzyme inhibition normalizes QT interval in aging rats. Braz J Med Biol Res. 2002;35:1025–31. doi: 10.1590/s0100-879x2002000900003. [DOI] [PubMed] [Google Scholar]
- 39.Bennett MT, Gula LJ, Klein GJ, Skanes AC, Yee R, Chattha I, et al. Do beta-blockers affect non corrected QT interval in type 1 long QT syndrome? Circulation. 2009;120:S653. [Google Scholar]


