Abstract
The objective of the present investigation was to study the effect of β-cyclodextrin (β-CD) on the in vitro dissolution of aceclofenac (AF) from molecular inclusion complexes. Aceclofenac molecular inclusion complexes in 1:1 and 1:2 M ratio were prepared using a kneading method. The in vitro dissolution of pure drug, physical mixtures, and cyclodextrin inclusion complexes was carried out. Molecular inclusion complexes of AF with β-CD showed a considerable increase in the dissolution rate in comparison with the physical mixture and pure drug in 0.1 N HCl, pH 1.2, and phosphate buffer, pH 7.4. Inclusion complexes with a 1:2 M ratio showed the maximum dissolution rate in comparison to other ratios. Fourier transform infrared spectroscopy and differential scanning calorimetry studies indicated no interaction between AF and β-CD in complexes in solid state. Molecular modeling results indicated the relative energetic stability of the β-CD dimer-AF complex as compared to β-CD monomer-AF. Dissolution enhancement was attributed to the formation of water soluble inclusion complexes with β-CD. The in vitro release from all the formulations was best described by first-order kinetics (R2 = 0.9826 and 0.9938 in 0.1 N HCl and phosphate buffer, respectively) followed by the Higuchi release model (R2 = 0.9542 and 0.9686 in 0.1 N HCl and phosphate buffer, respectively). In conclusion, the dissolution of AF can be enhanced by the use of a hydrophilic carrier like β-CD.
Keywords: Aceclofenac, complexes, cyclodextrin, solubility, β-CD
Up to 40% of new chemical entities discovered by the pharmaceutical industry today are poorly soluble or lipophilic compounds.[1] The solubility issues complicating the delivery of these new drugs also affect the delivery of many existing drugs. Poorly water-soluble drugs show unpredictable absorption, since their bioavailability depends upon the dissolution in the gastrointestinal tract.[2–4] The dissolution characteristics of poorly soluble drugs can be enhanced by several methods.[5–7] Cyclodextrin and their derivatives play an important role in formulation development due to their effect on solubility, dissolution rate, chemical stability, and absorption of drugs. Though cyclodextrins have been investigated widely during the last two decades, their commercial application in pharmaceutical formulation was started only in recent years with drugs such as piroxicam and nimesulide.[8] Aceclofenac (AF) is a new generational nonsteroidal anti-inflammatory drug showing effective anti-inflammatory and analgesic properties and a good tolerability profile in a variety of painful conditions like ankylosing spondylitis, rheumatoid arthritis and osteoarthritis. AF is very slightly soluble in water[9] and therefore an attempt has been made to prepare inclusion complexes of AF with β -cyclodextrin (β-CD) with an aim to improve its extent and rate of dissolution.
Materials and Methods
Materials
AF (Ipca Laboratories, Mumbai, Maharashtra, India) and β-CD (Himedia Laboratories Limited, Mumbai, Maharashtra, India) of commercial purity grade were used. All other chemicals used were of analytical reagent grade.
Preparation of physical mixtures
The physical mixtures were prepared by manually mixing preweighed amounts of mesh no. 100 sieve fractions of AF and β-CD.[10,11]
Preparation of molecular inclusion complexes
Solid inclusion complexes of AF with β-CD were prepared in 1:1 and 1:2 molar ratios using a kneading method. An accurately weighed quantity of β-CD was taken in a glass mortar; water was added slowly and mixed to obtain a homogeneous paste. The weighed quantity of AF was added slowly by grinding. The mixture was ground for 1 h. During this process appropriate quantity of water was added to maintain a suitable consistency. The obtained solid mass was further dried under vacuum to a constant weight at room temperature and pulverized, sieved through mesh no. 100 and stored in a desiccator.[10–12]
Phase solubility studies
The phase solubility studies were performed according to the method reported by Higuchi and Connors.[13] The excess amount of AF (50 mg) was added to 25 ml of the aqueous solution (pH 7.0) containing various concentrations of β-CD (1-15 mM) in a series of stoppered conical flask and the mixtures were shaken at 30°C for 24 h at room temperature on a rotary flask shaker. After equilibration, the solutions were filtered immediately using a 0.5 μm nylon disk filter. The filtered samples were suitably diluted and assayed for the drug content using JascoV-530 UV spectrophotometer (Jasco V-530, Jasco Inc., 8649, Commerce Dr., Easton, MD-21601) against blanks prepared in the same concentration of β-CD in water so as to cancel any absorbance that may be exhibited by the cyclodextrin molecules. Shaking of aqueous solutions of drugs and β-CD were continued until the three consecutive estimations were the same. The apparent stability constant (Kc), according to the hypothesis of 1:1 stoichiometric ratio of the complexes, was calculated from the straight line of the phase solubility diagram by using Equation 1:
![]()
The values of Kc indicated the stability of the drug-β-CD complexes. The solubility experiments were conducted in triplicate.
Characterization of Molecular Inclusion Complexes
Percent yield
The percent yield of molecular inclusion complexes was calculated on the basis of dry weight (drug and carriers) and the final weight of molecular inclusion complexes was obtained:[14]
![]()
Average particle Size
The molecular inclusion complexes of were dispersed in liquid paraffin and mounted on slides and placed on the mechanical stage of the microscope (Metzer Instruments, Mathura). The microscope eyepiece was fitted with an ocular micrometer which was calibrated with a stage micrometer under 10 × 45 magnification. A particle size of 200 particles was measured using a calibrated stage micrometer and ocular micrometer. From the data, the average particle size was calculated.[15]
Hygroscopic studies
The molecular inclusion complexes were dried in a desiccator under anhydrous calcium chloride for 2 days. One hundred milligrams each of molecular inclusion complexes (w1) was placed on a watch glass and exposed to ambient atmospheric conditions (70 ± 5% RH, 30 ± 2°C) and saturation humidity conditions (99 ± 1% RH, 30 ± 2°C) for 2 days. The substance was weighed again (w2). The gain in the weight was determined and the percentage moisture gained was calculated, using the given below equation:[11]
![]()
Drug content
The content of AF in molecular inclusion complexes was estimated using the UV spectrophotometric method. The molecular inclusion complexes (100 mg) were accurately weighed and dissolved in 100 ml of 20% v/v acetic acid. The solution was suitably diluted and the absorbance was measured at 275 nm. The drug content was calculated using the regression equation.[14]
Scanning electron microscopy
Scanning electron microscopy (SEM) was carried out for 1:1 molecular inclusion complexes. The surface morphology of the selected binary systems was studied using Phillips 1500, a scanning electron microscope (JSM-840, JEOL, Japan). The powders were previously fixed on a brass stub using a double-sided adhesive tape and then were made electrically conductive by coating in vacuum, with a thin layer of gold (approximately 300 Å), for 30 s and at 30 W. The micrographs were taken at an excitation voltage of 15 kV and a magnification of × 750 or × 5000.[16]
Molecular modeling studies
Molecular modeling studies involved the docking studies and were carried out using fast rigid exhaustive docking (FRED) docking software, version 2.2.2 (Open Eye Scientific Software, Inc.). The structures of the ligand, namely, AF were drawn using Marvin Sketch and the structures were then minimized using molecular mechanics force field (MMFF) in Omega, version 2.2.1 (Open Eye Scientific Software, Inc.) until the derivatives were less than 0.01 kcal/mol. FRED performs an exhaustive docking by enumerating possible poses of ligand around the binding site by rigidly rotating and translating each conformer within the site followed by filtering the pose ensemble by rejecting the poses that do not fit within the larger of the two volumes specified by the receptor file's shape potential grid and an outer contour. With the aim of testing the ability of FRED to converge into solutions that are possible inside the β-CD, a box of volume, 657Å3 was set up in such a way that it covered the internal cavity of monomeric β-CD. Docking studies were carried out in both monomeric and dimeric form of β-CD. The structures of β-CD in monomeric and dimeric forms were taken from the Cambridge Structural Database (reference code PIJGIY).[17,18] The following procedure was employed on the β-CD docking simulations: lowest energy conformers for AF molecules were docked in monomeric and dimeric forms of β-CD and scored by the Chemgauss scoring function of FRED. The binding energy for the ligand-β-CD complex was calculated in terms of the Chemgauss score.
Fourier transform infrared spectroscopic studies
Fourier transform infrared (FTIR) spectra were routinely obtained to assess the drug-carrier interaction using Shimadzu FTIR-8400S Fourier transform infrared spectrophotometer. FTIR spectral studies were carried out for the pure drug, freshly prepared, and 6-month-old 1:1 molecular inclusion complexes and individual substances to check the compatibility between drug and carriers. Interaction between the components, if any, was indicated by either producing additional peaks or absence of the characteristic peaks corresponding to the drug and carrier.[19]
Differential scanning calorimetric studies
Differential scanning calorimetric (DSC) studies were carried to check the compatibility between drug and carriers. DSC studies were carried out for the pure drug, freshly prepared, and 6-month-old 1:1 molecular inclusion complexes. All dynamic DSC studies were carried out on a calibrated Shimadzu DSC-50 thermal analyzer. Calorimetric measurements were made with an empty cell (high-purity alpha alumina discs as reference). The dynamic scans were taken in nitrogen atmosphere at the heating rate of 10°C/min. Interaction between the drug and polymer, if any, was indicated either by a shift in the peak or presence of additional peaks at temperatures other than those corresponding to the drug and carrier.[19]
In vitro release studies
In vitro release studies were carried out using the basket type USP XXII dissolution test apparatus (TDT, O6T (Electrolab)).[20] Release studies were carried separately for the pure drug, physical mixtures, and molecular inclusion complexes of AF for 2 h. The pure drug (100 mg) and formulations containing drug content equivalent to 100 mg of AF was separately studied for in vitro release. Dissolution was carried out in 900 ml of 0.1 N hydrochloric acid solution, pH 1.2, and phosphate buffer, pH 7.4, separately, with a stirring speed of 50 rpm at a temperature of 37 ± 0.5°C. Five-milliliter aliquots of dissolution medium were withdrawn at an interval of 5 mins for first 15 mins and then at 15 mins intervals, for the rest of the 2-h study and filtered through a 0.45 μm filter. The volume withdrawn at each time was replaced with an equal volume of the prewarmed dissolution medium. The absorbance of the suitably diluted solutions was measured at 275 nm. The drug content was calculated using regression equation. The dissolution experiments were conducted in triplicate.[21]
Kinetic analysis of drug release
The dissolution profiles of all the molecular inclusion complexes were subjected to the kinetic analysis to establish the drug-release mechanism. The release data were fitted to zero order (Equation 4), first order (Equation 5), matrix (Higuchi model; Equation 6), and Hixson-Crowell equations (Equation 7) to ascertain the kinetic modeling of drug release:[22]

where Qt is the amount of drug released at time t, Q0 is the initial amount of drug in the formulation, and k0, k1, kH, and kHC are release rate constants for zero order, first order, Higuchi model, and Hixson-Crowell rate equations.
Results and Discussions
Phase solubility studies
Phase solubility studies of AF-β-CD systems in water at 25°C revealed that the solubility of AF increased linearly with the increase in the concentration of β-CD, showing a typical AL-type phase solubility curve. Since the slope of the phase solubility curve was <1 for AF, the increase in the solubility was due to the formation of stoichiometric 1:1 M complex in the solution with β-CD. The apparent stability constant (Kc) was calculated from the slope of the linear plot of the phase solubility diagram and was found to be 487.87 M–1.
Characterization of molecular inclusion complexes of aceclofenac
All the β-CD molecular inclusion complexes prepared were found to be fine and free-flowing powders.
Percent yield
As indicated in Table 1, the percentage yield ranged from 95.2% to 98.0% for the β-CD molecular inclusion complexes. Low coefficient of variance (CV) values (<1.0%) in percentage yield indicate the reproducibility of the technique employed for the preparation of molecular inclusion complexes.
Table 1.
Physical characteristics of molecular inclusion complexes of aceclofenac

Average particle size
Average particle size was found to be within the range of 50.3-70.9 mm [Table 1]. This narrow range of particle size was satisfactory from the point of improving the aqueous solubility.
Drug content
The percentage entrapment of the drug in β-CD molecular inclusion complexes was found to be approximately nearer to the theoretical values [Table 1]. A low value of CV (<1.0) indicates the uniformity of the drug content in the product. The obtained results implied that the drug remained stable during preparation.
Hygroscopic studies
Results for the percent weight gain by β-CD complexes are shown in Table 2. The hygroscopicity of the binary system containing AF-β-CD in the 1:2 M ratio was found to be more in comparison with other carriers under ambient as well as saturation humidity conditions. Similar results were reported by Sethia and Squilante[23] with carbamazepine and Martinez-ohariz et al.[24] with diflunisal.
Table 2.
Determination of hygroscopicity of molecular inclusion complexes of aceclofenac

Scanning electron microscopy
The scanning electron micrographs of AF molecular inclusion complexes are given in Figure 1. AF appeared as irregular-shaped crystals, and β-CD has shown a parallelogram shape. The original morphology of all other binary systems (molecular inclusion complexes) had disappeared and it was not possible to differentiate between the two components. All the binary systems appeared as agglomerates exhibiting the presence of a homogeneous solid phase of amorphous nature. The existence of a single phase is also responsible for the enhanced drug dissolution in comparison to pure AF.
Figure 1.
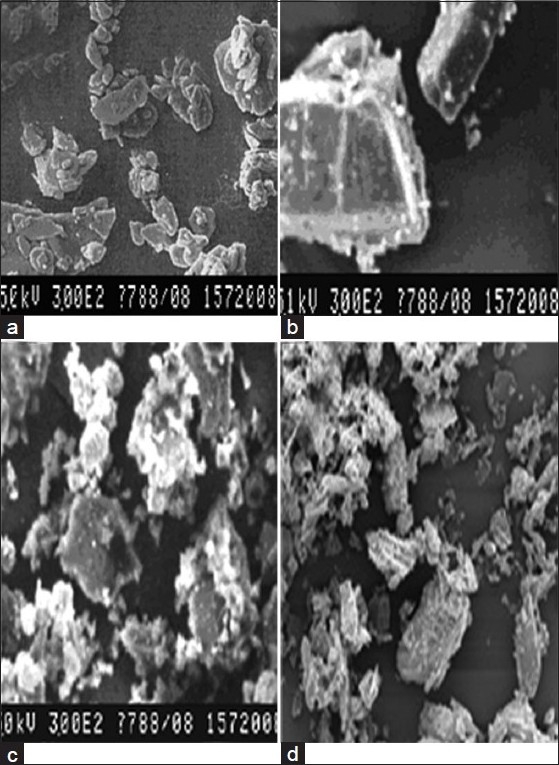
Scanning electron photomicrographs of aceclofenac (a); β-cyclodextrin (b); aceclofenac-β-CD inclusion complex (1:1 M) (c); aceclofenac-β-CD inclusion complex (1:2 M) (d)
Molecular modeling studies
The possible ways of the formation of AF-β-CD complexes as obtained by molecular modeling using FRED docking software are shown in Figure 2. The energy values of β-CD monomeric and dimeric forms calculated as single point energy using molecular mechanics (MM), as obtained from the Cambridge structural database were 1194.214 and 1003.499 kcal/mol. The calculated energy value for the lowest energy conformer of AF using molecular mechanics was found to be 71.822 kcal/mol. The obtained docking score (Chemguass score) using FRED docking software for AF in the β-CD monomer and dimer was – 18.48 and – 51.44, respectively.
Figure 2.
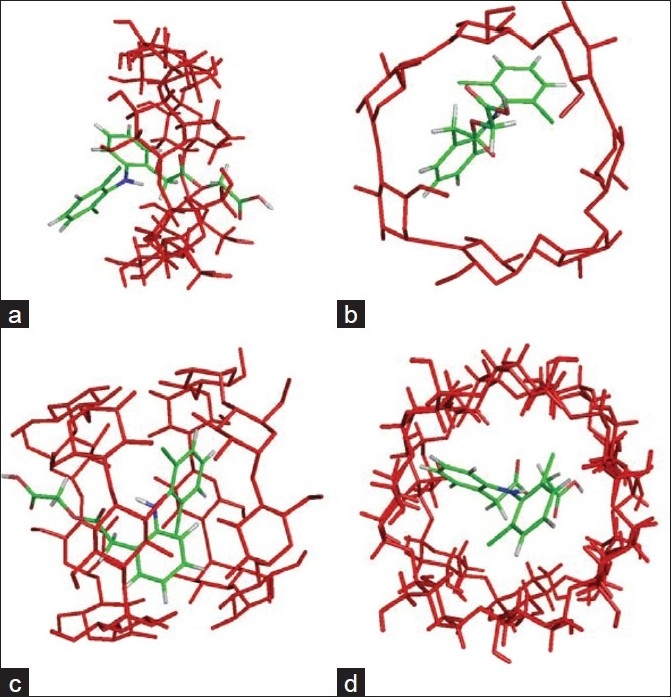
Relative host-guest geometry corresponding to the minimum of the energy of the formation of the AF-β-CD complex: (a) side view of AF in monomeric β-CD; (b) top view of AF in monomeric β-CD; (c) side view of AF in dimeric β-CD; (d) top view of AF in dimeric β-CD
The results indicated the relative energetic stability of the β-CD dimer-AF complex (–51.44) compared with the β-CD monomer-AF (–18.48) complex. A possible molecular arrangement for the energetically favorable dimer-inclusion complex is that ligand AF is buried in the cavity of the β-CD dimer in a configuration in which half of the molecule is lying in one monomer and the other half is lying in the other monomer [Figure 1c]. AF is possibly being held in the position, due to the H-bond as well as the hydrophobic interactions, more tightly in the dimeric β-CD than the monomeric form, in which the H-bond was found to be absent.
Fourier transform infrared spectroscopic studies
All the characteristic bands of AF were observed in the molecular inclusion complexes. The broadening of bands was observed to a large extent. The characteristic bands of β-CD (3305, 1420, 1460, and 1083 cm per cm) were also observed [Figure 3]. The FTIR spectra of physical mixtures and β-CD complexes indicate the reduction in the intensity of several peaks like O-H (s) and C-H (s). The absence of any significant change in the IR spectral pattern in the formulations containing the drug and carriers indicated the absence of interaction between the drug and carriers employed for the solubility enhancement.
Figure 3.
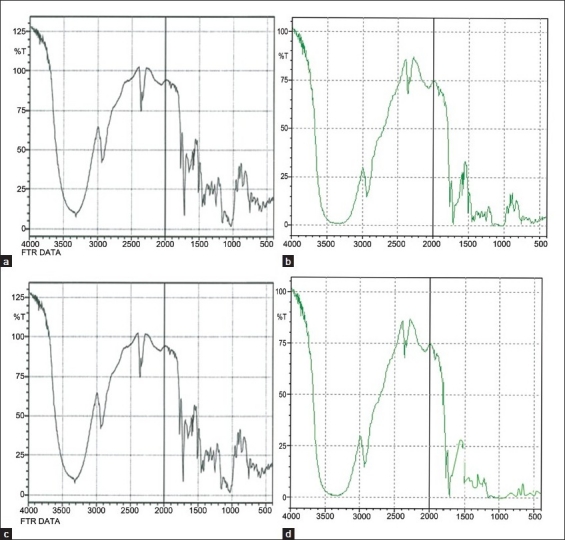
FTIR spectra of aceclofenac, physical mixtures, and different β-cyclodextrin complexes. (a) AF-β-CD (PM) 1:1 M; (b) AF-β-CD (complex) 1:1 M; (c) AF- β-CD (PM) 1:2 M; (d) AF-β-CD (complex) 1:2 M. AF = aceclofenac; β-CD = β-cyclodextrin; PM = physical mixture
Differential scanning calorimetric studies
The differential scanning calorimetric (DSC) thermograms of AF, β-CD, physical mixtures, and β-cyclodextrin complexes are given in Figure 4. The pure AF exhibited an endothermic peak at 152.48°C which represents the melting of AF and is in accordance with the literature value.[25] β-CD showed an endothermic peak at 104°C which may be attributed to a dehydration process [Figure 4b]. The DSC curve of AF-β-CD physical mixtures show peaks resulting from the superposition of their separated component DSC curves [Figures 4c and e]. In contrast, no endothermic peak corresponding to the fusion of AF was observed in the DSC curves of AF-β-CD complexes. The disappearance of this peak may be probably due to the interaction of AF with β-CD and the formation of inclusion complexes [Figures 4d and f]. DSC thermograms indicate the existence of the new solid phase and confirm FTIR spectral data concerning the presence of AF in an amorphous and homogenously dispersed state in β-CD. The DSC further supported that AF was compatible with β-CD. No additional or shift in endothermic peaks were observed which indicated the compatibility between the drug and carriers. The findings indicated that the drug was stable in β-CD molecular inclusion complexes prepared freshly and after 6 months of storage.
Figure 4.

DSC thermogram of (a) AF; (b) β-CD; (c) AF-β-CD 1:1 M (PM); (d) AF-β-CD 1:1 M (omplex); (e) AF-β-CD 1:2 M (PM); (f) AF-β-CD 1:2 M (complex). AF = aceclofenac; β-CD = β-cyclodextrin; M = molar; PM = physical mixture
In vitro release studies
In both 0.1 N HCl (pH 1.2) and phosphate buffer (pH 7.4), the physical mixtures and molecular inclusion complexes with all AF:β-CD ratios exhibited faster dissolution rates than pure AF at all time points. The dissolution rate of β-CD molecular inclusion complexes was faster as compared to their corresponding physical mixtures at all the time intervals [Table 3, Figures 5 and 6]. With the increase in the proportion of β-CD, the rate of dissolution of molecular inclusion complexes increased.
Table 3.
In vitro dissolution profile of aceclofenac-β-CD molecular inclusion complexes in 0.1 N HCl, pH 1.2, and phosphate buffer, pH 7.4
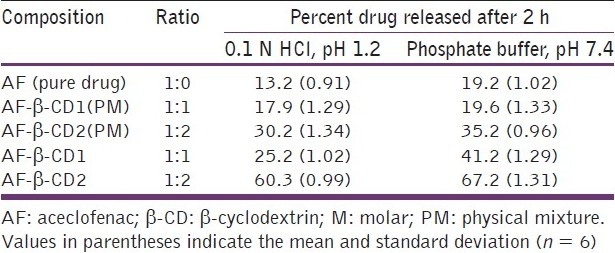
Figure 5.
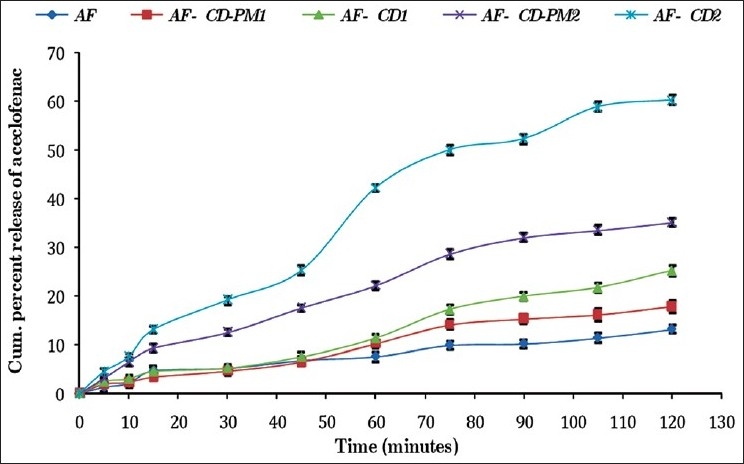
In vitro dissolution profile of aceclofenac-β-cyclodextrin inclusion complexes and their physical mixtures in 0.1 N HCl, pH 1.2
Figure 6.
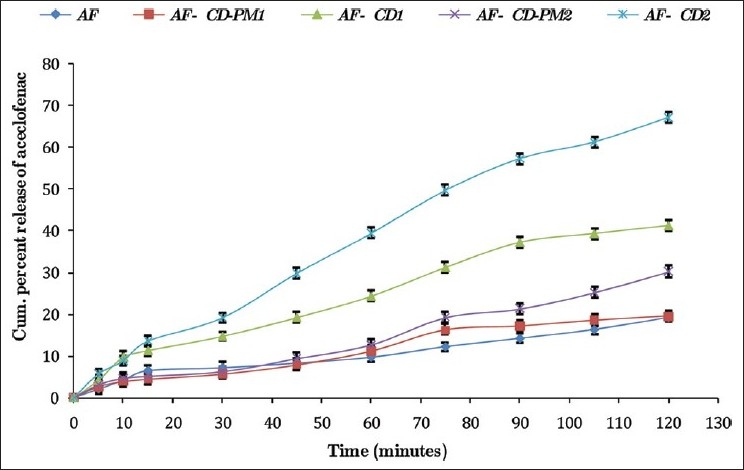
In vitro dissolution profile of aceclofenac-β-CD inclusion complexes and their physical mixtures in the phosphate buffer, pH 7.4
All the AF complexes showed a better dissolution profile in the phosphate buffer, pH 7.4, in comparison to 0.1 N HCl, pH 1.2. Similar results were reported by Soni et al.[26] in their saturation solubility studies of AF carried out in different dissolution media. Furthermore, this may be due to the weakly acidic nature of AF. With reference to pH solubility profile, the dissolution rate of AF has been shown to increase on increasing the pH of the medium.[27] This supports a higher drug release in the phosphate buffer, pH 7.4 in the present study. The drug release from different formulations was ranked in the following order: β-CD molecular inclusion complex > physical mixtures > pure drug (AF).
It was also found that the 1:2 M ratio of AF-β-CD showed maximum dissolution both in 0.1 N HCl, pH 1.2 (60.2 ± 0.99%), and phosphate buffer, pH 7.4 (66.5 ± 1.31%). The increase in the dissolution rate is due to the formation of water-soluble inclusion complexes with β-CD. The water molecules in the cavities of β-CD are in an energetically unfavored state because of the apolar nature of the cavity. The replacement of high-energy water molecules with a hydrophobic guest in the cavity is therefore favored. The removal of the high-energy molecule out of the cavity by displacement is the driving force for the formation of an inclusion complex in an aqueous solution. The guest molecule is associated with β-CD by noncovalent and weak intermolecular forces.
The interactions between the hydrophobic part of the guest and the apolar cavity causes dehydration of the hydrophobic guest molecule and its transfer into the cavity, thereby increasing the affinity toward water and hence increasing the dissolution.[28] The surfactant-like properties of CDs can also be postulated to explain the higher dissolution rate of the complexes.[29] CDs can also reduce the interfacial tension between the solid particles of drug and the dissolution medium, leading to a greater rate of dissolution.[30] The increased solubility of the physical mixture over the pure drug can be attributed to the wetting of the hydrophobic surface of AF due to the solubilization of the water-soluble carrier.
Kinetic analysis of the drug release
The kinetics of the in vitro release of the best formulations of AF (AF-β-CD, 1:2 M) was carried out. The release of the drug from all formulations was observed to follow the first order release kinetics, since the correlation coefficient (R2) for the first order was higher in comparison to the zero order release [Tables 4 and 5]. The results were in agreement with the previous investigations performed by Shivkumar et al.[31] A higher correlation, as indicated by R2 was observed for the Higuchi matrix release kinetics in all the selected formulations suggesting the diffusion as a probable prominent mechanism of drug release.[31,32] In diffusion, the rate of dissolution of drug particles within the matrix must be much faster than that of the diffusion rate of the drug leaving the matrix [Tables 4 and 5].
Table 4.
Comparison of different kinetic models applied on the in vitro dissolution profile of the β-CD molecular inclusion complex of aceclofenac in 0.1 N HCl, pH 1.2

Table 5.
Comparison of different kinetic models applied on the in vitro dissolution profile of the β-CD molecular inclusion complex of aceclofenac in the phosphate buffer, pH 7.4

Conclusions
The present study clearly shows that the addition of a hydrophilic carrier like β-CD to aceclofenac improves its dissolution rate. Further, all the molecular inclusion complexes performed better than the corresponding physical mixtures. FTIR spectroscopy and differential scanning calorimetry studies indicated no interaction between AF and β-CD in complexes in solid state. The geometrical inclusion of AF with β-CD indicated the relative energetic stability of the AF-β-CD dimer complex as compared with AF-β-CD monomer complex. The above studies conclude that the complexation of AF with β-CD lends an ample credence in enhancing its dissolution profile, which in turn has the potential to produce a faster onset of action and will also be helpful in dose reduction.
Acknowledgments
The authors wish to thank Ipca Laboratories., Mumbai, for the gift sample of aceclofenac, and IISc, Bangalore, and Punjab University, Chandigarh, for carrying out spectral analysis and DSC studies. The authors also place on record their thanks to U. P. Technical University, Lucknow, and Nitte Education Trust, Mangalore, India, for their valuable support.
Footnotes
Source of Support: Nil
Conflict of Interest: None declared.
References
- 1.Hite M, Turner SF. Pharmaceutical Manufacturing and Packing Sourcer, Part 1.Oral Deliv of Poorly Soluble Drugs, Summer. 2003. [Last cited on 2011 Jan 11]. Available from: http://www.scolr.com/lit/PMPS_2003_1.pdf .
- 2.Goldberg AH, Gibaldi M, Kanig JL. Increasing dissolution rates and gastrointestinal absorption of drugs via solid solutions and eutectic mixtures. I. Theoretical considerations and discussion of the literature. J Pharm Sci. 1965;54:1145–8. doi: 10.1002/jps.2600540810. [DOI] [PubMed] [Google Scholar]
- 3.Goldberg AH, Gibaldi M, Kanig JL. Increasing dissolution rates and gastrointestinal absorption of drugs via solid solutions and eutectic mixtures. II. Experimental Evaluation of Eutectic Mixture Urea.Acetaminophen System. J Pharm Sci. 1966;55:482–7. doi: 10.1002/jps.2600550610. [DOI] [PubMed] [Google Scholar]
- 4.Goldberg AH, Gibaldi M, Kanig JL, Mayersohn M. Increasing dissolution rates and gastrointestinal absorption of drugs via solid solutions and eutectic mixtures. IV. Chloramphenicol.urea System. J Pharm Sci. 1966;55:581–3. doi: 10.1002/jps.2600550610. [DOI] [PubMed] [Google Scholar]
- 5.Hörter D, Dressman JB. Influence of physicochemical properties on dissolution of drugs in the gastrointestinal tract. Adv Drug Deliv Rev. 2001;46:75–87. doi: 10.1016/s0169-409x(00)00130-7. [DOI] [PubMed] [Google Scholar]
- 6.Hancock BC, Zografi G. Characteristics and significance of the amorphous state in pharmaceutical systems. J Pharm Sci. 1997;86:1–12. doi: 10.1021/js9601896. [DOI] [PubMed] [Google Scholar]
- 7.Loftsson T, Brewster ME. Pharmaceutical Applications of cyclodextrins. 1. Drug solubilization and stabilization. J Pharm Sci. 1996;85:1017–25. doi: 10.1021/js950534b. [DOI] [PubMed] [Google Scholar]
- 8.Astakhova AV, Demina NB. Modern drug technologies: Synthesis, characterization, and use of inclusion complexes between drugs and cyclodextrins (A Review) Pharm Chem J. 2004;38(2):105–8. [Google Scholar]
- 9.Florey K. Vol. 20. New York: Academic Press Inc; 1991. Analytical Profiles of Drug Substances; pp. 557–600. [Google Scholar]
- 10.Dua K, Sara UVS, Ramana MV. Acidic Solubilizing additives: Solubility promoters for aceclofenac cyclodextrin systems. Int J Pharma Excip. 2007;4:101–5. [Google Scholar]
- 11.Dua K, Ramana MV, Sara UV, Himaja M, Agrawal A, Garg V. Investigation of enhancement of solubility of norfloxacin b-Cyclodextrin in presence of acidic solubilizing additives. Curr Drug Deliv. 2007;4:21–5. doi: 10.2174/156720107779314776. [DOI] [PubMed] [Google Scholar]
- 12.Patel HM, Suhagia BN, Shah SA, Rathod IS, Parmar VK. Preparation and characterization of etoricoxib-b-cyclodextrin complexes prepared by the kneading method. Acta Pharm. 2007;57:351–9. doi: 10.2478/v10007-007-0028-2. [DOI] [PubMed] [Google Scholar]
- 13.Higuchi T, Connors A. Advances in Analytical Chemistry Instrumentation. Vol. 4. New York NY: Wiley Interscience; 1965. Phase.Solubility Techniques; pp. 117–211. [Google Scholar]
- 14.Chauhan B, Shimpi S, Paradkar A. Preparation and characterization of etoricoxib solid dispersions using lipid carriers by spray drying technique. AAPS PharmSciTech. 2005;6:E405–12. doi: 10.1208/pt060350. [DOI] [PMC free article] [PubMed] [Google Scholar]
- 15.Papageorgiou GZ, Bikiaris D, Karavas E, Politis S, Docoslis A, Park Y, et al. Effect of physical state and particle size distribution on dissolution enhancement of nimodipine/PEG solid dispersions prepared by melt mixing and solvent evaporation. AAPS J. 2006;8:E623–31. doi: 10.1208/aapsj080471. [DOI] [PMC free article] [PubMed] [Google Scholar]
- 16.Bhargava S, Agrawal GP. Preparation and characterization of solid inclusion complex of cefpodoxime proxetil with beta-cyclodextrin. Curr Drug Deliv. 2008;5:1–6. doi: 10.2174/156720108783330998. [DOI] [PubMed] [Google Scholar]
- 17.Pop MM, Goubitz K, Borodi G, Bogdan M, De Ridder DJ, Peschar R, et al. Crystal structure of the inclusion complex of beta-cyclodextrin with mefenamic acid from high-resolution synchrotron powder-diffraction data in combination with molecular-mechanics calculations. Acta Crystallogr B. 2002;58:1036–43. doi: 10.1107/s010876810201947x. [DOI] [PubMed] [Google Scholar]
- 18.Aree T, Chaichit N. A new crystal form of beta-cyclodextrin-ethanol inclusion complex: Channel-type structure without long guest molecules. CarbohyDr Res. 2003;338:1581–9. doi: 10.1016/s0008-6215(03)00220-9. [DOI] [PubMed] [Google Scholar]
- 19.Aigner Z, Hassan HB, Berkesi O, Kata M, Eros I. Thermoanalytical, FTIR and X-ray studies of gemfibrozil-cyclodextrin complexes. J Therm Anal Calorim. 2005;81:267–72. [Google Scholar]
- 20.Babu MM, Prasad SD, Ramana Murthy KV. Development of new controlled release formulations of flurbiprofen: In vitro-in vivo correlation. Indian J Pharm Sci. 2002;64:37–43. [Google Scholar]
- 21.Fernandes CM, Teresa VM, Veiga FJ. Physicochemical characterization and in vitro dissolution behavior of nicardipine-cyclodextrin inclusion compounds. Eur J Pharm Sci. 2002;15:79–88. doi: 10.1016/s0928-0987(01)00208-1. [DOI] [PubMed] [Google Scholar]
- 22.Costa P, Sousa Lobo JM. Modeling and comparison of dissolution profiles. Eur J Pharm Sci. 2001;13:123–33. doi: 10.1016/s0928-0987(01)00095-1. [DOI] [PubMed] [Google Scholar]
- 23.Sethia S, Squilante E. Solid dispersions of carbamazepine in PVP K30 by conventional solvent evaporation and super critical methods. Int J Pharm. 2004;272:1–10. doi: 10.1016/j.ijpharm.2003.11.025. [DOI] [PubMed] [Google Scholar]
- 24.Martínez-Ohárriz MC, Rodríguez-Espinosa C, Martín C, Goñi MM, Tros-Ilarduya MC, Sánchez M. Solid dispersions of diflunisal-PVP: Polymorphic and amorphous states of drug. Drug Dev Ind Pharm. 2002;28:717–25. doi: 10.1081/ddc-120003864. [DOI] [PubMed] [Google Scholar]
- 25.Moffat AC, Osselton MD, Widdop B. 3rd ed. Vol. 2. London: Pharmaceutical Press; 2004. Clarke's analysis of drugs and poisons in pharmaceuticals, body fluids and postmortem materials; pp. 570–1. [Google Scholar]
- 26.Soni T, Chirag Nagda, Gandhi Tejal, Chotai N P. Development of discriminating method for dissolution of aceclofenac marketed formulations. Dissolut Technol. 2008;5:31–5. [Google Scholar]
- 27.Mutalik S, Naha A, Usha AN, Ranjith AK, Musmade P, Manoj K, et al. Preparation, in vitro, preclinical and clinical evaluations of once daily sustained release tablets of aceclofenac. Arch Pharm Res. 2007;30:222–34. doi: 10.1007/BF02977698. [DOI] [PubMed] [Google Scholar]
- 28.Rawat S, Jain SK. Enhancement of intestinal absorption of few COX-2 inhibitors through interaction with β-cyclodextrin. Indian J Pharm Sci. 2007;69:529–34. [Google Scholar]
- 29.Lin SY, Kao YH. Solid particulates of drug β-cyclodextrin inclusion complexes directly prepared by spray drying technique. Int J Pharm. 1989;56:249–59. [Google Scholar]
- 30.Guyot M, Fawaz F, Bildet J, Bonini F, Lagueny A M. Physicochemical characterisation and dissolution of norfloxacin/cyclodextrin inclusion compounds and PEG solid dispersions. Int J Pharm. 1995;123:53–63. [Google Scholar]
- 31.Shivakumar HN, Desai BG, Deshmukh G. Design and optimization of diclofenac sodium controlled release solid dispersions by response surface methodology. Indian J Pharm Sci. 2008;70:22–30. doi: 10.4103/0250-474X.40327. [DOI] [PMC free article] [PubMed] [Google Scholar]
- 32.Goracinova K, Klisarova L J, Simov A, Fredro-kumbaradzi E, Petrusevska-tozi L. Preparation, physical characterisation, mechanisms of drug/polymer interactions and stability studies of controlled release of solid dispersion granules containing weak base as active substance. Drug Deliv Ind. Pharm. 1996;22:255–62. [Google Scholar]


