

Abstract
We present an initial evaluation of a mechanically-cooled, high-purity germanium double-sided strip detector as a potential gamma camera for small-animal SPECT. It is 90 mm in diameter and 10 mm thick with two sets of 16 orthogonal strips that have a 4.5 mm width with a 5 mm pitch. We found an energy resolution of 0.96% at 140 keV, an intrinsic efficiency of 43.3% at 122 keV and a FWHM spatial resolution of approximately 1.5 mm. We demonstrated depth-of-interaction estimation capability through comparison of pinhole acquisitions with a point source on and off axis. Finally, a flood-corrected-flood image exhibited a strip-level uniformity of less than 1%. This high-purity germanium offers many desirable properties for small-animal SPECT.
1. Introduction
Attempts to apply segmented germanium planar detectors to nuclear medicine imaging extend back at least forty years (McCready et al., 1971). These early efforts were hindered by difficulties with detector fabrication, cumbersome electronics, and limited computing power, in addition to the need for a bulky liquid nitrogen dewar to achieve required operating temperatures (Rusinek et al., 1980; Hasegawa et al., 1991). Advances in electronics in addition to compact mechanical cooling systems have made High-Purity Germanium (HPGe) systems much more feasible for biomedical applications. HPGe counting detectors are known for their excellent energy resolution. However, when double-sided strip detectors (DSSDs) are utilized, good spatial resolution is also possible. Because of this, position-sensitive HPGe detectors are being investigated for use in a variety of applications including environment remediation (Phlips et al., 2002) and astronomy (Wulf et al., 2003; Wunderer et al., 2006).
Although there are currently a variety of HPGe systems in use for a range of research applications, this latest generation of position-sensitive HPGe detectors so far has not been widely investigated for biomedical imaging. The exception to this is the Liverpool group, who have focused on applications for PET or Compton imaging (Cooper et al., 2007). While one group has published results of germanium strip detector performance (Gros et al., 2009), their testing focused on characterizing the degree of charge sharing between strips, charge loss, and the influence of detector design on these problems. This paper instead focuses on characterizing detector properties that are relevant to small-animal SPECT imaging: energy resolution, detection efficiency at relevant energies, intrinsic spatial resolution, depth-of-interaction estimation capabilities, scatter rejection, and uniformity.
2. Methods
All measurements were performed using a mechanically-cooled HPGe detector from PHDs Co. (Knoxville, TN, USA). This double-sided strip detector was fabricated from a germanium crystal 90 mm in diameter and 10 mm thick using amorphous-semiconductor contacts (Hansen and Haller, 1977; Luke et al., 1992; Luke et al., 2000). The system can be seen in figure 1(a) with the detector structure shown in figure 1(b). It consists of two sets of 16 orthogonal strips that are each 4.5 mm wide with a 5 mm strip pitch and offers a total active area of 55.1 cm2. The system is mechanically cooled to approximately 60 K. It is operated at a bias voltage of 600 V (Vdepletion = 300 V). The system includes an electronic signal processing and readout system referred to as SPECT32. It consists of FPGA-based filtering and processing capable of recording approximately 450,000 cps.
Figure 1.

(a) A photo of the HPGe detector system with the germanium detector cryostat, mechanical cooler, SPECT32 readout, and Imager32 software in view. (b) A photo showing the germanium crystal positioned inside of the cryostat with the strip layout and electrical contacts visible. (c) An example of a flood image acquired with the HPGe system. The physical gaps between strips of the detector are portrayed in image space as rows and columns of zero counts.
The Imager32 software also included in the system provides sub-strip position estimation based on measurement of the transient signals induced on both strips neighboring the charge-collecting strip. The difference between these transient signals is then normalized by the signal amplitude on the charge-collecting strip, giving a difference ratio for each interaction. A flood illumination (figure 1(c)) is used to acquire a series of histograms of these difference ratios for each strip. By dividing the difference-ratio histogram for each strip into nine groups containing an equal number of counts, boundary values are established for assigning subsequent events to pixels measuring 0.5 mm × 0.5 mm. Similar methods have been used previously with other germanium strip detectors (Burks et al., 2004). Depth of interaction can be estimated with this system by using the difference between the measured rise times of the signals collected on the anode and cathode (Amman and Luke, 2000; Wulf et al., 2002; Hayward and Wehe, 2009).
2.1. Energy Resolution
Previous studies have shown that HPGe detectors can have energy resolution below 1% at 122 keV (Gros et al., 2009). To investigate our specific detector's capabilities, we acquired flood data over the entire detector using four different isotopes in the same acquisition. Technetium-99m, Iodine-123, Indium-111, and Cobalt-57 sources were placed together in front of the detector and data collected until each isotope's main energy peak had at least 500,000 counts. FWHM was determined with a Gaussian fit for each isotope's photopeak. In addition a separate scan with only Technetium-99m was carried out to evaluate energy resolution at 140 keV without the potentially confounding effect of background from partial energy deposition from gamma rays of higher energy undergoing Compton interactions in which the secondary photon escaped.
2.2. Detection Efficiency
Ideally all photons emitted from a source that fall within the solid angle of the detector would be detected. In actuality there are physical limitations as to what percentage of photons incident on the detector interact and are subsequently recorded. To experimentally determine this, the detector was flood-illuminated with a Cobalt-57 source positioned 50 cm from the surface of the detector. Intrinsic efficiency was calculated using equation (1), where N is number of counts recorded within a ±3 keV window about the photopeak, S is the number of emitted photons, and Ω is the solid angle defined in equation (2), where A is the active area of the detector and d is the distance from the source to the detector.
| (1) |
| (2) |
In order to estimate the maximum efficiency to be expected, a simulation was performed. Monte Carlo N-Particle version 5 (MCNP5) was used to simulate the flood-illumination scan previously described. A monolithic slab of germanium of the same size as the detector was illuminated by a 122 keV point source set 50 cm on axis from the detector surface. 106 simulated photons were emitted within a cone that matched the solid angle of the actual experiment to minimize computation time. Detector effects, such as energy resolution and spatial response, were not modeled. An upper limit of the detection efficiency was estimated from the number of fully absorbed 122 keV photons, determined from the simulated event histories, divided by the total number of incident photons on the detector.
2.3. Spatial Resolution
To estimate the spatial resolution of the HPGe system, we used a 116-μm wide and 3-cm long slit in a 2-cm thick block of ostalloy, a low-melting point alloy consisting of 50% Bi, 26.7% Pb, 13.3% Sn, and 10% Cd. The ostalloy slit was placed against the detector entrance window on a translation stage along with a 100 μCi Cobalt-57 source that was aligned to the slit. Although not displayed in figure 1, there is approximately 2.9 cm of space between the entrance window and the detector crystal, which leads to a magnification of the slit width when projected on the detector that was calculated to be 0.45 mm.
A series of five one-hour scans were acquired with the stage translated 0.1 mm between scans. Each scan's pixel data were then shifted the distance of the translation stage's movement and were combined to form a single “over-sampled” image with 0.1-mm sampling instead of the detector's 0.5-mm sampling. For example, for one orthogonal line profile, the first scan's position can be considered 0, with the second scan shifted by 0.1 and the third scan by 0.2 mm. This method is similar to acquiring a pre-sampled modulation transfer function using an angulated slit (Fujita et al., 1992). Line profiles were created for 27 rows of the over-sampled data and fitted with Gaussians to obtain an estimate of the FWHM for each. The average FWHM of the fits across the line profiles was used to determine the system's spatial resolution.
2.4. Depth of Interaction
In addition to x-y localization, the Imager32 software divides interactions into 1-mm thickness depth bins, based on the 50% CFD time differences between the collecting strips on the front and back of the detector. To illustrate this depth-of-interaction capability, we attached a 1-mm diameter pinhole collimator to the detector entrance window. This pinhole aperture consisted of a ~5-mm thick tungsten insert in a 1-cm thick ostalloy plate. We then imaged a 100 μCi Cobalt-57 source located 10 cm directly in front of the pinhole, followed by a scan with the source shifted 7 cm off-center from the pinhole, giving a 35° angle of incidence for the primary ray running from the source to the detector through the middle of the pinhole. Viewing the projection data by depth of both the on- and off-axis scans illustrates how well depth can be resolved in this system.
2.5. Scatter Rejection
Image resolution is degraded by the inclusion of scattered photons that fall within the energy window. Scatter profiles were interrogated in this system by acquiring two separate scans with a Cobalt-57 source, one with and one without a scatter medium present. Figure 2 shows the location of the source (1 mm active diameter and length) inside the 5 cm diameter water phantom placed near the detector with the same 1-mm pinhole as the depth-of-interaction measurement in between. The energy window for inclusion in the image was ±3 keV about 122 keV.
Figure 2.
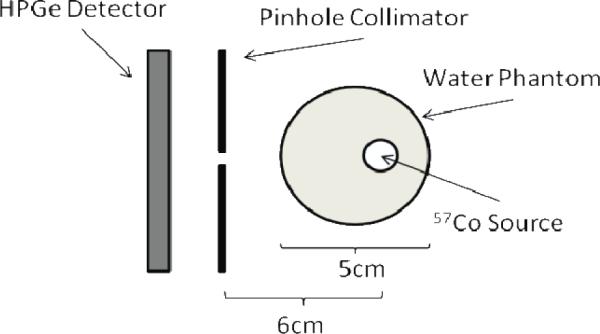
A 2D schematic of the water phantom imaging setup used to examine the scatter-rejection capabilities of the detector.
2.6. Detector Uniformity
Uniformity was determined from two 10-hour flood images with a 100 μCi Cobalt-57 source located 30 cm from the face of the detector. Counts were recorded for events falling within a ±3 keV window about the 122 keV photopeak. The first acquired image was used to create a normalization file, while the second image was normalized with the previously determined file. Both the uncorrected and flood-corrected flood images were used to determine the integral and differential uniformities according to the NEMA performance measurements standards for gamma cameras (NEMA, 2007). Uniformity was determined for both the useful field of view (UFOV) and central field of view (CFOV) at both the level of intersecting strips (strip data), which is based on the combination of charge-colleecting strips on each side, and of the 0.5 mm × 0.5 mm pixels to which interaction positions are estimated (pixel data). The pixels corresponding to gaps between strips were removed from the image prior to calculation since no events are recorded in these. The UFOV included only regions in which both charge-collecting strips (front and back) had neighboring strips on both sides, since sub-strip position-estimation using the transient signal of a single neighboring strip is not as reliable as that based on signals on two neighbors. Following NEMA guidelines, the CFOV was defined as the central 75% of the UFOV. The dataset contained an average of 3,875 counts per pixel (~314kcounts per strip intersection).
3. Results
3.1. Energy Resolution
The whole-detector pulse-height spectrum from the multi-radionuclide acquisition can be seen in figure 3. The FWHM values determined for each energy peak were: 1.11%, 0.96%, 0.88%, 0.82, and 0.60% at 122, 140, 159, 1771, and 245 keV, respectively. In addition, the overall system's energy resolution determined using Tc-99m data alone was found to be 0.96% at 140 keV, unchanged from the multi-radionuclide measurement. While the detector does exhibit soome variation in energy resolution across the detector as well as across pixels within an individual cross-strip region, this ranges between 0.81% and 1.28% FWHM at 140 keV.
Figure 3.

A multi-radionuclide energy spectrum of Co-57 (122 keV and 136 keV), Tc-99m (140 keV), I-123 (159 keV) and In-111 (171 keV and 245 keV) acquired with the HPGe detector. The energy resolution of our HPGe detector provides sharp and distinguishable photopeaks, which makes it ideal for nuclear imaging using multiple radionuclides.
3.2. Detection Efficiency
The detection efficiency calculated for the Cobalt-57 flood using equations (1) and (2) was 43.3% at 122 keV. The simulation showed that 84.7% of all 122 keV photons incident on a monolithic germanium detector of this size would be expected to deposit their full energy. Charge loss for interactions occurring in the gap region between strips reduces the detection efficiency, as these events can fall outside of the energy window for acceptance due to incomplete charge collection or charge sharing across neighboring strips. Since ~19% of the detector area consists of gaps between strips, event losses due to these gaps could reduce the expected intrinsic efficiency to 68.6%. The simulation also indicated that up to 30.5% of absorbed events Compton scatter in their first interaction within the detector. Because the current event processing requires that charge be collected on a single strip on each detector side, any Compton-scatter events in which energy deposition is distributed across multiple strips are lost. This combination of effects appears to account for nearly all of the discrepancy between the simulated and measured efficiencies, but a detailed simulation of the spatial distribution of Compton-scatter events would be needed to make a more precise comparison.
3.3. Spatial Resolution
Figure 4(a) shows data from a single 1-hour slit acquisition; the box indicates the region over which spatial resolutions were estimated by fitting Gaussians to line profiles from each row of pixels. A representative line profile and its Gaussian fit are shown in figure 4(b). The resulting mean spatial resolution over the indicated region is 1.44 ± 0.04 mm FWHM. Figure 4(c) shows that the spatial resolution varies little along a strip, with strip positions 0, 10, 20, and 30 corresponding to gaps between the orthogonal strips on the opposite side of the detector.
Figure 4.

The results of our spatial resolution characterization using a Cobalt-57 source aligned with a 116 micron slit. (a) A slit image with a box encompassing three strips where FWHMs were measured along the vertical axis. (b) A line profile constructed from the oversampled slit images centered at the vertical line in (a). This oversampled line profile was fitted to a Gaussian curve and used to calculate the FWHM at one position. (c) A plot showing the FWHM measurements across the box region in (a). The arrow in (c) represents the position of the vertical line in (a).
3.4. Depth of Interaction
Line profiles taken for both on- and off-axis pinhole images at each depth are plotted in figure 5 as lateral position versus depth. While the source positioning for the on-axis measurement was done by visual alignment with the pinhole, the data reveal that the source was actually located slightly off axis, as can be seen in figure 5(a). As expected for the off-axis image, the maximum intensity at each depth is shifted. In both cases the fall off in counts with increasing depth exhibits an exponential decrease except for a displacement of some counts from the first depth to the second. The depth assignment is based on a linear model of the variation in charge-collection times with depth, but this model breaks down for interactions occurring very close to one electrode due to the very short collection times of one charge carrier, causing some events to be misplaced.
Figure 5.

Lateral position versus depth plots demonstrating the depth of interaction estimation capabilities of the HPGe detector when the source is on axis with the pinhole (a) and when the source is 7 cm off axis with the pinhole, making a 35o angle of incidence with the detector (b). Ten 1-mm depth bins are clearly seen in (b) with a vertical gap at pixel 90 corresponding to the gap between strips. Note that the count levels are different in the two images because the two acquisitions were not equal in duration.
3.5. Scatter Rejection
Line profiles were taken through pinhole images acquired with and without a water phantom. Direct assessment of line profiles taken through pinhole images acquired with and without a water phantom present showed no discernible visual differences in the widths of the line profiles. We subsequently fitted the line profiles with Gaussians to probe differences at a finer scale. Figure 6 shows the normalized line profiles of both the source in air and in the water phantom. The fits gave a FWHM (FWTM) of the source in air of 2.21 mm (4.04 mm) and FWHM (FWTM) of the source with scatter medium of 2.23 mm (4.07 mm). There was a 33.4% decrease in counts when the water phantom was present due to attenuation, yet there was essentially no change in either the FWHM or FWTM between the two images. This clearly demonstrates the benefit of the outstanding energy resolution and subsequent ability to use a narrow energy window to exclude scattered photons.
Figure 6.
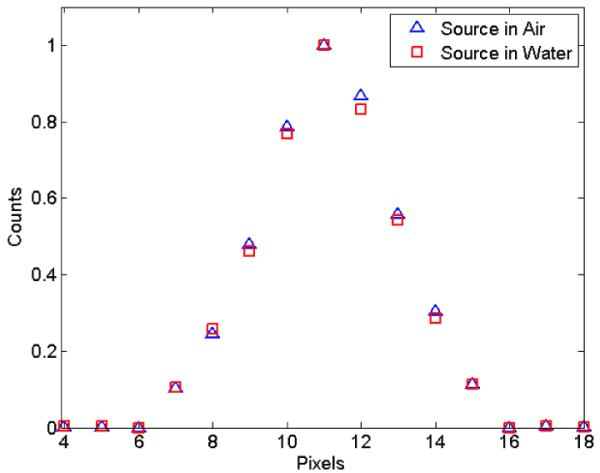
Normalized line profiles through the resultant projection data with and without the water phantom. No significant degradation in FWHM or FWTM is observed with the scatter medium present.
3.6. Detector Uniformity
Table 1 shows the integral and differential uniformity at both pixel and strip levels for both the uncorrected and corrected flood. At the strip level the uniformity in both the useful and central field of view was below 1% after flood correction, while at the pixel level the highest value for the central field of view was the integral uniformity, which was 4.11%. At the strip level the values for the UFOV and CFOV are identical because the regions are identical. The asymmetry in differential row and differential column uniformities arises primarily due to the copper and indium electrical contacts near the end of each strip giving rise to a small amount of attenuation.
Table 1.
Uniformity Measurements
| Uncorrected Flood | Corrected Flood | |||||||
|---|---|---|---|---|---|---|---|---|
| Pixel Data | Strip Data | Pixel Data | Strip Data | |||||
| UFOV | CFOV | UFOV | CFOV | UFOV | CFOV | UFOV | CFOV | |
| Integral | 42.26% | 41.57% | 7.71% | 7.71% | 6.98% | 4.11% | 0.35% | 0.35% |
| Differential Row | 32.56% | 27.00% | 1.80% | 1.80% | 5.26% | 3.32% | 0.27% | 0.27% |
| Differential Column | 28.95% | 26.65% | 7.07% | 7.07% | 3.47% | 2.77% | 0.23% | 0.23% |
4. Discussion
Although previous studies have explored a variety of applications for HPGe detectors, few have investigated the system performance properties most relevant for biomedical imaging. Table 2 summarizes the measured detector properties for this prototype system. The excellent energy resolution of our system is at the same level of similar HPGe systems, and the depth-of-interaction capabilities will mitigate blurring from parallax when pinhole collimation is used. While spatial resolution was found to be a respectable 1.44 mm, there is potential for improvement. The sub-strip positioning algorithm presently used is based on the difference in the fast transient signals induced on nearest neighbor strips with the binning of these differences determined from flood data assuming a uniform distribution. More sophisticated signal processing, such as the use of maximum-likelihood estimation (Barrett et al., 2009) or pulse-shape analysis (Blair et al., 1999), may yield improvements in the spatial resolution in all three dimensions. More accurate sub-strip positioning could potentially lead to better detector uniformity as well. Uniformity requirements are dependent on both the system being used and the imaging task. One clinical system, the Siemens MultiSPECT 3, an older scintillator-based system, requires integral uniformity in the central field of view to be lower than 3.5% or recalibration must be done (Kuikka et al., 1993). Other newer systems, such as a CZT system intended for use in clinical scintimammography, report integral uniformity in the useful field of view to be 2 to 3% (Mueller et al., 2003). On the other hand, a newly developed preclinical SPECT system using a CdTe detector was found to have integral and differential uniformities of 28.5% and 26.3%, respectively (Ogawa et al., 2009). While the present system exhibits uniformity on par with these systems, further improvements in pixel-level uniformity are desirable.
Table 2.
Summary of Results
| Detector Property | Result |
|---|---|
| Energy Resolution | 0.96% at 140 keV |
| Intrinsic Efficiency | 43.3% at 122 keV |
| Spatial Resolution | 1.5 mm |
| DOI Estimation | 1 mm depths |
| Scatter Rejection | Minimal SR degradation |
| Detector Uniformity | <1% with correction at strip level |
Although 43.3% is a useable intrinsic efficiency, it should be possible to increase the detection efficiency further. Interactions in the gap region between strips can lead either to incomplete charge collection and/or the collection of charge on two neighboring strips. The present combination of a narrow energy acceptance window and the exclusion of multi-strip events leads to the exclusion of these gap events, reducing the detection efficiency. Another group has investigated incomplete charge collection and subsequently developed a method to correct for it, leading to an increase in photopeak counts by 15% on the anode and 5% on the cathode side for a similar HPGe DSSD system (Hayward and Wehe, 2008a; Hayward and Wehe, 2008b). More recent detector fabrication techniques have demonstrated the viability of 0.25-mm width gaps, which should diminish these gap losses by a factor of two. Additional improvements in detection efficiency could be made by including Compton-scatter events in which charge is collected on multiple strips on a detector side. This type of processing and event reconstruction has already been implemented in an HPGe system used as a Compton camera using pulse-shape analysis (Vetter et al., 2004).
The most notable attribute of this detector in comparison to other technologies applied to small-animal SPECT is its outstanding energy resolution. As shown by the energy spectrum in figure 3, separation of photopeaks for a multi-radionuclide SPECT acquisition would be straightforward, and the ability to set narrow energy windows would minimize inclusion of down-scattered photons of higher energy. While scatter may not be as much of a problem for small-animal SPECT as it is for human studies, it still can affect the ability to do quantitative SPECT. Both Hwang et al. (Hwang et al., 2008) and Vanhove et al. (Vanhove et al., 2009) found that the scatter-to-primary ratio was on the order of 10% for Tc-99m imaging using a NaI(Tl) detector. Chen et al. found that failure to compensate for scatter led to an overestimation of 9.1% in a SPECT reconstruction of the activity of a small source inside of a rat-sized cylinder of water (Chen et al., 2009). While a number of scatter-correction techniques have been developed (Hutton et al., 2011), it is undoubtedly beneficial to minimize the amount of scatter included in the data in the first place.
5. Conclusion
We have demonstrated that a modern position-sensitive HPGe detector system offers many desirable properties for small-animal SPECT. The development of more advanced signal processing methods has the potential to improve performance further. Although this system is by no means fully optimized, it does represent the first germanium-detector system having a form factor somewhat practical for small-animal imaging. Presently, a germanium system is expensive relative to a traditional, continuous-crystal scintillation camera, but is on par with cameras based on pixellated scintillator or room-temperature semiconductor detectors. As current costs are largely set by the small quantities now manufactured, costs should decrease as the technology matures and becomes more widely used.
The next goal for this project is to move beyond basic characterization and to apply this germanium detector technology to small-animal SPECT imaging. A new system has been designed that will facilitate mounting on a rotating gantry. This design also decreases the distance between the detector and the entrance window, providing greater flexibility in the choice of pinhole magnification. The detector itself has a smaller gap between the strips, from the present 0.5 mm to 0.25 mm, with the same 5 mm strip pitch. The narrower gap is expected to improve the detection efficiency. These physical changes in conjunction with the discussed improvements in signal processing should result in a DSSD HPGe detector that is well suited for small-animal SPECT.
Acknowledgments
This work was supported by the Office of Science (BER), US Department of Energy grant DESC0002437, the NIH/National Center for Research Resources grant R44RR031937, and the NIH/National Cancer Institute grant R25CA136440.
References
- Amman M, Luke PN. Three-dimensional position sensing and field shaping in orthogonal-strip germanium gamma-ray detectors. Nuclear Instruments and Methods in Physics Research Section A: Accelerators, Spectrometers, Detectors and Associated Equipment. 2000;452:155–66. [Google Scholar]
- Barrett HH, Hunter WCJ, Miller BW, Moore SK, Yichun C, Furenlid LR. Maximum-Likelihood Methods for Processing Signals From Gamma-Ray Detectors. Nuclear Science, IEEE Transactions on. 2009;56:725–35. doi: 10.1109/tns.2009.2015308. [DOI] [PMC free article] [PubMed] [Google Scholar]
- Blair J, Beckedahl D, Kammeraad J, Schmid G. Spatial resolution attainable in germanium detectors by pulse shape analysis. Nuclear Instruments and Methods in Physics Research Section A: Accelerators, Spectrometers, Detectors and Associated Equipment. 1999;422:331–6. [Google Scholar]
- Burks M, Jordan E, Hull E, Mihailescu L, Vetter K. Signal interpolation in germanium detectors for improved 3-D position resolution. IEEE Symposium Conference Record Nuclear Science 2004. 2004:1114–8. [Google Scholar]
- Chen CL, Wang Y, Lee JJ, Tsui BM. Toward quantitative small animal pinhole SPECT: assessment of quantitation accuracy prior to image compensations. Mol Imaging Biol. 2009;11:195–203. doi: 10.1007/s11307-008-0181-0. [DOI] [PMC free article] [PubMed] [Google Scholar]
- Cooper RJ, Boston AJ, Boston HC, Cresswell JR, Grint AN, Mather AR, Nolan PJ, Scraggs DP, Turk G, Hall CJ, Lazarus I, Berry A, Beveridge T, Gillam J, Lewis RA. SmartPET: Applying HPGe and pulse shape analysis to small-animal PET. Nuclear Instruments and Methods in Physics Research Section A: Accelerators, Spectrometers, Detectors and Associated Equipment. 2007;579:313–7. [Google Scholar]
- Fujita H, Tsai DY, Itoh T, Doi K, Morishita J, Ueda K, Ohtsuka A. A simple method for determining the modulation transfer function in digital radiography. Medical Imaging, IEEE Transactions on. 1992;11:34–9. doi: 10.1109/42.126908. [DOI] [PubMed] [Google Scholar]
- Gros S, Hammond NJ, Lister CJ, Chowdhury P, Fischer SM, Freeman SJ. Performance tests of large area position-sensitive planar germanium detectors with conventional and amorphous contacts. Nuclear Instruments and Methods in Physics Research Section A: Accelerators, Spectrometers, Detectors and Associated Equipment. 2009;602:467–76. [Google Scholar]
- Hansen WL, Haller EE. Amorphous Germanium as an Electron or Hole Blocking Contact on High-Purity Germanium Detectors. Nuclear Science, IEEE Transactions on. 1977;24:61–3. [Google Scholar]
- Hasegawa BH, Stebler B, Rutt BK, Martinez A, Gingold EL, Barker CS, Faulkner KG, Cann CE, Boyd DP. A prototype high-purity germanium detector system with fast photon-counting circuitry for medical imaging. Medical physics. 1991;18:900–9. doi: 10.1118/1.596606. [DOI] [PubMed] [Google Scholar]
- Hayward J, Wehe D. Incomplete charge collection in an HPGe double-sided strip detector. Nuclear Instruments and Methods in Physics Research Section A: Accelerators, Spectrometers, Detectors and Associated Equipment. 2008a;586:215–23. [Google Scholar]
- Hayward JP, Wehe DK. Charge Loss Correction in a High-Purity Germanium Double-Sided Strip Detector. IEEE Transactions on Nuclear Science. 2008b;55:2789–97. [Google Scholar]
- Hayward JP, Wehe DK. Inter-Strip Interpolation Measurements in a High-Purity Germanium Double-Sided Strip Detector. IEEE Transactions on Nuclear Science. 2009;56:800–7. [Google Scholar]
- Hutton BF, Buvat I, Beekman FJ. Review and current status of SPECT scatter correction. Physics in medicine and biology. 2011;56:R85. doi: 10.1088/0031-9155/56/14/R01. [DOI] [PubMed] [Google Scholar]
- Hwang AB, Franc BL, Gullberg GT, Hasegawa BH. Assessment of the sources of error affecting the quantitative accuracy of SPECT imaging in small animals. Physics in medicine and biology. 2008;53:2233–52. doi: 10.1088/0031-9155/53/9/002. [DOI] [PMC free article] [PubMed] [Google Scholar]
- Kuikka JT, Tenhunen-Eskelinen M, Jurvelin J, Kiiliänen H. Physical performance of the Siemens MultiSPECT 3 gamma camera. Nuclear medicine communications. 1993;14:490–7. doi: 10.1097/00006231-199306000-00013. [DOI] [PubMed] [Google Scholar]
- Luke PN, Amman M, Phlips BF, Johnson WN, Kroeger RA. Germanium orthogonal strip detectors with amorphous-semiconductor contacts. Nuclear Science, IEEE Transactions on. 2000;47:1360–3. [Google Scholar]
- Luke PN, Cork CP, Madden NW, Rossington CS, Wesela MF. Amorphous Ge bipolar blocking contacts on Ge detectors. Nuclear Science, IEEE Transactions on. 1992;39:590–4. [Google Scholar]
- McCready VR, Parker RP, Gunnersen EM, Ellis R, Moss E, Gore WG, Bell J. Clinical tests on a prototype semiconductor gamma-camera. Br J Radiol. 1971;44:58–62. doi: 10.1259/0007-1285-44-517-58. [DOI] [PubMed] [Google Scholar]
- Mueller B, O'Connor MK, Blevis I, Rhodes DJ, Smith R, Collins DA, Phillips SW. Evaluation of a Small Cadmium Zinc Telluride Detector for Scintimammography. J Nucl Med. 2003;44:602–9. [PubMed] [Google Scholar]
- NEMA . Performance Measurements of Gamma Cameras. NEMA; Rosslyn VA: 2007. [Google Scholar]
- Ogawa K, Ohmura N, Iida H, Nakamura K, Nakahara T, Kubo A. Development of an ultra-high resolution SPECT system with a CdTe semiconductor detector. Annals of nuclear medicine. 2009;23:763–70. doi: 10.1007/s12149-009-0293-x. [DOI] [PubMed] [Google Scholar]
- Phlips BF, Johnson WN, Kroeger RA, Kurfess JD, Phillips G, Wulf EA, Luke PN. Development of germanium strip detectors for environmental remediation. Nuclear Science, IEEE Transactions on. 2002;49:597–600. [Google Scholar]
- Rusinek H, Reich T, Youdin M, Clagnaz M, Kolwicz R. An Ultrapure Germanium Detector Array for Quantitating Three-Dimensional Distribution of a Radionuclide: A Study of Phantoms. J Nucl Med. 1980;21:777–82. [PubMed] [Google Scholar]
- Vanhove C, Defrise M, Bossuyt A, Lahoutte T. Improved quantification in single-pinhole and multiple-pinhole SPECT using micro-CT information. Eur J Nucl Med Mol Imaging. 2009;36:1049–63. doi: 10.1007/s00259-009-1062-8. [DOI] [PubMed] [Google Scholar]
- Vetter K, Burks M, Mihailescu L. Gamma-ray imaging with position-sensitive HPGe detectors. Nuclear Instruments and Methods in Physics Research Section A: Accelerators, Spectrometers, Detectors and Associated Equipment. 2004;525:322–7. [Google Scholar]
- Wulf EA, Ampe J, Johnson WN, Kroeger RA, Kurfess JD, Phlips BE. Depth measurement in a germanium strip detector. Nuclear Science, IEEE Transactions on. 2002;49:1876–80. [Google Scholar]
- Wulf EA, Phlips BF, Johnson WN, Kroeger RA, Kurfess JD, Novikova EI. Germanium strip detector Compton telescope using three-dimensional readout. Nuclear Science, IEEE Transactions on. 2003;50:1182–9. [Google Scholar]
- Wunderer CB, Boggs SE, Kurfess J, Ryan JM, Aprile E, Gehrels N, Kippen RM, Leising M, Oberlack U, Zych A, Baring M, Beacom J, Bildsten L, Bloser OF, Dermer C, Harris M, Hartmann DH, Hernanz M, Hoover A, Klimenko A, Kocevski D, McConnell ML, Milne P, Novikova EI, Phlips B, Polsen M, Smith DM, Starrfield S, Sturner S, Tournear D, Weidenspointner G, Wulf E, Zoglauer A. The Advanced Compton Telescope Mission. In: Grebenev RSS, Winkler C, editors. The Obscured Universe. Proceedings of the VI INTEGRAL Workshop. ESA Publication Division; Moscow, Russian Federation: 2006. p. 649. [Google Scholar]