Abstract
Gliomas contain a small number of treatment-resistant glioma stem cells (GSCs), and it is thought that tumor regrowth originates from GSCs, thus rendering GSCs an attractive target for novel treatment approaches. Cancer cells rely more on glycolysis than on oxidative phosphorylation for glucose metabolism, a phenomenon used in 2-[18F]fluoro-2-deoxy-d-glucose positron emission tomography imaging of solid cancers, and targeting metabolic pathways in cancer cells has become a topic of considerable interest. However, if GSCs are indeed important for tumor control, knowledge of the metabolic state of GSCs is needed. We hypothesized that the metabolism of GSCs differs from that of their progeny. Using a unique imaging system for GSCs, we assessed the oxygen consumption rate, extracellular acidification rate, intracellular ATP levels, glucose uptake, lactate production, PKM1 and PKM2 expression, radiation sensitivity, and cell cycle duration of GSCs and their progeny in a panel of glioma cell lines. We found GSCs and progenitor cells to be less glycolytic than differentiated glioma cells. GSCs consumed less glucose and produced less lactate while maintaining higher ATP levels than their differentiated progeny. Compared with differentiated cells, GSCs were radioresistant, and this correlated with a higher mitochondrial reserve capacity. Glioma cells expressed both isoforms of pyruvate kinase, and inhibition of either glycolysis or oxidative phosphorylation had minimal effect on energy production in GSCs and progenitor cells. We conclude that GSCs rely mainly on oxidative phosphorylation. However, if challenged, they can use additional metabolic pathways. Therefore, targeting glycolysis in glioma may spare GSCs.
Experimental and clinical evidence support the hypothesis that gliomas contain a small number of cancer stem cells (CSCs), which are defined by their ability to self-renew and to give rise to all lineages of progeny found in glioma (1). Progeny derived from CSCs are believed to lack these features (2). Furthermore, we and others have recently reported that CSCs are relatively radioresistant (3–5). Therefore, specific targeting of CSCs seems to be an attractive novel treatment approach against cancer.
In glioma, CSCs can be prospectively identified on the basis of their intrinsically low proteasome activity, and we have recently described an imaging approach to track glioma CSCs in vitro and in vivo (6).
First described by Warburg et al. (7), most cancer cells rely more on glycolysis rather than on oxidative phosphorylation for glucose metabolism, a fact that is used in 2-[18F]fluoro-2-deoxy-d-glucose positron emission tomography (18FDG-PET) imaging of solid cancers. In glioma, high glucose uptake in the normal brain impairs the application of 18FDG-PET to detect metabolically active tumor cells; however, targeting glycolysis in glioma cells with therapeutic intent has become a topic of considerable interest (8). To design novel therapeutic approaches that target metabolic pathways of CSCs, profound knowledge of the metabolic state of CSCs is needed.
We hypothesized that the metabolic state of glioma CSCs differs from that of the bulk tumor cell population. To address this hypothesis we studied ATP and glucose metabolism in a panel of established and patient-derived glioma cell lines.
Results
Oxygen Consumption Rate and Extracellular Acidification Rate of Glioma Stem Cells.
Recent experimental and clinical data support the hypothesis that many solid tumors, including brain tumors (9), are organized hierarchically and contain a small number of CSCs. We previously reported that glioma stem cells (GSCs) have lower 26S proteasome activity than nontumorigenic cells, and we have used this feature to monitor GSCs in real time via the fluorescent protein ZsGreen fused to the C-terminal degron of murine ornithine decarboxylase (cODC). This fusion protein is rapidly degraded by the 26S proteasome in a ubiquitin-independent fashion but accumulates in cells with low proteasome activity (6). Neurosphere cultures of gliomas are enriched in GSCs with low proteasome activity, whereas differentiated progeny, with high proteasome activity, die under these conditions by anoikis. Combined with the two different culture conditions, our imaging system allows for comparison of differentiated progeny in monolayer cultures (high proteasome activity, ZsGreen-cODC-negative), where GSCs are very rare, with differentiating progenitor cells (high proteasome activity, ZsGreen-cODC-negative) and GSCs (low proteasome activity, ZsGreen-cODC-positive) in neurospheres (Table S1).
It has long been known that most cancer cells perform aerobic glycolysis. This phenomenon was discovered by Otto Warburg in 1924, when he described that cancer cells metabolize glucose to lactate even under normoxic conditions (7). Although the Warburg effect is thought to be a near-universal phenomenon in cancer cells, it has not been specifically described for CSCs. Therefore, we decided to investigate whether the metabolic state of GSCs differs from the bulk of the tumor cells. To study the metabolic state of GSCs in detail we made use of our recently developed imaging system for CSCs and tested monolayer and 3D neurosphere cultures derived from a panel of glioma cell lines.
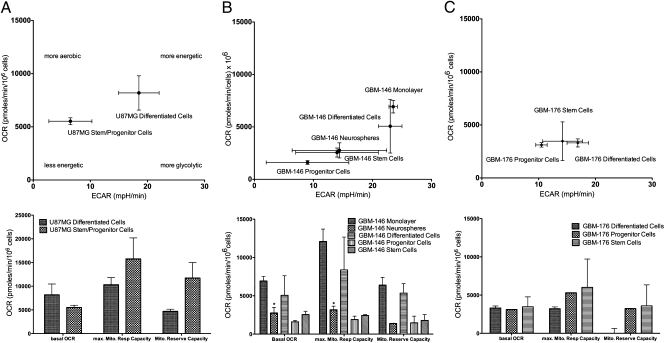
To take a closer look at the metabolic state of GSCs and to compare it with the nontumorigenic cell population, we allowed differentiated cells from monolayers or progenitor and stem cells from neurospheres to attach on laminin-coated wells overnight. This method has been shown to preserve the nondifferentiated state of GSCs (10). When basal oxygen consumption rates (OCR) and extracellular acidification rates (ECAR) of differentiated cells and stem/progenitor cells were compared in U87MG and GBM-146 cells, stem/progenitor cells were consistently in a less glycolytic state than differentiated cells [Fig. 1 A and B; OCR: monolayer vs. neurospheres, GBM-146: P < 0.05; U87MG: nonsignificant (n.s.), Student t test]. Basal ECARs were lower in stem/progenitor cells in both cell lines (ECAR: GBM-146: n.s.; U87MG: P < 0.05, Student t test). Stem/progenitor cells in U87MG and GBM-176 showed higher maximal respiratory mitochondrial capacity (n.s., Student t test) and higher mitochondrial reserve capacity (U87MG: P < 0.05; GBM-176: n.s., Student t test) than differentiated cells, indicating that stem/progenitor cells derived from neurospheres exhibit higher resistance against oxidative stress (Fig. 1 A and C). However, GBM-146 stem/progenitor cells showed lower maximal respiratory mitochondrial capacity (P < 0.05, Student t test) and lower mitochondrial reserve capacity (n.s., Student t test) than cells from corresponding differentiated cells (Fig. 1B).
Fig. 1.
Real-time measurements of OCR and ECAR. OCR and ECAR measurements for U87MG (A), GBM-146 (B), and GBM-176 (C) glioma cells. GSCs and progenitor cells were less glycolytic than differentiated cells (Left). GSCs in U87MG and GBM-176 had higher maximum mitochondrial respiratory capacities and mitochondrial reserve capacities than differentiated cells, indicating protection against oxidative stress. In GBM-146 cells this relationship was reversed, with higher maximum mitochondrial respiratory capacities and mitochondrial reserve capacities found in differentiated cells.
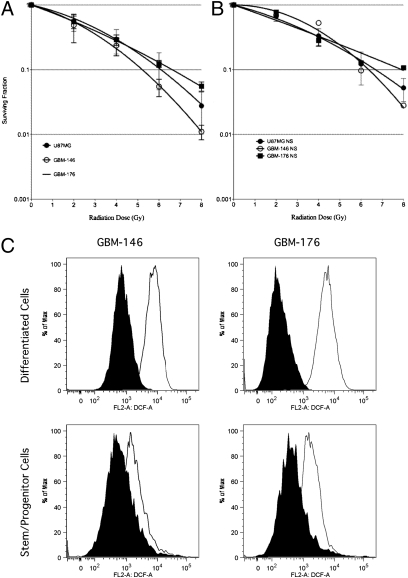
The mitochondrial reserve capacity is thought to correlate to the cells’ ability to cope with oxidative stress (11). Because ionizing radiation deploys its cytotoxic effects mainly through the generation of free radicals, we decided to explore the radiation sensitivity of these cells using standard clonogenic assays. This assay measures the ability of single cells to form colonies of more than 50 cells, equivalent to six cell divisions. Thus, it measures the survival of GSCs as well as progenitor cells with limited proliferative potential. Consistent with decreased mitochondrial reserve capacity in GBM-146 GSCs and progenitor cells, GBM-146 cells were found to be far less radioresistant than GBM-176 and U87MG cells (Fig. 2A). This correlation was confirmed when radiation sensitivity of GSCs was assayed, even though GSCs in general were confirmed to be more radiation resistant, consistent with a previous report (3) (Fig. 2B).
Fig. 2.
Radiation sensitivity of GSCs and differentiated glioma cells. Clonogenic survival (A), sphere-forming capacity (B), and intracellular free radical levels (C) of glioma cells. Glioma cells showed a spectrum of intrinsic radiation sensitivities, and GSCs (B) exhibited increased radiation resistance over differentiated glioma cells (A). Basal (filled histograms) and H2O2-induced (open histograms) free radical levels in the stem/progenitor cell populations were consistently lower than in differentiated cells (C).
Exposure of differentiated cells and stem/progenitor cells from GBM-176 and GBM-146 to H2O2 showed that basal and H2O2-induced free radical levels were lower in GBM-176 compared with GBM-146 and that basal and H2O2-induced free radical levels in differentiated cells exceeded those in stem cell/progenitor populations (Fig. 2C).
To investigate the metabolic state of the different subpopulations in more detail, we sorted GBM-146 and GBM-176 cells into differentiated cells (ZsGreen-cODC-negative from monolayer cultures), progenitor cells (ZsGreen-cODC-negative cells from neurospheres), and GSCs (ZsGreen-cODC-high cells from neurospheres) and repeated the assessment of OCR and ECAR. These experiments confirmed the observations gained when unsorted differentiated cells from monolayers and stem/progenitor cells from sphere cultures were used, with insignificant differences between progenitor cells and GSCs (Fig. 1 B and C, Student t test).
ATP Levels, Glucose Uptake, and Lactate Production in GSCs.
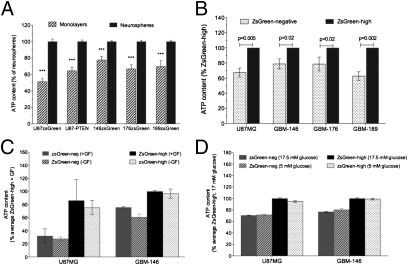
Next we studied whether the energetic state of the different cell populations was reflected in differences in ATP content. Differentiated cells derived from monolayers had lower ATP content than stem/progenitor cells from neurospheres, supporting the idea that GSCs and progenitor cells depend on oxidative phosphorylation and that this dependence is lost at some point during differentiation and accompanied with a switch to aerobic glycolysis in differentiated cells (Fig. 3A) (12).
Fig. 3.
ATP content of glioma cells. The ATP content of glioma cell populations derived from neurospheres enriched for GSCs was compared with the ATP content of differentiated glioma cells. (A) Stem/progenitor cells derived from neurospheres had significantly higher intracellular ATP levels (Student t test, P < 0.05) than differentiated cells, regardless of their PTEN status. Within neurospheres, ATP levels in GSCs significantly exceeded ATP levels in progenitor cells (B), and this was not dependent on the presence of EGF and bFGF (C) or high glucose levels in the media (D).
To determine at which point during differentiation this metabolic switch occurs, we decided to compare the intracellular levels of ATP in sorted progenitor cells and GSCs, both derived from neurospheres. GSCs from GBM-146, U87MG, and from two additional GBM lines, GBM-176 and GBM-189, had significantly higher ATP content than their corresponding progenitor cells (Fig. 3B, Student t test, P < 0.05). Reexpression of Phosphatase and tensin homolog (PTEN) in U87MG did not change this phenotype (Fig. 3A), suggesting that the PTEN status does not play a role in the differences observed between the ATP levels of GSCs and progenitor cells in U87MG. To test whether this difference depended on differential responses to EGF and basic FGF (bFGF) in the media used to grow the neurospheres, measurements were repeated in the presence or absence of both growth factors for GSCs and progenitor cells sorted from GBM-146 and U87MG. The relative ATP content in the two populations was not affected by the presence or absence of growth factors (Fig. 3C).
The standard media used to grow the neurospheres contained glucose at a concentration of 17.5 mM. To exclude nonphysiological glucose concentrations as a cause for the observed differences in ATP content, we decided to repeat the experiment at physiological glucose levels. For this purpose, the two populations were sorted into media containing 5 mM glucose and allowed to adjust overnight to the new glucose levels. The next day ATP levels were measured. Again, GSCs had higher ATP levels than progenitor cells (Fig. 3D), excluding nonphysiologically high concentrations of glucose as the cause for the observed differences in ATP content.
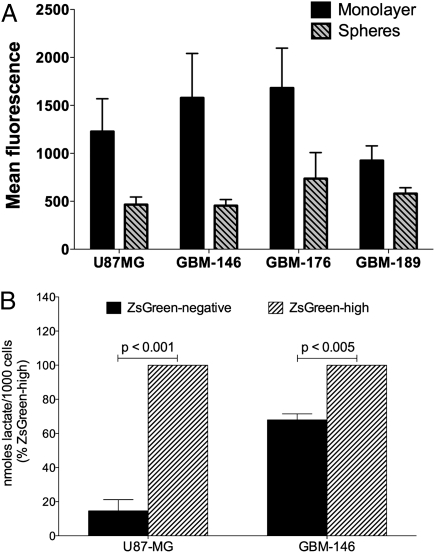
When the glucose uptake of differentiated cells and stem/progenitor cells were compared using the fluorescent 2-deoxyglucose (2-DG) analog 2-[N-(7-nitrobenz-2-oxa-1,3-diaxol-4-yl)amino]-2-deoxyglucose (2-NBDG), we further confirmed the hypothesis that progenitor cells are less glycolytic than differentiated cells. Differentiated cells had 2-NBDG uptake rates that exceeded those of stem/progenitor cells by twofold (Fig. 4A, P < 0.05, Student t test).
Fig. 4.
Glucose uptake and lactate production. (A) Flow cytometric analysis of the glucose uptake into differentiated glioma cells and neurospheres enriched for GSCs using the glucose analog 2-NBDG. Glucose uptake of differentiated cell populations significantly exceeded the uptake by cells derived from neurosphere cultures (*P < 0.05, Student t test). (B) Analysis of lactate production in progenitor cells and GSCs derived from neurospheres. GSCs had significantly higher lactate production than progenitor cells (P < 0.05, Student t test).
Our ECAR measurements showed differences in the ECAR between GCSs and progenitor cells (Fig. 1 A–C, Left). Consistent with these findings, GSCs produced significantly more lactate than progenitor cells (Fig. 4B). This again indicated that the metabolic state of GSCs may differ from the progenitor and differentiated cells and that the metabolic switch to glycolysis is performed late in the differentiation process (P < 0.05, Student t test).
Effect of Metabolic Inhibitors on ATP Levels.
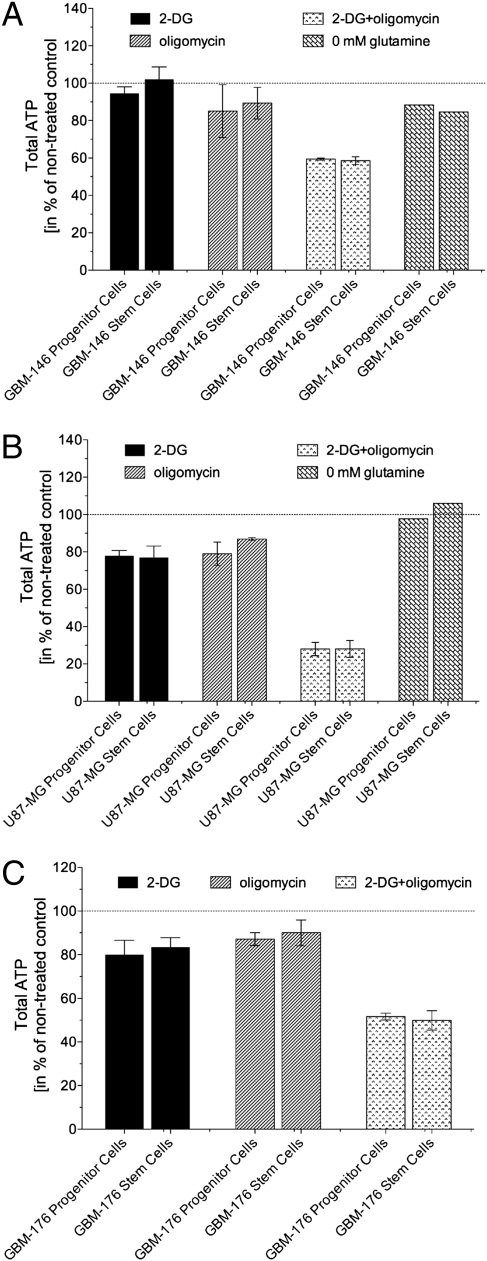
To determine whether the differences in ATP levels between GCSs and progenitor cells were due to the cells relying on one metabolic pathway vs. another, we decided to treat both populations with different metabolic inhibitors and reanalyze the ATP levels after 3 h of drug treatment. 2-Deoxyglucose was used as a specific glycolysis inhibitor, and oligomycin was used to inhibit the production of ATP via the mitochondrial ATP synthase. After application of the drugs, ATP levels in progenitor cells and GSC populations were affected in a similar manner by both inhibitors. Inhibition of either glycolysis or oxidative phosphorylation had only marginal effects on the overall ATP content, whereas the combined effect of both inhibitors was at least additive (Fig. 5 A–C). Even though the combined inhibition of glycolysis and oxidative phosphorylation for 3 h did not completely deplete cells from ATP, it caused a substantial reduction of total ATP (40–70%). These data suggested that ATP in both subpopulations was mainly produced by glycolysis and oxidative phosphorylation and that inhibition of glycolysis could be compensated through increased oxidative phosphorylation, and vice versa. The lactate produced by cancer cells is not always derived from the conversion of glucose during glycolysis. A portion can also be produced by the degradation of the amino acid glutamine to lactate during glutaminolysis (13). To assess the contribution of glutaminolysis to the ATP content of these cell populations, we measured the ATP levels in the two populations plated in 4 mM glutamine or glutamine-free media. However, absence of glutamine in the media had only little effect on the total ATP content, indicating that glutaminolysis contributes only to a lesser extent to the energy production in GSCs and progenitor cells, or at least that glutaminolysis is not an essential pathway for energy production in these cell populations (Fig. 5 A and B).
Fig. 5.
Effect of metabolic inhibitors on ATP content. GBM-146 (A), U87MG (B), and GBM-176 (C) cells were treated for 3 h with 2-DG, an inhibitor of glycolysis, oligomycin, an inhibitor of ATP-synthase, or a combination of 2-DG and oligomycin. ATP levels were also analyzed after the cells were kept in glutamine-free media for 3 h. Single drug treatment or glutamine-free media had only marginal effects on ATP content in GSCs and progenitor cells. Only the combined treatment of both cell populations with 2-DG and oligomycin caused a substantial drop in ATP levels. ATP content was normalized to untreated cells.
Pyruvate Kinase Isoenzyme Expression in GSCs.
Proliferating cells and cancer cells preferentially express the M2 isoform of pyruvate kinase (PK-M2) over the PK-M1 isoform at the protein level (14, 15). The Warburg effect has been described for many different tumor types, and Christofk et al. (15) recently attributed the dependence of cancer cells on glycolysis to the exclusive expression of the M2 isoform of pyruvate kinase. The GBM-146, GBM-176, and U87MG glioblastoma cells expressed both PK-M1 and PK-M2 isoforms, indicating that GBM cells could perform glycolysis and oxidative phosphorylation in parallel. However, PK-M1 or PK-M2 protein expression levels did not differ between progenitor cells and GSCs (Fig. S1).
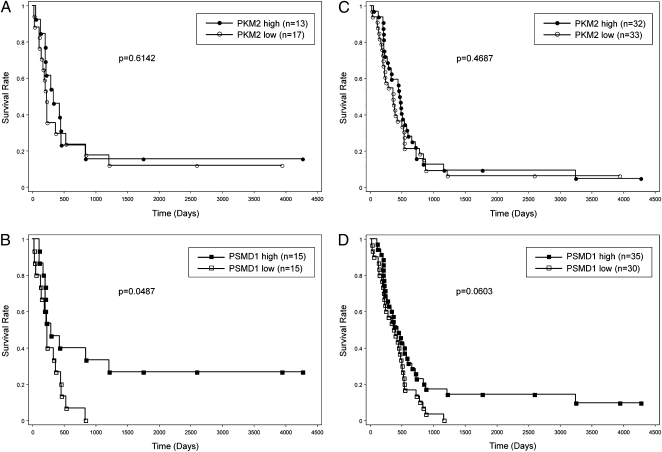
When we assessed the expression of PK-M2 in a tissue microarray of 65 glioblastoma patients by immunohistochemistry, the expression levels of PK-M2 were not correlated with overall survival (Fig. 6 A and C, log–rank test). However, in patients with nonrelapsed primary and secondary glioblastomas, low expression levels of the 26S proteasome subunit PSMD1, indicating the presence of high numbers of GSCs, were correlated with significantly reduced overall survival (Fig. 6B, P = 0.0487, log–rank test). This trend was also seen when recurrent tumors were included (Fig. 6D, P = 0.0603, log–rank test).
Fig. 6.
Expression of PK-M2 and the 26S proteasome subunit PSMD1 in glioblastoma patient samples. Immunohistochemical analysis of PK-M2 and PSMD1 expression in a microtissue array of 65 glioblastoma samples. (A) PKM2 expression did not correlate with overall survival in 30 primary and secondary glioblastoma or (C) when recurrent tumors were included in the analysis. (B) Low PSMD1 expression was correlated with reduced overall survival in primary and secondary glioblastoma (P = 0.0487, log–rank test). (D) This trend was also seen when recurrent tumors were included (P = 0.0603, log–rank test).
Discussion
Our recently acquired ability to prospectively identify CSCs in various solid tumors (9, 16, 17) has stimulated a hunt for novel therapies that target CSCs directly and to overcome their resistance to established cancer therapies.
To our best knowledge, the metabolic state of CSCs has not been investigated to date, even though there is considerable interest in targeting metabolic pathways in cancer cells. Assessing OCR and ECAR values for three different GBM lines, we found that cells from neurospheres, known to be enriched for GSCs, were in general less glycolytic than differentiated cells from monolayers in which GSCs are very rare. Furthermore, the mitochondrial reserve capacity, a measure of the ability of cells to resist oxidative stress (11), differed between the different lines and correlated well with the intrinsic radiation resistance of GSCs. Fundamental differences between the metabolic states of differentiated cells, progenitor cells, and GSCs were further supported by higher total ATP levels in GSCs. The glioma samples tested expressed both PK-M1 and PK-M2 forms of pyruvate kinase. This was in agreement with a recent report that gliomas are one of the few cancers that express both of these isoforms, even though they preferentially express the PK-M2 isoform (18), the driving force of glycolysis, and our observation that expression levels of PK-M2 were not correlated to overall survival. Consistently, progenitor cells and GSCs from all GBM lines tested tolerated inhibition of glycolysis or oxidative phosphorylation very well, and only the combined inhibition of both pathways led to a substantial depletion of intracellular ATP. We did not test whether normal tissue cells in the brain resist inhibition of oxidative phosphorylation to the same or even higher extent than GSCs. However, the lack of PK-M1 expression in neuronal stem cells (Fig. S1) indicates that normal tissues may be less flexible in using multiple different metabolic pathways for energy production, and thus suggests the lack of a therapeutic window for combined inhibition of glycolysis and oxidative phosphorylation in glioma patients.
In conclusion, the metabolic state of GSCs seems to differ substantially from the metabolic state of differentiated glioma cells, and it correlates with resistance to ionizing radiation. The ability of GSCs to use multiple pathways to produce energy renders them resistant to therapies that target individual metabolic pathways, suggesting that targeting specific metabolic pathways in glioblastoma may spare GSCs.
Materials and Methods
Cell Lines and GBM Samples.
Glioma cell lines, U87, and U87-PTEN were a kind gift from Dr. Paul Mischel [Department of Pathology, University of California, Los Angeles (UCLA)]. The glioma samples GBM-146, GBM-176, and GBM-189 were a kind gift from Dr. Harley Kornblum (Department of Molecular and Medical Pharmacology, UCLA). All cells were cultured as adherent monolayers or as neurospheres in suspension. Monolayers were grown in DMEM-F12 (Invitrogen) supplemented with 10% heat-inactivated FBS (Sigma), penicillin (100 U/mL), and streptomycin (100 μg/mL mixture) and were grown at 37 °C in a humidified atmosphere (5% CO2). Neurospheres were grown in serum-free DMEM-F12 supplemented with 0.4% BSA (Sigma), 10 mL/500 mL B27 (Invitrogen), 5 μg/mL bovine insulin (Sigma), 4 μg/mL heparin (Sigma), 20 ng/mL FGF 2 (bFGF, Sigma), and 20 ng/mL EGF (Sigma). Stable lines expressing the ZsGreen-cODC reporter protein, which reports for proteasome activity in a live cell, were also generated from each cell line via infection with a ZsGreen-cODC retroviral vector as described previously (6).
Clonogenic Survival Assay and Sphere-Forming Assays.
For clonogenic survival assays, cells were irradiated as single-cell suspensions using an experimental 200-kV X-ray irradiator (Gulmay Medical). After irradiation an appropriate number of cells was plated into 10-cm Petri dishes into DMEM media, supplemented with 10% FBS. After 14 d, cells were fixed with methanol, stained with crystal violet, and colonies consisting of more than 50 cells were counted. To assess sphere formation, cells were irradiated as single-cell suspensions and plated into ultralow-adhesion 96-well plates at clonogenic densities from 1 to 256 cells per well in DMEM/F12 (as described above). After 14 d, the number of neurospheres per well was counted. Curves were fitted using a linear-quadratic model (GraphPad Prism, version 5).
Reactive Oxygen Species Production Assay.
Cells were incubated in suspension with 20 μM 2′7′-dichlorofluorescein diacetate (DCF-DA) in PBS for 30 min while in the dark. DCF-DA was aspirated, and PBS was replaced with PBS containing 500 μM H2O2. Cells were incubated for an additional 5 min, resuspended in PBS, and analyzed by flow cytometry (MACSquant Analyzer, Miltenyi Biotec).
ATP Assays.
For comparison of ATP levels in monolayers vs. spheres and ZsGreen-cODC-negative vs. ZsGreen-cODC-high cells, the one-step ATPlite Assay (PerkinElmer) was used. Cells deriving from monolayers or neurospheres were plated in 96-well nontreated plates at a density of 5,000 cells per well, in 100 μL of media per well. For comparing ZsGreen-cODC-negative vs. ZsGreen-cODC-high cells, neurosphere cultures were digested with TrypLE Express (Invitrogen) and triturated into a single-cell suspension. The cells were then sorted onto 96-well nontreated plates, at 5,000 cells per well, in 100 μL of serum-free media using fluorescence-activated cell sorting. After 3 h, the ATP assay was conducted according to the manufacturer's protocol. The data from ATPlite assays are presented as an average of more than three independent experiments.
Glucose Uptake and Lactate Production Assays.
The fluorescent 2-DG analog 2-NBDG (Sigma) was used to measure glucose uptake. Cells were incubated with 2-NBDG (10 μM) for 1 h, washed twice, and analyzed by flow cytometry. For assessment of lactate production, the cells were sorted in a similar manner. After 24 h, media was collected and diluted 1:100 in lactate assay buffer. The amount of lactate present in the media was then estimated using the Lactate Assay Kit (BioVision Research Products) according to the manufacturer's instructions. The amount of lactate produced by the cells in each sample was calculated by subtracting the amount of lactate in the media (without cells) from the amount of lactate in the media from each sample.
Reagents.
The following reagents were used at the doses indicated and as described in the text and figure legends: oligomycin (Sigma), carbonylcyanide-p-trifluoromethoxyphenylhydrazone (FCCP, Sigma), rotenone (Sigma), myxothiazol (Sigma), 2-DG (Sigma), and 3-nitropropionic acid (3-NP, Sigma).
Oxygen Consumption and Extracellular Acidification Rate.
The oxygen consumption and ECARs of monolayers vs. neurospheres was determined using the Seahorse XF Extracellular Flux Analyzer (Seahorse Bioscience). The Extracellular Flux Analyzer allows for analyzing oxygen consumption and ECARs of a defined number of cells in a defined small volume of culture media in real time and for monitoring their response to drug treatment. An overview of the technique can be found in ref. 11. Twenty-four-well plates (Seahorse Bioscience) were coated with laminin (Sigma) as described previously to allow the single cells derived from neurosphere cultures to attach for this assay without differentiating (10). Briefly, each well of the 24-well plate was coated with 50 μL laminin diluted in PBS (10 μg/mL) overnight. The next day the wells were washed three times with PBS, and cells from monolayer or sphere cultures were plated at a density of 40,000 cells per well and allowed to attach overnight in either monolayer or neurosphere media. The following day the adherent cells were washed and fresh media was added. The cartridge was loaded to dispense three metabolic inhibitors sequentially as specific time points: oligomycin (inhibititor of ATP synthase, 1 μM), followed by FCCP (a protonophore and uncoupler of mitochondrial oxidative phosphorylation, 0.5 μM), followed by the addition of a combination of rotenone (mitochondrial complex I inhibitor, 100 nM) and myxothiazol (inhibitor of cytochrome C reductase, 100 nM). Basal OCR and ECAR were measured, as well as the changes in oxygen consumption caused by the addition of the metabolic inhibitors described above. Several parameters were deducted from the changes in oxygen consumption, such as basal OCR, maximum mitochondrial capacity, and mitochondrial reserve capacity (= [maximum mitochondrial capacity] − [basal OCR]) as described previously (19).
Tissue Microarrays and Immunohistochemical Staining.
Tissue microarrays and immunohistochemical staining were used to analyze PKM2 and PSMD1 expression in tissue, as previously described (20, 21). Tumor specimens were obtained according to a protocol approved by the institutional review board of UCLA. Briefly, tissue microarray enable tumor tissue samples from different patients to be analyzed on the same histologic slide. We constructed the array with a 0.6-mm needle to extract three representative tumor tissue cores from each formalin-fixed, paraffin-embedded tissue block of glioblastoma. These tissue microarrays have been used for other studies (22, 23). Tissue microarray slides were counterstained with hematoxylin to visualize nuclei. Expression analysis was performed by two individual pathologists who were unaware of the findings of the molecular analyses. Scores of 0 and 1 were considered “low expression,” and a score of 2 was considered “high expression.” A log–rank test was used for statistical analysis.
Supplementary Material
Acknowledgments
This work was supported by National Cancer Institute Grant RO1 CA137110 (to F.P.).
Footnotes
The authors declare no conflict of interest.
*This Direct Submission article had a prearranged editor.
This article contains supporting information online at www.pnas.org/lookup/suppl/doi:10.1073/pnas.1106704108/-/DCSupplemental.
References
- 1.Clarke MF, et al. Cancer stem cells—perspectives on current status and future directions: AACR Workshop on cancer stem cells. Cancer Res. 2006;66:9339–9344. doi: 10.1158/0008-5472.CAN-06-3126. [DOI] [PubMed] [Google Scholar]
- 2.Reya T, Morrison SJ, Clarke MF, Weissman IL. Stem cells, cancer, and cancer stem cells. Nature. 2001;414:105–111. doi: 10.1038/35102167. [DOI] [PubMed] [Google Scholar]
- 3.Bao S, et al. Glioma stem cells promote radioresistance by preferential activation of the DNA damage response. Nature. 2006;444:756–760. doi: 10.1038/nature05236. [DOI] [PubMed] [Google Scholar]
- 4.Phillips TM, McBride WH, Pajonk F. The response of CD24(-/low)/CD44+ breast cancer-initiating cells to radiation. J Natl Cancer Inst. 2006;98:1777–1785. doi: 10.1093/jnci/djj495. [DOI] [PubMed] [Google Scholar]
- 5.Woodward WA, et al. WNT/beta-catenin mediates radiation resistance of mouse mammary progenitor cells. Proc Natl Acad Sci USA. 2007;104:618–623. doi: 10.1073/pnas.0606599104. [DOI] [PMC free article] [PubMed] [Google Scholar]
- 6.Vlashi E, et al. In vivo imaging, tracking, and targeting of cancer stem cells. J Natl Cancer Inst. 2009;101:350–359. doi: 10.1093/jnci/djn509. [DOI] [PMC free article] [PubMed] [Google Scholar]
- 7.Warburg O, Posener K, Negelein E. Ueber den Stoffwechsel der Tumoren. Biochem Z. 1924;152:319–344. [Google Scholar]
- 8.Pistollato F, et al. Hypoxia and succinate antagonize 2-deoxyglucose effects on glioblastoma. Biochem Pharmacol. 2010;80:1517–1527. doi: 10.1016/j.bcp.2010.08.003. [DOI] [PubMed] [Google Scholar]
- 9.Singh SK, et al. Identification of human brain tumour initiating cells. Nature. 2004;432:396–401. doi: 10.1038/nature03128. [DOI] [PubMed] [Google Scholar]
- 10.Pollard SM, et al. Glioma stem cell lines expanded in adherent culture have tumor-specific phenotypes and are suitable for chemical and genetic screens. Cell Stem Cell. 2009;4:568–580. doi: 10.1016/j.stem.2009.03.014. [DOI] [PubMed] [Google Scholar]
- 11.Hill BG, Dranka BP, Zou L, Chatham JC, Darley-Usmar VM. Importance of the bioenergetic reserve capacity in response to cardiomyocyte stress induced by 4-hydroxynonenal. Biochem J. 2009;424:99–107. doi: 10.1042/BJ20090934. [DOI] [PMC free article] [PubMed] [Google Scholar]
- 12.Fang M, et al. The ER UDPase ENTPD5 promotes protein N-glycosylation, the Warburg effect, and proliferation in the PTEN pathway. Cell. 2010;143:711–724. doi: 10.1016/j.cell.2010.10.010. [DOI] [PubMed] [Google Scholar]
- 13.McKeehan WL. Glycolysis, glutaminolysis and cell proliferation. Cell Biol Int Rep. 1982;6:635–650. doi: 10.1016/0309-1651(82)90125-4. [DOI] [PubMed] [Google Scholar]
- 14.Mazurek S, Boschek CB, Hugo F, Eigenbrodt E. Pyruvate kinase type M2 and its role in tumor growth and spreading. Semin Cancer Biol. 2005;15:300–308. doi: 10.1016/j.semcancer.2005.04.009. [DOI] [PubMed] [Google Scholar]
- 15.Christofk HR, et al. The M2 splice isoform of pyruvate kinase is important for cancer metabolism and tumour growth. Nature. 2008;452:230–233. doi: 10.1038/nature06734. [DOI] [PubMed] [Google Scholar]
- 16.Al-Hajj M, Wicha MS, Benito-Hernandez A, Morrison SJ, Clarke MF. Prospective identification of tumorigenic breast cancer cells. Proc Natl Acad Sci USA. 2003;100:3983–3988. doi: 10.1073/pnas.0530291100. [DOI] [PMC free article] [PubMed] [Google Scholar]
- 17.Hemmati HD, et al. Cancerous stem cells can arise from pediatric brain tumors. Proc Natl Acad Sci USA. 2003;100:15178–15183. doi: 10.1073/pnas.2036535100. [DOI] [PMC free article] [PubMed] [Google Scholar]
- 18.Clower CV, et al. The alternative splicing repressors hnRNP A1/A2 and PTB influence pyruvate kinase isoform expression and cell metabolism. Proc Natl Acad Sci USA. 2010;107:1894–1899. doi: 10.1073/pnas.0914845107. [DOI] [PMC free article] [PubMed] [Google Scholar]
- 19.Amo T, Yadava N, Oh R, Nicholls DG, Brand MD. Experimental assessment of bioenergetic differences caused by the common European mitochondrial DNA haplogroups H and T. Gene. 2008;411:69–76. doi: 10.1016/j.gene.2008.01.007. [DOI] [PMC free article] [PubMed] [Google Scholar]
- 20.Mellinghoff IK, et al. Molecular determinants of the response of glioblastomas to EGFR kinase inhibitors. N Engl J Med. 2005;353:2012–2024. doi: 10.1056/NEJMoa051918. [DOI] [PubMed] [Google Scholar]
- 21.Guo D, et al. EGFR signaling through an Akt-SREBP-1-dependent, rapamycin-resistant pathway sensitizes glioblastomas to antilipogenic therapy. Sci Signal. 2009;2:ra82. doi: 10.1126/scisignal.2000446. [DOI] [PMC free article] [PubMed] [Google Scholar]
- 22.Choe G, et al. Analysis of the phosphatidylinositol 3′-kinase signaling pathway in glioblastoma patients in vivo. Cancer Res. 2003;63:2742–2746. [PubMed] [Google Scholar]
- 23.Lu KV, et al. Fyn and SRC are effectors of oncogenic epidermal growth factor receptor signaling in glioblastoma patients. Cancer Res. 2009;69:6889–6898. doi: 10.1158/0008-5472.CAN-09-0347. [DOI] [PMC free article] [PubMed] [Google Scholar]
Associated Data
This section collects any data citations, data availability statements, or supplementary materials included in this article.


