

Abstract
Purpose
Erlotinib prolongs survival in patients with advanced non–small-cell lung cancer (NSCLC). We report the results of a randomized, phase II study of erlotinib alone or intercalated with chemotherapy (CT + erlotinib) in chemotherapy-naïve patients with advanced NSCLC who were positive for epidermal growth factor receptor (EGFR) protein expression and/or with high EGFR gene copy number.
Patients and Methods
A total of 143 patients were randomly assigned to either erlotinib 150 mg daily orally until disease progression (PD) occurred or to chemotherapy with paclitaxel 200 mg/m2 intravenously (IV) and carboplatin dosed by creatinine clearance (AUC 6) IV on day 1 intercalated with erlotinib 150 mg orally on days 2 through 15 every 3 weeks for four cycles followed by erlotinib 150 mg orally until PD occurred (CT + erlotinib). The primary end point was 6-month progression-free survival (PFS); secondary end points included response rate, PFS, and survival. EGFR, KRAS mutation, EGFR fluorescent in situ hybridization and immunohistochemistry, and E-cadherin and vimentin protein levels were also assessed.
Results
Six-month PFS rates were 26% and 31% for the two arms (CT + erlotinib and erlotinib alone, respectively). Both were less than the historical control of 45% (P = .001 and P = .011, respectively). Median PFS times were 4.57 and 2.69 months, respectively. Patients with tumors harboring EGFR activating mutations fared better on erlotinib alone (median PFS, 18.2 months v 4.9 months for CT + erlotinib).
Conclusion
The feasibility of a multicenter biomarker-driven study was demonstrated, but neither treatment arms exceeded historical controls. This study does not support combined chemotherapy and erlotinib in first-line treatment of EGFR-selected advanced NSCLC, and the patients with tumors harboring EGFR mutations had a better outcome on erlotinib alone.
INTRODUCTION
Erlotinib, an epidermal growth factor receptor (EGFR) –directed tyrosine kinase inhibitor (TKI), prolongs progression-free survival (PFS) and overall survival (OS) in unselected patients with non–small-cell lung cancer (NSCLC) in the first-line, second/third-line and first-line maintenance therapies.1–3 Randomized studies of chemotherapy in combination with erlotinib demonstrated no advantage and possible antagonism among these therapies in an unselected population.4,5 Preclinical studies suggested that G1 cell cycle arrest induced by erlotinib could interfere with the G2/M cytotoxicity of taxanes and suggested that appropriate scheduling of erlotinib with taxanes produce additive or synergistic growth inhibition.6 We previously demonstrated that patients with advanced NSCLC who were negative for EGFR by both fluorescent in situ hybridization (FISH) and immunohistochemistry (IHC) had no benefit from gefitinib therapy in the second/third-line setting.7
These studies led to the current randomized, phase II study evaluating erlotinib versus chemotherapy intercalated with erlotinib in chemotherapy-naive patients with advanced NSCLC who were positive for EGFR protein expression and/or high EGFR gene copy number. This study was initiated before the results from the Iressa Pan-Asia Study (IPASS), which identified the significance of EGFR mutation testing before first-line therapy, was available.8 Other goals were to determine the feasibility of a prospective biomarker multicenter study and to select a treatment arm for a randomized, phase III trial.
PATIENTS AND METHODS
Study Design
This was an international, randomized, phase II study of erlotinib as single-agent treatment or of carboplatin/paclitaxel chemotherapy intercalated with erlotinib in newly diagnosed patient with NSCLC who had EGFR-positive tumors assessed by IHC or FISH. Thirty-seven centers in the United States and five in the United Kingdom participated. The primary end point was the percentage of patients alive and without tumor progression at 6 months (ie, 6-month PFS). Secondary end points included tumor response rate (RR), PFS, and OS as well as the exploration of the correlation between clinical outcome and biomarkers of interest. Key inclusion criteria were sufficient tumor tissue sample for EGFR testing; histologically or cytologically advanced (ie, stages IIIB or IV) NSCLC; radiologically measurable or evaluable disease; and adequate organ function. Patients who received any prior or concurrent anticancer therapy for advanced NSCLC and patients who had uncontrolled brain metastases were excluded.
Web-based, centralized random assignment was performed by IDDI (Brussels, Belgium) by using an adaptive random assignment method by Pocock and Simon.9 Patients were stratified by the number of positive tests for EGFR expression (by IHC, FISH: 1 or 2) smoking status (current, former, or never), ECOG performance status (0/1 or 2), and extent of disease (stage IIIB or IV).
The study was approved by each institution's institutional review board/ethics committee. Written informed consent was obtained from all patients for participation, including for tissue analyses and banking.
Treatment
Patients were randomly assigned (1:1) to receive erlotinib 150 mg daily orally until disease progression (PD) occurred or to receive chemotherapy (paclitaxel 200 mg/m2 intravenously [IV] and carboplatin dosed by creatinine clearance [AUC 6] according to local practice IV on day 1) alternating with erlotinib 150 mg orally on days 2 through 15 every 3 weeks for four cycles, followed by erlotinib 150 mg orally daily until PD occurred. Patients were evaluated every 6 weeks by chest x-ray or computed tomography (CT) scan for PD. After PD, patients were treated at physician's discretion (Fig 1). Ongoing patient follow-up was conducted every 3 months.
Fig 1.
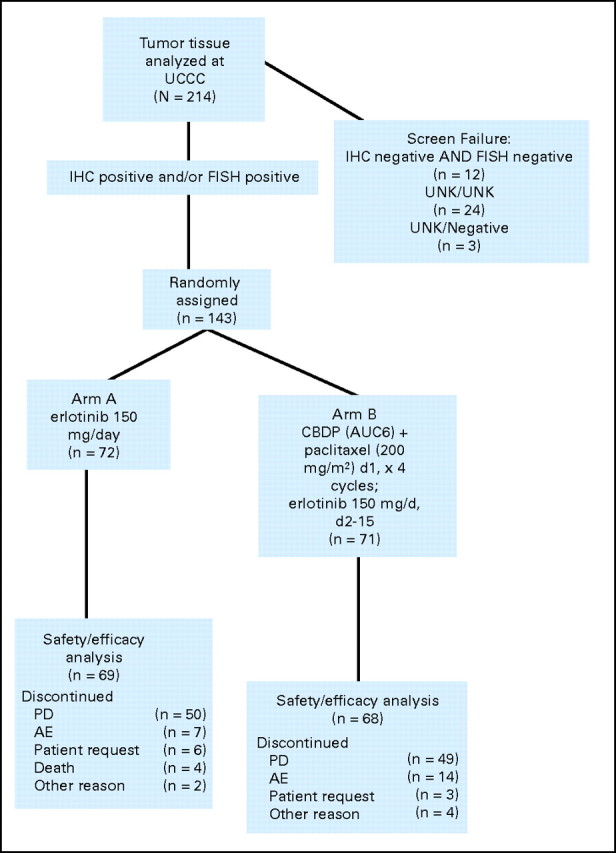
CONSORT diagram. AUC, area under the curve; AE, adverse event; CBDP, carboplatin; FISH, fluorescent in situ hybridization; IHC, immunohistochemistry; PD, progressive disease; UCCC, University of Colorado Cancer Center; UNK, unknown.
Biomarkers
The University of Colorado Cancer Center (UCCC, Aurora, CO) received tumor samples from sites to assess EGFR IHC and FISH. UCCC performed quality-control assessments before the analyses to ensure sufficient tumor tissue. With consent, the remnant tissue was used for EGFR mutation testing by Genzyme Genetics (Westborough, MA) and KRAS mutation analysis by OSI Pharmaceuticals (Boulder, CO). IHC was assessed for E-cadherin and vimentin by OSI Pharmaceuticals.
EGFR IHC
Protein expression for EGFR by IHC was assayed with the Dako (Carpentaria, CA) EGFR PharmDX kit. For the purpose of eligibility, positive EGFR IHC was defined by greater than 10% positive cells assessed by two independent reviewers.10 In cases of discrepancies, the final score was based on a consensus meeting.
EGFR FISH
FISH analysis was performed according to previously published methods.11,12 Samples identified with EGFR high polysomy (> four copies of the EGFR gene present in 40% to 100% cells) or with EGFR gene amplification (gene/chromosome ratio > two or ≥ 15 gene copies in ≥ 10% cells) were considered positive for copy number gain (FISH positive). All other samples were considered FISH negative. The FISH assessment was performed by two independent reviewers, and discrepant assessments were solved by consensus discussion.
EGFR Mutation
EGFR exons 18 through 21 were amplified by polymerase chain reaction (PCR) at Genzyme Genetics according to their standard procedure for EGFR mutational analysis. The resultant PCR fragments were sequenced by using BigDye version 1 and 3130 Genetic Analyzer (Applied Biosystems, Foster City, CA). EGFR activating mutations were noted by deletions on exon 19 or L858R mutations on exon 21. Patients with other mutations or deletions were classified wild type (WT) for analyses.
KRAS Mutation, E- Cadherin, and Vimentin
The DNA isolated for EGFR mutational analysis was used for KRAS mutational analysis in codons 12 and 13. The protein expression of E-cadherin was assessed by IHC with antibody H-108 (Santa Cruz Biotechnology No. 7870, Santa Cruz, CA). The assessment was considered high when at least 40% of the cells stained with intensity 2 or 3. The vimentin status was determined by IHC with antibody V9 (Dako No. M0725). The results were considered high when there was at least 10% staining of any intensity.
Statistical Analysis
This was a pick-the-winner, phase II design that was not adequately powered to test for treatment differences, as proposed by Simon et al13 Both treatment arms were considered experimental, and the treatment arm with the numerically superior PFS was to be considered for testing in future studies.
The sample size was based on the ability to detect, with a one-sided α of .05, an improvement in the 6-month PFS rate from an historical 45% with standard first-line platinum-based therapy to a hypothesized 60%, which would be a clinically meaningful improvement.4,5 PFS was defined as the time from random assignment until occurrence of documented radiologic and/or symptomatic PD according to RECIST (Response Evaluation Criteria in Solid Tumors), version 1.0, or until death in the absence of progression.14 Patients who did not experience progression were censored on the last day known to be free of progression by objective tumor measurements. Patients who received other therapy before documented PD were censored on the day subsequent therapy started. Survival was defined as time from random assignment until documented death. Patients who were still alive were censored on the last day known to be alive.
PFS and OS analyses included patients who received any study therapy. The 6-month PFS rates with 90% CIs were calculated for each treatment arm, and Kaplan-Meier estimates of PFS and OS were constructed for each treatment arm. In each arm, the 6-month PFS rate was compared with the historical control of 45%. Analyses of RR included patients who received any study therapy and had measurable disease.
Kaplan-Meier estimates of PFS were calculated for each biomarker level (positive v negative or mutation v WT) within each treatment arm. Log-rank analyses were performed to test for significant difference between biomarker levels. All P values presented are for exploratory purposes. RR and disease control rates (DCRs) were compared between the two groups with two-sided Fisher's exact tests. A P value ≤ .05 was considered statistically significant.
RESULTS
Patient Characteristics and Tumor Samples
Key patient characteristics and demographics were balanced between arms (Appendix Table A1, online only). Two-hundred forty patients with advanced NSCLC were screened, and formalin-fixed, paraffin-embedded biopsies were obtained in 214 patients (Fig 1). EGFR IHC and/or FISH results were obtained for 190 samples (89%); 24 (11%) failed the quality control analysis (eg, insufficient tissue for analysis) and were not evaluated. At least one of the two EGFR tests was positive in 175 samples (92%); 12 (6%) were negative for both assays; and three had combinations of negative and unknown results. Between March 2007 and December 2008, 143 patients were eligible and randomly assigned; 92% were positive by IHC, and 54% were positive by FISH (Table 1); 45% were positive by both IHC and FISH.
Table 1.
Biomarker Results On the Basis of Treatment Arm and Key Patient Characteristics
| Biomarker Result | % of Total Patients by Treatment Arm |
||
|---|---|---|---|
| Erlotinib (n = 72) | CP + Intercalated Erlotinib (n = 71) | Total(N = 143) | |
| IHC result | |||
| Positive | 93 | 92 | 92 |
| Negative | 4 | 8 | 6 |
| FISH result | |||
| Positive | 54 | 54 | 54 |
| Negative | 43 | 46 | 45 |
| EGFR mutation result | |||
| Mutation | 18 | 17 | 17 |
| Activating mutation | 12 | 10 | 11 |
| Exon 19 deletion | 11 | 4 | 8 |
| Exon 21 L858R mutation | 1 | 6 | 3 |
| Other mutation | 6 | 7 | 6 |
| No mutation | 67 | 65 | 66 |
| KRAS mutation result | |||
| Mutation | 18 | 23 | 20 |
| No mutation | 75 | 73 | 74 |
| E-cadherin | |||
| High | 36 | 30 | 33 |
| Low | 33 | 38 | 36 |
| Vimentin | |||
| High | 29 | 17 | 23 |
| Low | 40 | 48 | 44 |
Abbreviations: CP, carboplatin/paclitaxel; IHC, immunohistochemistry; FISH, fluorescent in situ hybridization.
Seventy-two patients were randomly assigned to erlotinib, and 71 patients were randomly assigned to chemotherapy plus erlotinib; 137 patients were included in the efficacy and safety analyses. Six patients did not receive study drug; three were in the erlotinib arm, and three were in the CT plus erlotinib arm.
The 214 tumor tissue samples consisted of primary lung lesions (n = 145 [67%][), metastatic sites (n = 55 [26%]), and tumor from an unknown location (n = 14 [7%]). Biomarker results are listed in Table 1. The average time from receipt of tissue at the central lab to biomarker results being provided to the treatment site was 4 working days (range, 1 to 9 days).
EGFR mutation results were obtained from 119 patients (83%), and activating EGFR mutations were found in 16 patients (11%; n = 11, exon-19 deletions; n = 5, exon-21 L858R). No difference in distribution between the treatment arms was seen. Two patients had concurrent L858R activating mutation and T790M-acquired resistance mutation. EGFR activating mutations were higher among women (16% v 6% in men), adenocarcinoma histology (15% v 0% in others), Asian ethnicity (38% v 8% in non-Asians), and never smokers (28% v 5% in former smokers and 4% in current smokers).
KRAS mutation analysis was performed in 135 patients, and 29 (20%) had mutations. No patient had both EGFR and KRAS mutation. KRAS mutation rates were highest in current smokers (40% v 22% in former and 8% in never smokers).
EGFR FISH was performed in 141 patients and was positive in 77 patients (54%). No difference in the distribution of EGFR FISH positivity was seen regarding sex, histology or smoking status. EGFR IHC was positive in 132 (92%) of 141 patients; no difference was associated with sex, histology or smoking status. E-cadherin expression was high in 47 (48%) of 98 patients, and vimentin was high in 33 (24%) of 96 patients.
The associations among EGFR mutation, KRAS mutations, and EGFR FISH are shown in Figure 2 for the 119 patients evaluable for FISH, EGFR mutation, and KRAS mutation. Of the 66 EGFR FISH-positive tumors, 10 had KRAS mutations. Among 16 tumors with EGFR activating mutations, 13 were EGFR FISH positive.
Fig 2.

Thirty-six patients were fluorescent in situ hybridization negative, KRAS wild type (WT), and EGFR WT.
Treatment Administration
Patients in the erlotinib arm received a median of 10.3 weeks of treatment (range, 1.1 to 125.7 weeks). Patients in the chemotherapy plus erlotinib arm received a median of 9.8 weeks (range, 0.1 to 95.6 weeks).
Efficacy
PFS.
Kaplan- Meiers curves of PFS are shown in Figure 3. For the overall population, the curves favored the chemotherapy plus erlotinib arm during the first 6 months and then crossed to favor the erlotinib arm. The 6-month PFS rate was 31% (90% CI, 22% to 40%) in the erlotinib arm, and it was 26% (90% CI, 17% to 36%) with chemotherapy plus erlotinib. The 6-month PFS rate in each arm was less than the historical control of 45% (erlotinib arm, P = .011; chemotherapy plus erlotinib arm, P = .001). The median PFS times were 2.69 months and 4.57 months within the two groups, respectively (Table 2). The 6-month PFS rate for patients with EGFR activation mutations was considerably better in the erlotinib arm than in the chemotherapy plus erlotinib arm (89% v 42%, respectively), as was the median PFS (18.2 months v 4.9 months, respectively).
Fig 3.

Kaplan-Meier plots of progression-free survival. (A) All patients; (B) EGFR wild-type patients; (C) EGFR mutant patients. CP, carboplatin/paclitaxel.
Table 2.
Analyses of PFS and OS for Biomarker Subsets
| Biomarker Subset | All Patients |
EGFR WT Only |
||
|---|---|---|---|---|
| Erlotinib | CP + Erlotinib | Erlotinib | CP + Erlotinib | |
| EGFR FISH positive | ||||
| No. | 37 | 35 | 23 | 27 |
| Median PFS | 2.76 | 5.06 | 2.10 | 5.29 |
| 6-month PFS rate | 39.2 | 23.4 | 27.6 | 21.7 |
| 12-month OS rate | 62.2 | 54.7 | 57.3 | 60.1 |
| EGFR FISH negative | ||||
| No. | 30 | 33 | 26 | 23 |
| Median PFS | 2.27 | 4.17 | 1.91 | 4.24 |
| 6-month PFS rate | 22.2 | 29.8 | 22.0 | 38.1 |
| 12-month OS rate | 58.3 | 38.4 | 55.5 | 49.5 |
| P for PFS of positive v negative* | .075 | .778 | .492 | .652 |
| KRAS mutation | ||||
| No. | 13 | 15 | 11 | 12 |
| Median PFS | 2.23 | 2.96 | 2.23 | 2.30 |
| 6-month PFS rate | 11.5 | 8.6 | NC | 11.4 |
| 12-month OS rate | 40.4 | 53.3 | 47.7 | 58.3 |
| KRAS WT | ||||
| No. | 51 | 51 | 38 | 38 |
| Median PFS | 3.15 | 4.90 | 1.97 | 5.36 |
| 6-month PFS rate | 38.2 | 31.7 | 27.3 | 33.9 |
| 12-month OS rate | 63.1 | 44.3 | 57.9 | 53.5 |
| P for PFS of mutated v WT* | .078 | .078 | .550 | .092 |
| E-cadherin positive: high | ||||
| No. | 25 | 21 | 19 | 15 |
| Median PFS | 2.76 | 4.90 | 2.69 | 5.52 |
| 6-month PFS rate | 28.0 | 21.4 | 21.1 | 31.4 |
| 12-month OS rate | 58.8 | 53.1 | 55.9 | 65.2 |
| E-cadherin negative: low | ||||
| No. | 22 | 26 | 18 | 21 |
| Median PFS | 1.54 | 5.06 | 1.45 | 5.06 |
| 6-month PFS rate | 33.2 | 31.0 | 24.2 | 27.3 |
| 12-month OS rate | 75.6 | 31.4 | 69.6 | 34.4 |
| P for PFS of high v low* | .794 | .725 | .495 | .836 |
| Vimentin positive: high | ||||
| No. | 20 | 12 | 15 | 8 |
| Median PFS | 1.48 | 5.78 | 1.41 | 6.01 |
| 6-month PFS rate | 27.1 | 41.6 | 7.5 | 53.6 |
| 12-month OS rate | 58.2 | 50.3 | 50.3 | 75.0 |
| Vimentin negative: low | ||||
| No. | 28 | 33 | 22 | 27 |
| Median PFS | 2.50 | 4.90 | 2.27 | 5.29 |
| 6-month PFS rate | 27.5 | 22.0 | 26.0 | 23.1 |
| 12-month OS rate | 66.5 | 38.7 | 66.1 | 41.6 |
| P for PFS of high v low* | .757 | .163 | .287 | .058 |
Abbreviations: PFS, progression-free survival; OS, overall survival; WT, wild type; CP, carboplatin/paclitaxel; FISH, fluorescent in situ hybridization; NC, not calculated.
P values are from the log-rank test comparing the erlotinib and CP + erlotinib curves.
Within the erlotinib arm, patients with EGFR activating mutations had a 6-month PFS rate of 89% compared with 24% for the EGFR WT patients (P < .001). In the chemotherapy plus erlotinib arm, patients with EGFR mutations had a 6-month PFS rate of 42% compared with 28% for the EGFR WT patients (P = .502).
For the EGFR FISH-positive patients, the 6-month PFS rate was 39% in the erlotinib arm, and it was 23% in the chemotherapy plus erlotinib arm; the PFS rates were and 22% and 30%, respectively, for the FISH-negative group. In the erlotinib arm, among the EGFR WT patients, the 6-month PFS rate for the FISH-positive group was 27%, and it was 21% for the FISH-negative group (P = .520).
EGFR IHC did not confer any difference in the 6-month PFS rate (Table 2). KRAS mutation appeared to have a negative effect on 6-month PFS rate for patients in both arms, although the results were not statistically significant (Table 2). For E-cadherin or vimentin expression, no differential association was seen (Table 2).
Tumor Response
The overall response rate (RR; ie, CR + PR) was 11.6% in the erlotinib arm, and it was 22.4% in the chemotherapy plus erlotinib arm (Table 3). For patients with activating EGFR mutation, the RR was 67% in the erlotinib arm and it was 33% in the chemotherapy plus erlotinib arm. For EGFR WT patients, the RRs were 0% and 23% in the two arms, respectively. The DCR was 100% in patients who were EGFR activating mutation positive, and it was 36% in EGFR WT patients in the erlotinib arm (P = .0004) compared with 67% for mutation-positive patients and 68% for WT patients in the chemotherapy plus erlotinib arm (P = 1.0). EGFR FISH-positive patients had a numerically higher RR (18.9% in the erlotinib arm and 26% in the chemotherapy plus erlotinib arm) compared with the EGFR FISH-negative patients (3% in the erlotinib arm and 19% in the chemotherapy plus erlotinib arm; Table 3). KRAS mutations had a trend toward a negative effect on RR and DCR when these patients were compared with patients who were KRAS WT (erlotinib: RR 0% v 16% [P = .1908]; DCR 31% v 53% [P = .2168]; and chemotherapy plus erlotinib: RR 20% v 24% [P = 1.0]; DCR, 53% v 78% [P = .0977]). For EGFR IHC, E-cadherin status, and vimentin status, no statistically significant differences were seen for RR.
Table 3.
Response by Biomarker Status
| Factor | % of Patients by Response and Treatment Arm |
|||
|---|---|---|---|---|
| CR + PR |
CR + PR + SD |
|||
| Erlotinib (n = 69) | CP + Intercalated Erlotinib (n = 67)* | Erlotinib (n = 69) | CP + Intercalated Erlotinib (n = 67)* | |
| Overall | 11.6 | 22.4 | 46.4 | 71.6 |
| EGFR by IHC status | ||||
| Positive | 9.4 | 21.3 | 45.3 | 72.1 |
| Negative | 33.3 | 33.3 | 66.7 | 66.7 |
| EGFR by FISH status | ||||
| Positive | 18.9 | 25.7 | 54.1 | 74.3 |
| Negative | 3.3 | 18.8 | 36.7 | 68.8 |
| EGFR mutation status | ||||
| Mutation | 53.8 | 36.4 | 84.6 | 81.8 |
| Activating mutation | 66.7 | 33.3 | 100.0 | 66.7 |
| Other mutation | 25.0 | 40.0 | 50.0 | 100.0 |
| No mutation | 0 | 22.7 | 35.6 | 68.2 |
| KRAS mutation status | ||||
| Mutation | 0 | 20.0 | 30.8 | 53.3 |
| No mutation | 15.7 | 24.0 | 52.9 | 78.0 |
| E-cadherin | ||||
| High | 8.0 | 28.6 | 52.0 | 76.2 |
| Low | 18.2 | 16.0 | 36.4 | 56.0 |
| Vimentin | ||||
| High | 15.0 | 27.3 | 40.0 | 100.0 |
| Low | 10.7 | 21.2 | 42.9 | 57.6 |
Abbreviations: CR, complete response; PR, partial response; SD, stable disease; CP, carboplatin/paclitaxel; IHC, immunohistochemistry; FISH, fluorescent in situ hybridization.
One patient on the CP + intercalated erlotinib arm had no measurable disease at baseline and was nonevaluable for response.
OS
Among 137 patients assessed for survival, the median survival time was 16.7 months in the erlotinib arm, and it was 11.43 months in the chemotherapy plus erlotinib arm. The 12-month survival rates were 59% and 46%, respectively (Table 2; Fig 4). For patients with activating EGFR mutations, the 12-month OS rate was 100% in the erlotinib arm, and it was 41.7% in the chemotherapy plus erlotinib arm. However, in the EGFR WT patients, survival curves were nearly overlapping, and the median survival times were 15.6 months and 13.3 months in the erlotinib and the chemotherapy plus erlotinib arms, respectively (Fig 4).
Fig 4.
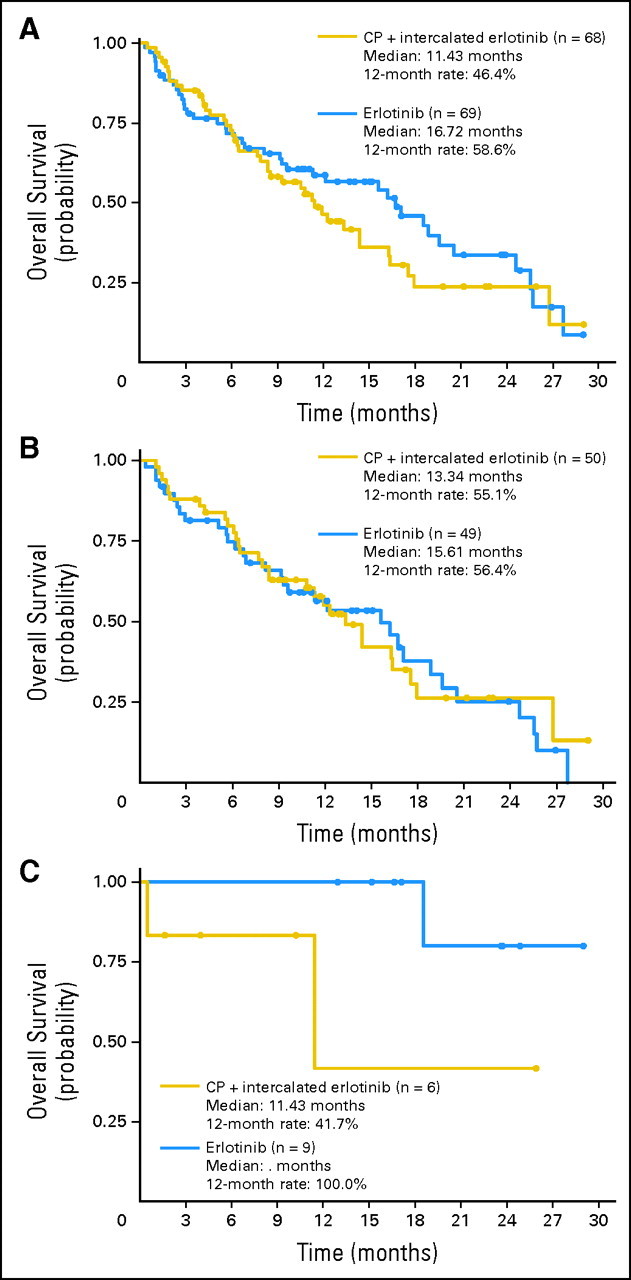
Kaplan-Meier plots of overall survival. (A) All patients; (B) EGFR wild-type patients; (C) EGFR mutant patients. CP, carboplatin/paclitaxel.
For the EGFR FISH-positive patients no statistically difference was seen between the two treatment arms (12-month OS rates of 62% for erlotinib and 55% for chemotherapy plus erlotinib). In the FISH-negative group, the 12-months OS rates were 56.5% with erlotinib and 38.4% with chemotherapy plus erlotinib (Table 2). For the EGFR IHC-positive patients, the 12-month OS rates were 56.8% in the erlotinib arm and 40.1% in the chemotherapy plus erlotinib arm. No difference in survival was seen among patients within the same treatment arm for KRAS mutation versus WT, E-cadherin high versus low expression, or vimentin high versus low expression (Table 2).
Toxicity.
The most common adverse event was skin rash (81% [grades 3 to 4, 9%] in erlotinib arm and 76% [grades 3 to 4, 4%] in the chemotherapy plus erlotinib arm; Table A2). In the chemotherapy plus erlotinib arm, 10 patients (15%) had chemotherapy adjustments as a result of hematologic toxicity, and 29 patients (43%) had them as a result of nonhematologic toxicity. There was at least one dose interruption of erlotinib in 17 patients (25%) in the erlotinib arm and in 23 patients (34%) in the chemotherapy plus erlotinib arm.
DISCUSSION
Personalized medicine requires molecular analyses of tumor tissue obtained before therapy to select the best treatment. One goal of this study was to determine whether molecular tests could be performed on lung cancer samples from untreated patients with advanced-stage NSCLC in a clinically relevant time frame (defined in this study as < 5 working days). We obtained tissue from 215 (89.6%) of 240 screened patients without additional rebiopsy. Of these, 11% failed quality control evaluation. Thus, molecular results were available on 80% of the patients, demonstrating that molecular phenotyping can be done in the majority of patients in a reasonable time frame to select therapy. The primary goal was to evaluate treatment outcomes from intercalating erlotinib with chemotherapy and erlotinib alone. In this EGFR-selected population, the intercalated therapy provided similar outcomes to erlotinib alone on the basis of the primary end point of 6-month PFS. Neither treatment arm exceeded the historical 6-month PFS rate of 45%.4,5
An exploratory goal was to determine whether erlotinib alone could be superior to intercalated therapy in any of the biomarker-selected patients. Patients with activating EGFR mutations treated with erlotinib alone had superior RRs, superior PFS, and superior OS compared with the intercalated therapy arm. The favorable response rates and outcome for patients with advanced NSCLC who had EGFR mutations and who were treated with EGFR TKIs alone are consistent with studies evaluating gefitinib in untreated patients with advanced-stage NSCLC7,15,16 and with the OPTIMAL study, which demonstrated superior PFS with erlotinib alone compared with chemotherapy in patients with EGFR mutations.16 In patients with EGFR mutations, the lower RR and shorter PFS with intercalated therapy suggest antagonism between the treatments.3,8 In patients with EGFR WT, the results with intercalated therapy were similar to those reported with chemotherapy alone.4,5
In studies of erlotinib in later lines of therapy, patients with EGFR WT treated with erlotinib had a superior survival compared with placebo.1,2 Thus, a remaining question is whether a single biomarker or combination of biomarkers will help to select patients with EGFR WT tumors for EGFR TKI therapy in the first line and beyond. This trial does not support use of erlotinib or chemotherapy plus erlotinib in the first-line setting in EGFR WT patients who could be selected by any other analyzed biomarker, including EGFR FISH or KRAS mutations. When the EGFR-mutated patients are excluded from the FISH-positive analysis and from the KRAS WT analysis, there remains no striking difference in outcome between those treated with erlotinib or intercalated therapy on the basis of FISH or KRAS status. Our finding is supported by the results from Cancer and Leukemia Group B study CALGB 30406, in which no difference between erlotinib alone or chemotherapy plus erlotinib was found in never smokers or light smokers who had lung adenocarcinomas with high response and by the positive outcome in patients with EGFR mutations treated with erlotinib alone, which support the use of an EGFR TKI alone as first-line therapy in patients with NSCLC who have EGFR mutations.17
In summary, this study could not demonstrate any benefit of combining chemotherapy and intercalated EGFR TKI in patients with advanced NSCLC. The study demonstrated the feasibility of a prospective, multi-institutional biomarker study in advanced NSCLC and supports the importance of determining the EGFR mutation status of patients with advanced NSCLC before initial therapy.
Acknowledgment
We thank the patients and their families as well as the sites that participated in this study. We also thank Regina Sennello and David Young for biomarker analysis support and Aimee Tetrault for editorial support.
Appendix
Mutation Analysis: DNA Isolations
A hematoxylin and eosin slide and four 7-to 10-micron formalin-fixed, paraffin-embedded sections of non–small-cell lung cancer (NSCLC) tumors were sent to Genzyme Genetics (Westborough, MA) for DNA isolation and EGFR mutational analysis. On the basis of pathologist review of the hematoxylin and eosin slide, the tumor was manually microdissected, and the DNA was isolated by using polymerase chain reaction (PCR) amplification followed by Sanger DNA sequencing. The remaining DNA from these isolations and all remaining slides were returned to OSI Pharmaceuticals for additional DNA isolations, as necessary, and for KRAS amplification with PCR followed by bidirectional sequencing at the University of Colorado Cancer Center Sequencing and Analysis Core Facility, (Aurora, CO). Any tumor regions remaining on returned sections were manually microdissected, and the DNA was isolated with QIAamp DNA mini or micro kits (Qiagen, Valencia, CA). For small numbers of tumor cells on the slides or slides from fine-needle aspirates, 1.0 μg of carrier polyA-RNA, supplied with the QIAmp micro kit, was added to the tumor lysate. Any DNA isolated by Genzyme was combined with DNA isolated at OSI and was applied to the Qiagen column for DNA purification. The DNA concentration of the column eluate of each sample was determined with absorbance at 260 nm.
EGFR Mutation Analysis
EGFR exons 18 through 21 were PCR amplified at Genzyme Genetics according to their standard procedure for EGFR mutational analysis. The resultant PCR fragments were sequenced with BigDye version 1 and 3130 Genetic Analyzer (Applied Biosystems, Foster City, CA).
KRAS Mutation Analysis
The KRAS gene was amplified by PCRunder the following reaction conditions: DNA (approximately 5 ng), 1.25 unit JumpStart Taq DNA polymerase without magnesium chloride (MgCl2; Sigma-Aldrich, Lenexa, KS), JumpStart Buffer, 3 mmol/L MgCl2, 200 μM dNTPs, and 0.3 μmol/L each of the forward (5′-GTGTATTAACCTTATGTGTGAC-3′) and reverse (5′-CTGTATCAAAGAATGGTCCTGCA-3′) KRAS primers. The reactions were heated to 95°C for 15 minutes followed by 35 to 45 cycles of 30 seconds at 94°C, 30 seconds at 54°C, and 40 seconds at 72°C, followed by one cycle of 5 minutes at 72°C, and then were held at 4°C to 10°C until analyzed. For samples with total DNA less than 50 ng, it was necessary to perform a nested PCR for the KRAS regions. This would ensure that there was sufficient DNA for at least three independent PCR reactions in each of the three methods chosen. In the nested PCR reactions, the first round of PCR was performed as described above; however, only 20 cycles instead of the 35 to 45 cycles of amplification were performed. For the nested PCR amplification, 1.0 μL of a 1:40 (A549 and H1957) or a 1:10 (no template controls and FFPET samples) dilution from the first PCR reactions was used. The nested PCR conditions were as described above with 35 cycles of amplification and the forward (5′-ATGTTCTAATATAGTCACATTTTC-3′) and reverse (5′- ACAAGATTTACCTCTATTGTTG-3′) nested primers. Amplified PCR fragments were visualized on a 10 cm × 10 cm precast, 1 mm × 10 well, nondenaturing, 10% polyacrylamide Tris-borate-EDTA (TBE) gel (Invitrogen, Carlsbad, CA). The gels were stained with ethidium bromide, and the DNA bands were photographed with a FujiFilm LAS 3000 Image Reader (Valahhalla, NY). Excess primers were removed by digestion by ExoSAP-IT (USB, Cleveland, OH) The amplified KRAS fragments were sent to the University of Colorado Cancer Center Sequencing and Analysis Core Facility for bidirectional sequencing using an ABI 3730 sequencer (Applied Biosystems, Foster City, CA). Sequence analysis was performed with the calling program on the ABI 3730 on at least two independent PCR amplifications of each DNA sample. The presence of mutations in the 12th or 13th codons of the KRAS gene were determined by comparing the sequencing chromatograms of patient samples to those of published wild-type KRAS (NCBI: NG_007524).
Cut Point Determination
For IHC, a positive epidermal growth factor receptor (EGFR) protein expression status was defined as any staining for EGFR with the EGFR PharmDX kit (Dako, Carpentaria, CA).
Cut points for E-cadherin and vimentin were based on data from the BR.21 erlotinib study. In this study, the optimal cut points for high and low e-cadherin and vimentin were determined by using multiple analyses performed at each of a large number of cut points for each scoring method. Only those cut points for which there were sufficient data were considered, with sufficient defined as at least 10 patients in each group and as each group containing 20% to 80% of the total number of evaluable patients. On the basis of sensitivity analyses, a cut point of 40% staining of intensity 2 or 3 was chosen for e-cadherin in the BR.21 study. A cut point of 10% staining of any intensity was chosen for vimentin. On the basis of these data, the same cut points were used in the 774-203 clinical study.
The Following Institutions Participated in This Study
University of Colorado Cancer Center, Aurora, CO: D. Ross Camidge, MD, PhD; Rush-Presbyterian, Chicago, IL: Philip Bonomi, MD; Norton Healthcare, Inc., Louisville, KY: John Hamm, MD; The M.D. Anderson Cancer Center, Houston, TX: Roy Herbst, MD, PhD; Fox Chase Cancer Center, Philadelphia, PA: Corey Langer, MD; Fred Hutchinson Cancer Research Center, Seattle, WA: Renato Martins, MD; Bay Area Cancer Research, Pleasant Hill, CA: Ostap Melnyk, MD; University of California, Los Angeles Medical Center, Los Angeles, CA: Fairooz Kabbinavar, MD; Providence Portland Medical Center, Portland, OR: Brendan Curti, MD; Alegent Healthcare, Omaha, NE: Gamini Soori, MD; University of Chicago, Chicago, IL: Everett Vokes, MD; Rocky Mountain Cancer Centers, Denver, CO: Samir Witta, MD, PhD; Central Hematology Oncology Medical Group, Alhambra, CA: Eddie Hu, MD; Comprehensive Blood and Cancer Center, Bakersfield, CA: Ravi Patel, MD; Virginia K. Crosson Cancer Center, Fullerton, CA: Giribala Patel, MD; Comprehensive Cancer Centers of Nevada, Henderson, NV: Mary Ann Allison, MD; Suburban Hematology-Oncology Associates, Lawrenceville, GA: Christopher Hagenstad, MD; Pacific Shores Medical Group, Long Beach, CA: Andre Kiem Dian Liem, MD; North Valley Hematology/Oncology Medical Group, Northridge, CA: Sheldon Davidson, MD; Ventura County Hematology-Oncology Specialists, Oxnard, CA: Rosemary McIntyre, MD; Cancer Care Associates Medical Group, Redondo Beach, CA: David Chan, MD; Santa Barbara Hematology Oncology Medical Group, Santa Barbara, CA: Frederic Kass, MD; Sansum Santa Barbara Medical Foundation Clinic, Santa Barbara, CA: Julie Taguchi, MD; Wilshire Oncology Medical Group, Pomona, CA: Linda Bosserman, MD; Fox Chase Virtua Health, Mt. Holly, NJ: James Lee, MD; Karmanos Cancer Center, Detroit, MI: Antoinette Wozniak, MD; The West Cancer Clinic, Memphis, TN: Lee Schwartzberg, MD; Pottsville Cancer Clinic, Pottsville, PA: Satish Singla, MD; Cancer Specialists of Tidewater, Chesapeake, VA: William Mac Laughlin, MD; Eastern Connecticut Hematology and Oncology Associates, Norwich, CT: Dennis Slater, MD; Central Georgia Cancer Care, Macon, GA: Fred Schnell, MD; Hematology Oncology Centers of Northern Rockies Research, Billings, MT: David Christianson, MD; Birmingham Heartlands Hospital, Birmingham, United Kingdom: Joyce Thompson, MD; Mount Vernon Hospital, Middlesex, United Kingdom: Jeanette Dickson, MD; Beatson West of Scotland Cancer Centre, Glasgow, United Kingdom: David Dunlop, MD; Cambridge Research Institute, Cambridge, United Kingdom: Tim Eisen, PhD; Peterborough District Hospital, Cambridge, United Kingdom: Kate Fife, MD; University of Minnesota Cancer Center, Minneapolis, MN: Arkadiusz Dudek, MD, PhD; Fletcher Allen Health Care, Burlington, VT: Steven Grunberg, MD; Gulfcoast Oncology Associates, Tampa, FL: R. Waide Weaver, MD; and The M.D. Anderson Cancer Center, Orlando, FL: Jennifer Tseng, MD.
Table A1.
Baseline Demographic and Clinical Characteristics
| Characteristic | % of Patients by Treatment Arm |
||
|---|---|---|---|
| Erlotinib (n = 72) | CP + Intercalated Erlotinib (n = 71) | Total (N = 143) | |
| Sex | |||
| Female | 61 | 44 | 52 |
| Age, years | |||
| < 70 | 72 | 61 | 66 |
| Ethnicity | |||
| White | 85 | 73 | 79 |
| Black | 3 | 10 | 6 |
| Asian | 12 | 6 | 9 |
| Hispanic | 0 | 11 | 6 |
| ECOG PS | |||
| 0-1 | 90 | 96 | 93 |
| 2 | 10 | 3 | 6 |
| Unknown | 0 | 1 | < 1 |
| Weight loss in last 6 months, % | |||
| < 5 | 72 | 65 | 69 |
| ≥ 5 | 25 | 29 | 27 |
| Unknown | 3 | 6 | 4 |
| Cigarette smoking history | |||
| Never smoked or < 100 cigarettes in lifetime | 26 | 30 | 28 |
| Former smoker | 54 | 54 | 54 |
| Current smoker | 19 | 17 | 18 |
Abbreviations: CP, carboplatin/paclitaxel; ECOG PS, Eastern Cooperative Oncology Group performance status.
Table A2.
Grades 3 to 4 Adverse Events Occurring in ≥ 5% of Patients in at Least One Treatment Group Regardless of Causality
| Toxicity | Grades 3 to 4 Events |
|||
|---|---|---|---|---|
| Erlotinib (n = 69) |
CP + Intercalated Erlotinib (n = 68) |
|||
| No. | % | No. | % | |
| Diarrhea | 1 | 1 | 6 | 9 |
| Nausea | 2 | 3 | 6 | 9 |
| Vomiting | 0 | 0 | 6 | 9 |
| Rash | 6 | 9 | 3 | 4 |
| Fatigue | 2 | 3 | 12 | 18 |
| Anorexia | 1 | 1 | 7 | 10 |
| Hypokalaemia | 1 | 1 | 4 | 6 |
| Pneumonia | 5 | 7 | 1 | 1 |
| Neutropenia | 1 | 1 | 17 | 25 |
Abbreviation: CP, carboplatin/paclitaxel.
Footnotes
Supported by an unrestricted grant from OSI Pharmaceuticals and from National Cancer Institute Lung SPORE Award No. P50 CA058187.
Authors' disclosures of potential conflicts of interest and author contributions are found at the end of this article.
Clinical trial information can be found for the following: NCT00294762.
AUTHORS' DISCLOSURES OF POTENTIAL CONFLICTS OF INTEREST
Although all authors completed the disclosure declaration, the following author(s) indicated a financial or other interest that is relevant to the subject matter under consideration in this article. Certain relationships marked with a “U“ are those for which no compensation was received; those relationships marked with a “C“ were compensated. For a detailed description of the disclosure categories, or for more information about ASCO's conflict of interest policy, please refer to the Author Disclosure Declaration and the Disclosures of Potential Conflicts of Interest section in Information for Contributors.
Employment or Leadership Position: Frank Richardson, OSI Pharmaceuticals (C); Bret Wacker, OSI Pharmaceuticals (C); David W. Sternberg, OSI Pharmaceuticals (C) Consultant or Advisory Role: Fred R. Hirsch, Genentech (C), Celgene (C), GlaxoSmithKline (C), Eli Lilly (C), OSI Pharmaceuticals (C), Pfizer (C), Boehringer Ingelheim (C), Ventana (C); Tim Eisen, Roche (C), AstraZeneca (C); Rafal Dziadziuszko, AstraZeneca (C); Katherine Richardson, OSI Pharmaceuticals (C); Jason Rusk, OSI Pharmaceuticals (C); Paul A. Bunn Jr, AstraZeneca (C), Bayer Pharmaceuticals (C), Boehringer Ingelheim (C), Bristol-Myers Squibb (C), Eli Lilly (C), GlaxoSmithKline (C), Merck (C), Novartis (C), OSI Pharmaceuticals (C), Genentech (C) Stock Ownership: Tim Eisen, AstraZeneca; David W. Sternberg, OSI Pharmaceuticals Honoraria: Tim Eisen, Roche, AstraZeneca; Renato Martins, Genentech; Wilbur A. Franklin, Genentech; Paul A. Bunn Jr, AstraZencea, Bayer Pharmaceuticals, Boehringer Ingelheim, Bristol-Myers Squibb, Eli Lilly, GlaxoSmithKline, Merck, Novartis, OSI Pharmaceuticals, Genentech Research Funding: Tim Eisen, AstraZeneca; Renato Martins, Genentech; Paul A. Bunn Jr, OSI Pharmaceuticals Expert Testimony: None Other Remuneration: Fred R. Hirsch, Paul A. Bunn Jr, and Marileila Varella-Garcia are coinventors of a patent held by the University of Colorado to use EGFR FISH for selection of patients with non–small-cell lung cancer for treatment epidermal growth factor receptor inhibitors; Marileila Varella-Garcia, Coinventor in a patent held by the University of Colorado to use EGFR markers for selection of patients with non–small-cell lung cancer for treatment with epidermal growth factor receptor inhibitors
AUTHOR CONTRIBUTIONS
Conception and design: Fred R. Hirsch, Frank Richardson, Bret Wacker, Jason Rusk, Paul A. Bunn Jr, D. Ross Camidge
Provision of study materials or patients: Tim Eisen
Collection and assembly of data: Fred R. Hirsch, Fairooz Kabbinavar, Renato Martins, Fredrick M. Schnell, Rafal Dziadziuszko, Katherine Richardson, Jason Rusk, Wilbur A. Franklin, Marileila Varella-Garcia, D. Ross Camidge
Data analysis and interpretation: Fred R. Hirsch, Fairooz Kabbinavar, Tim Eisen, Renato Martins, Fredrick M. Schnell, Rafal Dziadziuszko, Frank Richardson, Bret Wacker, David W. Sternberg, Wilbur A. Franklin, Marileila Varella-Garcia, Paul A. Bunn Jr, D. Ross Camidge
Manuscript writing: All authors
Final approval of manuscript: All authors
REFERENCES
- 1.Shepherd FA, Rodrigues PereiraJ, Ciuleanu T, et al. Erlotinib in previously treated non-small-cell lung cancer. N Engl J Med. 2005;353:123–132. doi: 10.1056/NEJMoa050753. [DOI] [PubMed] [Google Scholar]
- 2.Cappuzzo F, Ciuleanu T, Stelmakh L, et al. SATURN: A double-blind, randomized, phase III study of maintenance erlotinib versus placebo following nonprogression with first-line platinum-based chemotherapy in patients with advanced NSCLC. Lancet Oncol. 2010;11:521–529. [Google Scholar]
- 3.Zhou C, Wu Y-L, Chen G, et al. Efficacy results from the randomized phase III optimal study comparing first-line erlotinib versus carboplatin plus gemcitabine in Chinese advanced non-small-cell lung cancer patients with EGFR activating mutations. Presented at the 35th ESMO Congress; October 8-12, 2010; Milan, Italy. [Google Scholar]
- 4.Gatzemeier U, Pluzanska A, Szczesna A, et al. Phase III study of erlotinib in combination with cisplatin and gemcitabine in advanced non–small-cell lung cancer: The Tarceva Lung Cancer Investigation Trial. J Clin Oncol. 2007;25:1545–1552. doi: 10.1200/JCO.2005.05.1474. [DOI] [PubMed] [Google Scholar]
- 5.Herbst RS, Prager D, Hermann R, et al. TRIBUTE: A phase III trial of erlotinib hydrochloride (OSI-774) combined with carboplatin and paclitaxel chemotherapy in advanced non–small-cell lung cancer. J Clin Oncol. 2005;23:5892–5899. doi: 10.1200/JCO.2005.02.840. [DOI] [PubMed] [Google Scholar]
- 6.Davies AM, Hesketh PJ, Beckett L, et al. Pharmacodynamic separation of erlotinib and docetaxel in advanced non–small-cell lung cancer: Overcoming hypothesized antagonism. J Clin Oncol. 2007;25(suppl):18s. abstr 7618. [Google Scholar]
- 7.Hirsch FR, Varella-Garcia M, Cappuzzo F, et al. Combination of EGFR gene copy number and protein expression predicts outcome for advanced non-small-cell lung cancer patients treated with gefitinib. Ann Oncol. 2007;18:752. doi: 10.1093/annonc/mdm003. [DOI] [PubMed] [Google Scholar]
- 8.Mok TS, Wu YL, Thongprasert S, et al. Gefitinib or carboplatin-paclitaxel in pulmonary adenocarcinoma. N Engl J Med. 2009;361:947–957. doi: 10.1056/NEJMoa0810699. [DOI] [PubMed] [Google Scholar]
- 9.Pocock SJ, Simon R. Sequential treatment assignment with balancing for prognostic factors in the controlled clinical trial. Biometrics. 1975;31:103–115. [PubMed] [Google Scholar]
- 10.Clark G, Zborowski D, Culbertson J, et al. Utility of epidermal growth factor receptor expression for selecting patients with advanced non–small- cell lung cancer for treatment with erlotinib. J Clin Oncol. 2006;1:837–846. [PubMed] [Google Scholar]
- 11.Cappuzzo F, Hirsch FR, Rossi E, et al. Epidermal growth factor receptor gene and protein and gefitinib sensitivity in non-small cell lung cancer. J Natl Cancer Inst. 2005;97:643–655. doi: 10.1093/jnci/dji112. [DOI] [PubMed] [Google Scholar]
- 12.Hirsch FR, Varella-Garcia M, McCoy J, et al. Increase epidermal growth factor receptor gene copy number detected by fluorescent in situ hybridization associates with increase sensitivity to gefitinib in patient with bronchioloalveolar carcinoma subtypes: A Southwest Oncology Group study. J Clin Oncol. 2005;24:5032–5042. doi: 10.1200/JCO.2005.01.2823. [DOI] [PubMed] [Google Scholar]
- 13.Simon R, Wittes RE, Ellenberg SS. Randomized phase II clinical trials. Cancer Treat Rep. 1985;69:1375–1381. [PubMed] [Google Scholar]
- 14.Therasse P, Arbuck SG, Eisenhauer EA, et al. New guidelines to evaluate the response to treatment in solid tumors: European Organization for Research and Treatment of Cancer, National Cancer Institute of the United States, National Cancer Institute of Canada. J Natl Cancer Inst. 2000;92:205–216. doi: 10.1093/jnci/92.3.205. [DOI] [PubMed] [Google Scholar]
- 15.Maemondo M, Inoue A, Kobayashi K, et al. Gefitinib or chemotherapy for non-small cell lung cancer with mutated EGFR. N Engl J Med. 2010;25:2380–2388. doi: 10.1056/NEJMoa0909530. [DOI] [PubMed] [Google Scholar]
- 16.Mitsudomi T, Morita S, Yatabe Y, et al. Gefitinib versus cisplatin plus docetaxel in patients with non-small-cell lung cancer harboring mutations of the epidermal growth. Lancet Oncol. 2009;11:121–128. doi: 10.1016/S1470-2045(09)70364-X. [DOI] [PubMed] [Google Scholar]
- 17.Janne PA, Wang XF, Socinski MA, et al. Randomized phase II trial of erlotinib alone or in combination with carboplatin/paclitaxel in never or light former smokers with advanced lung adenocarcinoma: CALGB 304. J Clin Oncol. 2010;28(suppl):15s. doi: 10.1200/JCO.2011.40.1315. abstr 7503. [DOI] [PMC free article] [PubMed] [Google Scholar]