

Abstract
Over the past two decades, high-throughput (HTP) technologies such as microarrays and mass spectrometry have fundamentally changed clinical cancer research. They have revealed novel molecular markers of cancer subtypes, metastasis, and drug sensitivity and resistance. Some have been translated into the clinic as tools for early disease diagnosis, prognosis, and individualized treatment and response monitoring. Despite these successes, many challenges remain: HTP platforms are often noisy and suffer from false positives and false negatives; optimal analysis and successful validation require complex workflows; and great volumes of data are accumulating at a rapid pace. Here we discuss these challenges, and show how integrative computational biology can help diminish them by creating new software tools, analytical methods, and data standards.
Electronic supplementary material
The online version of this article (doi:10.1007/s00439-011-0983-z) contains supplementary material, which is available to authorized users.
Introduction
Since the commercialization of DNA microarray technology in the late 1990s, high-throughput (HTP) data relevant to cancer research have been accumulating at an ever-increasing rate. These data have led to crucial insights into fundamental cancer biology, including the mechanisms of tumorigenesis, metastasis, and drug resistance (Rhodes and Chinnaiyan 2005). They have also had enormous clinical impact, e.g., several cancers can now be fractionated into therapeutic subsets with unique prognostic outcomes based on their molecular phenotypes (Buyse et al. 2006; Dhanasekaran et al. 2001; Lowe et al. 2010; Pegram et al. 1998; Slamon and Press 2009; Spentzos et al. 2004; Zhu et al. 2010b). Despite these successes, many cancers still have a high mortality rate and no effective treatment. Looking at 1.9 million patients from 31 countries and 5 continents, the CONCORD study found that current treatments achieve a 5-year survival rate for less than 50% of diagnosed cancers (Coleman et al. 2008). For many cancers, survival rates have not changed in decades—pancreatic cancer remains almost 100% lethal, and the overall survival rate for lung cancer has improved only from 13% to 16%. Most cancers still lack any effective early disease biomarkers, and predictive signatures are limited to a few known mutations, such as EGFR or kRAS in lung cancer or HER2 in breast cancer. Predictive and prognostic biomarkers are often inconsistent from study to study (i.e., they show poor overlap), and cannot be validated by other methods or in new cohorts of patients (Diamandis 2010; Dupuy and Simon 2007; Lau et al. 2007).
The key difficulty is that cancer is a complex and heterogeneous disease: many genes are amplified, deleted, mutated, and up- or down-regulated. Many pathways are activated or suppressed. These changes vary substantially in different cancers, in different patients with the same cancer, and even in different tumor samples from the same patient (Axelrod et al. 2009; Bachtiary et al. 2006; Blackhall et al. 2004). To get the full picture, we will need to combine information from diverse experimental platforms and other sources that offer different perspectives on the problem, e.g., gene and protein expression, protein–protein interactions (PPIs) and pathways, chromosomal aberrations, mutation events, epigenetic changes, and clinical information from drug trials and the bedside—leading to integrative computational biology.
The challenges fall into three main categories. The first is noise: HTP platforms are inherently noisy—results vary substantially from run to run and from lab to lab, and are prone to false positives and negatives. The second challenge is volume: there is a vast quantity of relevant data, new data are piling up at an increasing rate and old data need to be constantly reinterpreted and updated in the light of new findings or reanalyzed with improved algorithms. The third challenge is analysis: simple methods—such as differential expression analyses of microarray data—often miss much of the signal in the data.
Integrative computational methods will continue to play a central role in addressing these challenges. We need new designs for databases; new software and workflows to combine and continuously update heterogeneous and distributed data; new analytical methods to identify complex signals in different data sources; and new standards for generating, maintaining, and sharing data. These methods will depend on advances in many areas such as statistics, knowledge representation and ontology, machine learning, data mining, graph theory, and visualization. Integrative analyses may ultimately lead to a better understanding of cancer, earlier diagnoses and true personalized medicine, where therapies are individually tailored based on combinations of single nucleotide polymorphisms, and gene, protein and microRNA expression levels (Auffray et al. 2009; Augen 2001; Cervigne et al. 2009; Reis et al. 2010; Zhu et al. 2010a, b).
Integrative computational biology shares many tools and goals with the closely related field of systems biology, the discipline that attempts to explain the structure and behavior of complex biological systems as a function of their simpler components (Kirschner 2005). The term systems biology may be applied to describe anything from the output of an ‘omics’ experiment to explicit mechanical models of tumor growth (Deisboeck et al. 2009; Hornberg et al. 2006). Integrative computational biology, in contrast, specifically concerns the computational interrogation and integration of diverse HTP molecular biology data.
In this review, we discuss the major challenges of HTP cancer studies and give examples of integrative computational methods that help to meet them.
The challenges facing HTP cancer biology
A wealth of genomic and proteomic cancer data is now available from HTP screens. While these data have improved our understanding of basic cancer biology and some have even translated into improved patient diagnosis and treatment, significant challenges remain. In this section we briefly review some of the major obstacles to the progress of HTP cancer research.
Noise
Cancer is a heterogeneous disease, and HTP platforms are noisy, i.e., the resulting data sets have false positives and false negatives. Consequently, there can be large variation in results from lab to lab (Bell et al. 2009; Irizarry et al. 2005); methods are needed to control this noise and to integrate different data sources to make them more reliable. The main noise issues that plague HTP cancer research are false negatives and false positives, intra- and inter-sample heterogeneity, and platform bias.
False negatives and false positives in HTP data
HTP screens suffer from substantial noise—both false positives and false negatives—which must be resolved through complementary experiments and computational analysis (Auffray et al. 2009; Augen 2001). For example, while HTP PPI screens can identify thousands of protein interactions at once, they do so at the cost of either high false discovery rates or poor sensitivity. The false discovery rate is the proportion of detected interactions that are false, and sensitivity is the proportion of true interactions that are successfully detected. When interactions detected by two HTP studies were tested in small-scale screens, they were found to have false discovery rates of 22% (Rual et al. 2005) and 38% (Stelzl et al. 2005). An evaluation of five HTP methods found that their sensitivity rates ranged from only 21 to 36% at false discovery rates of 0–11% (Braun et al. 2009). Similarly, mass spectrometry analyses of human serum typically produce many false negatives (Gstaiger and Aebersold 2009). One problem is that human serum has a high dynamic range—protein concentrations are estimated to vary over ten orders of magnitude (Gstaiger and Aebersold 2009). Mass spectrometers have a much smaller range of detection, leading to false negatives: low abundance proteins are not detected. This challenge may be somewhat diminished by extensive sample fractionation (Kislinger et al. 2006).
Tumors are heterogeneous
Often only a single sample from each tumor is available for analysis. But tumors are highly heterogeneous, so these samples may not be representative of the whole tumor (Axelrod et al. 2009; Bachtiary et al. 2006; Blackhall et al. 2004). Tumors comprise cells belonging to several distinct subpopulations—e.g., tumor regions can be hypoxic to different extents, or be made up of different proportions of tumor initiating cells (cancer stem cells)—and these differences have consequences for predicting drug response and prognosis (Axelrod et al. 2009; Blackhall et al. 2004; Jubb et al. 2010). Intra-tumor heterogeneity can lead to different cell populations expressing different levels of protein, or having different mutations and copy number alterations, which complicates analyses. For example, variable tumor epithelial and stromal cell content in breast tumor samples can significantly affect gene expression profiles and signature accuracy (Cleator et al. 2006; Myhre et al. 2010). Some of these difficulties can be alleviated with techniques such as laser-capture micro-dissection (Fend and Raffeld 2000), which can isolate regions of a sample that contain a more uniform population of cells, but these techniques remain costly and slow. In addition, they may not result in a sufficient amount of material for follow-up experiments. Though single samples from tumors can suffice for population-level studies (Axelrod et al. 2009), the fact that two samples from the same patient can be quite different means that this heterogeneity poses a significant challenge to personalized medicine. On top of that, in cancer studies there are issues with the control samples available for analysis: often these “normal” samples come from tissue directly adjacent to the tumor. The properties of these samples, such as gene expression profiles, may be quite different from those of more distant tissue or of a healthy patient (Chandran et al. 2005).
Different experimental platforms can disagree
Experimental platforms produced by different companies can yield conflicting results (Curtis et al. 2009; Elias et al. 2005; Tan et al. 2003). For example, different microarray platforms use different probe design and labeling and have different dynamic ranges. A gene may be overexpressed in cancer on one platform, yet under-expressed on another, simply because the two platforms use different DNA sequences to “probe” the same gene. On a given platform, some genes are represented by many probes while others by one or none, and this representation is different for different platforms. Genes that are expressed at low levels are particularly problematic for concordance across array platforms (Barnes et al. 2005). Another problem is that genome annotations continue to grow and change (Eggle et al. 2009). Updated probe set definitions can substantially affect the number and the identity of differentially expressed genes (Sandberg and Larsson 2007). Further, HTP technology is developing rapidly and new technologies are coming into use every year; and there will always be new differences and conflicts to resolve. The challenge is to have infrastructure set-up to compare and integrate new technologies as they come along, and systematically identify the best workflow for data processing and analysis, e.g. (Ponzielli et al. 2008).
Analysis
A primary goal of integrative computational biology analysis in individualized medicine is to identify small groups of genes/proteins/microRNAs, etc., that can be used to improve diagnosis, predict outcome or predict treatment response, i.e., to identify prognostic or predictive signatures. Their identification in HTP data is challenging since basic analysis methods fail to capture the entire signal in the data, and good signatures comprise not only the most differentially expressed molecules. For this section we will focus our attention on gene expression microarray studies, but the criticisms apply equally well to similar experimental designs, such as those using HTP protein or microRNA assays.
Lists of differentially expressed genes show poor overlap across studies
The most popular way of analyzing microarray data is to detect whether individual genes are differentially expressed in one condition versus in another, e.g., in non-responders versus responders to some drug treatment. Differentially expressed genes are widely used in cancer research—their applications include deriving molecular signatures of cancer subtypes, increasing our understanding of the biology of tumorigenesis, and providing new candidate markers for diagnosis, prognosis, and drug response. Unfortunately, there are major challenges with their identification and interpretation. Previous work has shown that lists of differentially expressed genes are poorly reproduced across studies (Tian et al. 2005; Zhang et al. 2008); even random subsets of samples from one experiment can yield widely divergent gene lists. These problems are caused by high dimensionality, small number of samples, and noise (biological and technical variability), but they can be exacerbated by the analysis method. For example, analyses that quantify the differential expression of gene groups rather than individual genes show higher conservation across platforms and studies (Subramanian et al. 2005).
The most differentially expressed genes do not yield the best signatures
Very often in microarray experiments, the most differentially expressed genes are used to construct prognostic or predictive signatures: machine learning methods are trained to use the expression levels of those genes to predict, e.g., the disease state of a patient and probability of survival. The problem with this approach is that single-gene analyses overlook multivariate effects. More sophisticated analyses are needed to identify sets of genes that complement one another, i.e., ones whose combined expression levels yield the best-performing prognostic signatures. Such analyses show that genes essential to a good prognostic signature are often not highly differentially expressed on their own (Chuang et al. 2007; Fujita et al. 2008).
Signatures validate poorly on other data sets
One of the most important contributions of HTP biology to cancer research has been to develop prognostic and predictive signatures. Unfortunately, many signatures have failed to validate by other methods or in new cohorts of patients (Lau et al. 2007; Zhu et al. 2008). Obviously, this is a great concern for personalized medicine. Existing prognostic and predictive biomarkers for the same condition overlap only partially, and the set of biomarker genes identified depends strongly on the subset of patients used to generate it (Ein-Dor et al. 2005). One study estimated that to achieve 50% overlap in prognostic gene sets for breast cancer patients would require several thousand samples (Ein-Dor et al. 2006). Several factors contribute to these problems, including: (1) diverse patients and heterogeneous tumors, (2) different profiling platforms, (3) diverse statistical and bioinformatics approaches to biomarker identification (Shedden et al. 2008), (4) an insufficient number of samples (Ein-Dor et al. 2006), and (5) the existence of multiple equivalent signatures (Boutros et al. 2009; Ein-Dor et al. 2005).
Volume
The pace of discovery is rapid, data are piling up, and annotations are changing all the time. We need integrated workflows to organize data sets and make them easy to access, incorporate, annotate and update.
Large amounts of data need to be integrated and maintained
There are several examples of the rapid increase of knowledge and data. The Gene Expression Omnibus (GEO) currently contains over 490,000 microarray samples (Edgar et al. 2002). Roughly 100 cancer genomes have been sequenced so far—most of these just within the past year—and several major projects are underway, which should see that number quickly increase. For instance, the International Cancer Genome Consortium (ICGC) plans to sequence 500 tumors from each of 50 different cancers (Hudson et al. 2010), and the Cancer Genome Atlas (TCGA) will sequence more than 20 different tumor types in the next 5 years (Ledford 2010). Between 2008 and 2010, the number of papers published per year containing in their abstracts “cancer genome”, “personalized medicine”, and “whole AND genome AND sequencing” have roughly doubled, and “cancer AND signature” has shown a 50% increase (Fig. 1) [data generated using MEDSUM (Galsworthy 2009)].
Fig. 1.
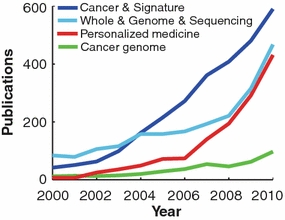
The rapid accumulation of personalized medicine publications. Counts of associated publications from the last 10 years for several personalized medicine search terms, retrieved with MEDSUM. Year is shown on the x-axis and publication count on the y-axis. The search term “cancer AND signature” is shown in blue; “whole AND genome AND sequencing” in turquoise; “personalized medicine” in red; and “cancer genome” in green
Many disease-related targets remain uncharacterized
Many disease-related targets remain uncharacterized; we have little or no information about their protein interaction partners, the pathways they control or are affected by, or their splice variants, functional mutations, or protein structure. For example, while there are roughly 21,000 genes in the human genome (Clamp et al. 2007), the Reactome and KEGG Pathway databases contain pathway annotations for only about 4,000 of these (Kanehisa et al. 2008; Matthews et al. 2009). And while many studies have shown that interaction networks provide information that can substantially improve predictive signatures (Chuang et al. 2007; Fortney et al. 2010; Nibbe et al. 2010), they can do so only for genes represented in the interactome.
We used the I2D interaction database (Brown and Jurisica 2005, 2007; Niu et al. 2010), to investigate how many cancer-associated genes remain uncharacterized in terms of their protein interactions, combining known interactions and interologs (interactions in other species that are transferred to humans via orthology). For instance, if we consider cancer genes with fewer than 5 interactions to be uncharacterized [this is unlikely to be their true connectivity, because cancer proteins are typically network hubs (Jonsson and Bates 2006)], then we identify 19% of genes in the Sanger Cancer Gene Census [SCGC; (Futreal et al. 2004)] and 47% of the genes in Online Mendelian Inheritance in Man [OMIM; (Hamosh et al. 2005)] as uncharacterized (Fig. 2). Looking at genes in the Cancer Data Integration Portal (CDIP) that are implicated in cancer by at least two studies, we find similar numbers; 42% of genes associated with prostate cancer, 31% of genes associated with ovarian cancer, and 24% of genes associated with lung cancer are uncharacterized. Interestingly, even though lung cancer is represented by a much smaller set of genes in CDIP—only 1,232 genes, versus 5,575 for ovarian and 9,803 for prostate cancer—it shows a roughly comparable proportion of uncharacterized genes across different interaction cut-offs (Fig. 2).
Fig. 2.
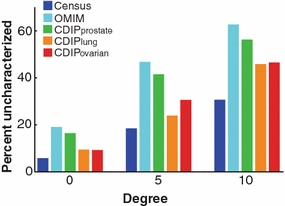
Many cancer-implicated genes remain uncharacterized. Percentages of known disease genes (y-axis) with zero, fewer than 5, or fewer than 10 known protein interactions (x-axis) in I2D version 1.85 (provided in Supplementary File 1). A large percentage of disease genes from the Sanger Cancer Gene Census (blue) and Online Mendelian Inheritance in Man (turquoise) remain uncharacterized. Similar results hold for genes implicated in prostate (green), lung (orange), and ovarian (red) cancers by two or more studies, as retrieved from the Cancer Data Integration Portal
The human interactome is poorly characterized
PPI networks provide biological context and meaning for gene signatures and yield better network-based prognostic and predictive signatures. Unfortunately, with current experimental knowledge the coverage of the human interactome is only around 13%. The human interactome is estimated to have around 650,000 interactions (Stumpf et al. 2008), and currently there are only 82,857 unique experimentally derived interactions (and an additional 55,471 unique interologous interactions) in I2D, a database that integrates HTP PPI data sets and most online PPI databases [such as BioGRID (Stark et al. 2006), BIND (Bader et al. 2003), DIP (Xenarios et al. 2000), HPRD (Peri et al. 2004), InnateDB (Lynn et al. 2008); IntAct (Hermjakob et al. 2004) and MINT (Zanzoni et al. 2002)]. While HTP methods can help to identify many protein interactions, their overlap is usually low, and even when combined were shown to result in a false negative rate of around 41% (Braun et al. 2009). Interaction dynamics with respect to time and localization remain largely unknown. Also, though over 92% of human genes have splice variants (Wang et al. 2008), and many genes may have hundreds or even thousands of such variants [for instance, the Drospohila gene Dscam may have over 38,000 alternative splice forms (Schmucker et al. 2000)], we still lack information about most variant-specific interactions.
How integrative computational biology can address these challenges
The field of integrative computational biology uses techniques from computer science, mathematics, physics and engineering to comprehensively analyze and interpret biological data. Through the creation of new analysis and visualization methods, software tools and databases, it can help diminish the challenges to HTP cancer biology. Here we present some successful applications of integrative computational biology to cancer research. These applications fall into four main categories: data integration, network analysis, databases, and standards.
Data integration
As we have seen, noise in HTP cancer studies can arise both from biological and technological variability. One of the most effective strategies for reducing both types of noise is data integration. The idea is simple: we can be more confident about the result of an experiment if similar experiments yielded similar results. We can integrate different experiments that measure the same biological entity, such as microarray studies measuring tumor versus normal gene expression differences on different experimental platforms. We can also integrate different data types, such as mutation, expression, and proteomic data. Clearly, data integration can increase our confidence in results that are consistent across multiple studies and experimental modalities. But data integration can also increase sensitivity, since different platforms and methods exhibit different biases—e.g., some protein interactions may be undetectable by some methods. Integrative computational approaches can also be complemented by better experimental design: e.g., in tumor profiling, analyzing multiple samples from the same patient reduces the effect of intra-tumor heterogeneity (Bachtiary et al. 2006; Blackhall et al. 2004), and executing multiple MudPIT (Multi-dimensional Protein Identification Technology) runs significantly improves sensitivity (Gortzak-Uzan et al. 2008; Kislinger and Emili 2005; Sodek et al. 2008; Wei et al. 2011).
Integrating the same type of data across multiple platforms and studies
With microarray and similar data, small sample numbers and different experimental platforms can lead to highly variable results. These problems can be addressed by combining data from different studies and platforms, which increases the effective number of samples and helps control for inter-platform heterogeneity.
Most approaches to integrating microarray data can be divided into two general classes, pooling and meta-analyses. In pooling, multiple expression data sets are merged into a single data set (van Vliet et al. 2008; Warnat et al. 2005); typically, gene measurements from each separate study are transformed before pooling to make the experiments more comparable (Fierro et al. 2008). Previous work found that pooling six breast cancer data sets (over 900 samples in total) yielded better-performing signatures (van Vliet et al. 2008). In contrast, for a meta-analysis, statistics are computed for each data set separately and then combined. Meta-analyses identify gene changes that are seen consistently across many studies (Rhodes and Chinnaiyan 2005). Several cancer-specific databases gather information from multiple studies to facilitate meta-analysis, including Oncomine (Rhodes et al. 2007), GeneSigDB (Culhane et al. 2010), and CDIP. CDIP currently covers lung, ovarian, prostate and head and neck cancers. For example, for prostate cancer, CDIP contains 119 different microarray analyses with over 850 tumor and normal samples. While 12,975 unique genes are significantly differentially regulated in at least one study, far fewer show this trend across multiple studies and we can use this information to prioritize genes, both for biological validation and for signature generation.
Integrating different types of data
Integrating complementary data from different sources is helpful for reducing noise and prioritizing targets (Gortzak-Uzan et al. 2008; Varambally et al. 2005). For example, Gortzak-Uzan et al. (2008) combined proteins identified in ovarian cancer ascites with differentially expressed genes from CDIP and PPIs from I2D to identify putative biomarkers for early ovarian cancer detection in serum. For target prioritization, prognostic and predictive signatures can be put in their biological context by overlapping and expanding them with data from cancer-specific resources such as the Sanger Census database (Bamford et al. 2004; Stratton et al. 2009), the COSMIC catalog of somatic mutations (Bamford et al. 2004), GeneSigDB, and Oncomine. Techniques such as Gene Set Enrichment Analysis (GSEA) (Subramanian et al. 2005) can be used to combine experimental data with annotation and pathway databases such as the Gene Ontology (Ashburner et al. 2000), KEGG, and Reactome which allows us to convert lists of differentially expressed genes into lists of differentially expressed gene groups, which are more stable across studies (Subramanian et al. 2005).
Integrating data to predict new PPIs
Protein networks are essential for cancer signature design and interpretation (Chuang et al. 2007; Ergun et al. 2007; Rhodes and Chinnaiyan 2005), yet current experimental networks are far from complete, contain false positives, and in general lack context, such as condition, place and strength of individual interactions. Biological techniques can also be enriched by in silico approaches to predict new interactions and the context of existing ones. For example, we recently developed FpClass (Kotlyar and Jurisica 2006; Kotlyar et al. 2011), an association mining algorithm that greatly expands coverage of the human proteome without increasing false discovery rate: it predicts 178,738 new high-accuracy interactions for 9,372 proteins. FpClass integrates many different data types to predict interactions, including sequence, domains, gene expression, and post-translational modifications. Importantly, FpClass reduces the number of uncharacterized disease genes (again, where a gene is considered uncharacterized if its protein product participates in fewer than 5 interactions, see Fig. 2) to 34% for OMIM and 11% for SCGC.
Integrating data to predict disease gene function
Though many cancer-related genes remain uncharacterized, HTP data and in silico methods can be applied to assign them putative functions (Hu et al. 2007). For example, in the successful MouseFunc prediction challenge (Pena-Castillo et al. 2008), teams of scientists competed to predict mouse gene function (Gene Ontology categories) on the basis of several different data sources, including expression, sequence, interactions, phenotype annotations, disease associations and phylogenetic profiles. Computational methods for predicting the function of uncharacterized cancer genes have been previously reviewed in (Hu et al. 2007).
Network analysis
Network approaches have been successful in addressing some of the analysis-based challenges of HTP cancer biology. Genes do not act in isolation; they form highly complex and interlinked molecular networks. Examining genes in the context of these networks can yield valuable clues about their function and relations, and expand our knowledge of individual cancer pathways and their cross-talk (Agarwal et al. 2009; Mills et al. 2009). Despite the noise in current protein interaction data sets, network analysis can uncover biologically relevant information, such as lethality (Hahn and Kern 2005; Jeong et al. 2001), functional organization (Gavin et al. 2002; Maslov and Sneppen 2002; Wuchty 2006), hierarchical structure (Ravasz et al. 2002; Yu et al. 2006), modularity (Han et al. 2004) and network-building motifs (Milo et al. 2002; Przulj et al. 2006; Rice et al. 2005). Three important applications of protein networks to cancer research include signature generation, signature interpretation, and disease gene prediction.
Networks for signature generation
By integrating network information with gene expression data, we can identify predictive signatures that perform better and are more conserved across studies than signatures based on gene expression data alone. There are many ways of using networks to create improved gene signatures. One class of methods that has proven very successful is score-based subnetwork biomarkers (Chuang et al. 2007; Fortney et al. 2010; Hwang et al. 2009; Ideker et al. 2002; Nacu et al. 2007). In these approaches, genes are aggregated around an initial “seed” gene in a network to generate subnetworks whose pooled activity levels can be used to predict the value of some response variable, such as disease status or survival time. Subnetworks identified using this approach were shown to be highly conserved across studies, and to perform better than individual genes or pre-defined gene groups at predicting breast cancer metastasis (Chuang et al. 2007). Importantly, many crucial genes belonging to subnetwork biomarkers were not differentially expressed on their own, demonstrating the added value of a network approach. Related approaches have been used to develop subnetwork biomarkers for colon cancer using a combination of proteome and transcriptome data (Nibbe et al. 2009, 2010).
Networks for signature interpretation
Many genes that play a role in predictive signatures have not been previously linked to cancer, and thus can be considered as novel candidate cancer genes. Networks can be used to link these genes with known cancer mechanisms and pathways (Radulovich et al. 2010; Rhodes et al. 2005; Sodek et al. 2008; Tomasini et al. 2008). Gene signatures mapped to protein interactions can be further annotated with other profiles (including proteomic, CGH, and miRNA studies), and with network structures, such as graphlets (Przulj 2007; Przulj et al. 2006). Networks can also reveal new connections between different prognostic signatures. For example, we recently identified a 15-gene prognostic and predictive signature in lung cancer (Zhu et al. 2010a). Though our signature did not directly overlap with previously published ones, network analysis revealed that they were highly related: there were direct interactions between the protein products of genes from our signature and others. Similar results have been shown in other studies (Zhu et al. 2009, 2010b).
Networks for identifying new disease genes
Analyses of the network connectivity of cancer genes have shown that they can be characterized by several topological properties. For example, proteins encoded by cancer genes tend to be central in interaction networks [they have high degree and betweenness centrality (Jonsson and Bates 2006; Rambaldi et al. 2008; Syed et al. 2010)], have high clustering coefficients (Li et al. 2009), and are overrepresented in network motifs (Rambaldi et al. 2008). Several methods use the topological characteristics of known cancer genes, in combination with other features (such as Gene Ontology categories, protein domains, biological pathways, and sequence features), to predict new cancer genes (Aragues et al. 2008; Rambaldi et al. 2008) or functional SNPs (Savas et al. 2009). Many algorithms identify modules in interaction networks, or groups of densely interconnected genes that can be highly functionally related (King et al. 2004; Newman 2006; Palla et al. 2005; Spirin and Mirny 2003). Module-finding algorithms can also be applied to predict new disease genes (Chuang et al. 2007; Goh et al. 2007): clusters enriched for known cancer genes may implicate novel genes in cancer.
Generating context-specific co-expression networks from microarray data
Co-expression networks are distinct from PPI networks: instead of indicating physical interactions, edges (and edge weights) between genes reflect the degree of correlation of their expression profiles. Co-expression networks have also been useful in cancer research, e.g., (Aggarwal et al. 2006; Choi et al. 2005). For example, we can use microarray data from different health and disease conditions, such as cancer and non-cancer, to create networks specific to those contexts. We can then compare the networks using a variety of measures that reflect local and global network structure, such as graphlets (Przulj et al. 2006), communities (Palla et al. 2005), etc. Weighted Gene Co-expression Network Analysis (WCGNA) (Zhang and Horvath 2005), a popular method for generating and interpreting co-expression networks, has been applied to study prostate cancer (Wang et al. 2009) and glioblastoma (Horvath et al. 2006).
Databases and visualization
Integrated and updated tools and resources can help to deal with the large volume of HTP biological data being generated, as well as facilitate integrative analyses of cancer profiles. Integrative databases fulfill several essential functions; for instance, they organize heterogeneous and distributed data sources and make them easy to use, and they update and reinterpret old data in the light of new findings (e.g., updated probe set mappings for a microarray platform). For example, the I2D database integrates HTP-detected PPIs with PPIs from several source databases. Tens of thousands of these I2D PPIs are unique to a single source database (Fig. 3); integrating these different sources both substantially improves coverage and increases confidence for those interactions present in multiple sources. Importantly, to support HTP data analysis, databases and portals need to support multiple identifiers and batch processing. Both databases and network visualization methods have played essential roles in interpreting HTP biological data and cancer signatures.
Fig. 3.
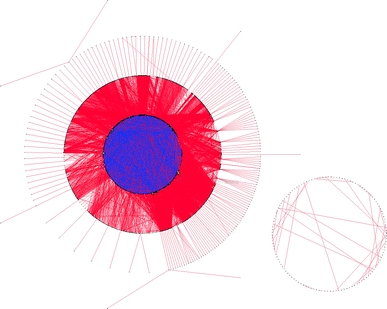
The value of data integration: I2D, the Interologous Interaction Database. Experimentally derived human interactions from I2D version 1.85; the network comprises 13,190 proteins connected by 82,857 interactions. Interactions unique to a single source or database are rendered as red (covering 11,781 proteins and 49,440 interactions), and interactions present in two or more sources are colored blue. Node color and size are proportional to degree. Visualization and annotation of the network was performed in NAViGaTOR ver. 2.2.1. Network file with GO and PubMed annotation is available as Supplemental File 2, in NAViGaTOR 2.2 XML format
Integrating heterogeneous and distributed data sources
Different data sources can be complementary. For instance, while biological pathway databases may disagree on individual pathway definitions, by combining them we can diminish their false positives and false negatives; by integrating pathways with protein interactions, we can improve their coverage and relevance (Radulovich et al. 2010; Savas et al. 2009). Having all of these data available from a single source or at least in a standardized format simplifies integrative analyses and reduces the error and database incompatibility (arising from, e.g., inconsistent gene nomenclature). One example is CDIP (Gortzak-Uzan et al. 2008), a cancer informatics portal that combines HTP data from microarrays, CGH, KEGG, I2D, annotations from GeneCards (Rebhan et al. 1997), and other molecular information specific to different cancer types. Another is mirDIP (Shirdel et al. 2011), a microRNA integration portal that combines computational predictions of microRNA: mRNA binding from multiple databases (version 1 combines 11 largest sources).
Updating old data to reflect the latest knowledge
In part because of the noise inherent in HTP platforms, our best knowledge of what they are measuring and how their data should be interpreted changes with time. Past work has shown that using updated transcript data to re-annotate the assignment of microarray probe sets to genes provided for Affymetrix microarray platforms affected 20–30% of all probe sets (Gautier et al. 2004). Updated probe set definitions lead to higher precision and accuracy (Sandberg and Larsson 2007), and more consistent results across different microarray platforms (Carter et al. 2005; Elo et al. 2005). The Ensembl database (Hubbard et al. 2009) maintains and regularly updates a list of probeset mappings for many popular microarray platforms.
Visualizing biological networks
Tools like Cytoscape (Shannon et al. 2003) and NAViGaTOR (Brown et al. 2009; McGuffin and Jurisica 2009; Viau et al. 2010) allow biologists to visualize protein interactions and perform network analyses using an intuitive graphical interface, and have been widely used for cancer signature interpretation and development. Effective network visualization tools integrate several relevant resources; e.g., NAViGaTOR users can choose to supplement and annotate network nodes and edges with additional data from several sources including I2D PPIs, PSICQUIC (Orchard et al. 2010), STRING (Szklarczyk et al. 2011), Gene Ontology categories, and KEGG, PhosphoSite (Hornbeck et al. 2004), PathwayCommons (Cerami et al. 2011), Reactome, WikiPathways (Pico et al. 2008) biological pathways, and i-HOP (Hoffmann and Valencia 2005). NAViGaTOR also provides tools for network analysis, including several measures of centrality, methods for identifying motifs and communities, and random network and enrichment analysis. Different visualization tools can yield different and complementary biological information; Fig. 4 shows three alternative visualizations of MAPK3 using pathway databases and PPIs in NAViGaTOR. The MAP kinase signaling cascade is implicated in tumor growth and may be a key anti-cancer drug target (Roberts and Der 2007; Sebolt-Leopold and Herrera 2004).
Fig. 4.
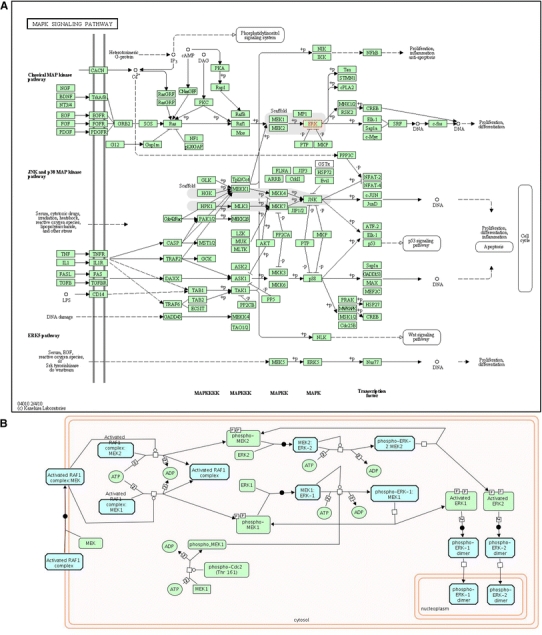
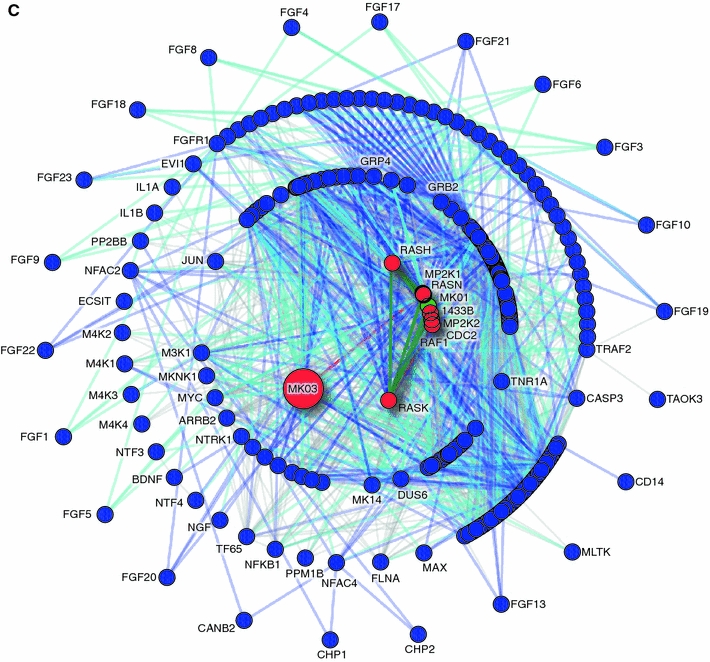
Different databases offer different and complementary perspectives on the same data. Querying different databases for the same gene, MAPK3 (with protein product MK03), results in pathway-related data with different structure and organization. Pathway data can be supplemented with protein–protein interaction data to provide more complete networks. a From KEGG (release 57.0), the MAPK signaling pathway (PATHWAY:hsa04010). b From Reactome (version 35), the MAP Kinase Cascade (REACT_634). c Protein–protein interaction network from I2D version 1.85, displayed in NAViGaTOR 2.2.1, and overlaid with pathway data from a and b. Nodes represent proteins unique to hsa04010 (blue), proteins unique to REACT_634 (green), and proteins present in both pathways (red). Edges represent links unique to hsa04010 (dark blue), REACT_634 (dark green), I2D (gray), or present in both hsa04010 and I2D (light blue), or REACT_634 and I2D (light green). The concentric circle layout uses Reactome nodes as a center, and organizes remaining nodes based on local connectivity
Web services for frequent updates
One of the main challenges faced by integrated databases is staying current: the knowledge and data in the source databases are changing all the time. Fortunately, many source databases provide access to their content through web services. Integrated databases and analysis tools can then query these databases in response to a user request and access the latest data. For example, NAViGaTOR uses web services to access pathway data from KEGG, Reactome, Pathway Commons (Cerami et al. 2011) and Wiki pathways (Pico et al. 2008), protein interactions from the IMEx consortium (Orchard et al. 2007), and protein interactions and gene associations via i-HOP (Hoffmann and Valencia 2005) or STRING. Of course, not every relevant data set can be accessed through web services; a list of web services currently available is provided by the EMBRACE Registry (Pettifer et al. 2009).
Text mining for automated database annotation and quality-checking
Many of the data and observations gained from biological experiments are not available in an easily accessible form—they are buried in the text of journal articles. But techniques from text mining can be used to automatically extract biological knowledge from free text; these have been extensively reviewed in, e.g., (Altman et al. 2008; Cohen and Hunter 2008; Hoffmann et al. 2005; Jensen et al. 2006; Rodriguez-Esteban 2009). For integrated databases, text mining methods have proven especially valuable for automatically annotating and quality-checking HTP data. For example, text mining has been applied to annotate the I2D PPI database (Niu et al. 2010) and to verify predicted PPIs from FpClass (Kotlyar et al. 2011). Text mining can also supplement integrated databases with new knowledge; e.g., by extracting gene-drug relationships (Kuhn et al. 2010; von Eichborn et al. 2011).
Standards and recommendations
Progress in HTP research relies on well-designed and widely adopted standards for how data is produced, managed, and analyzed. These provide a consistent way of dealing with large volumes of data, help reduce noise, and ensure reproducibility at both the experimental and computational levels.
Standards for HTP data and tools
Different research groups, databases, and analyses must use consistent reporting standards so their data can be effectively shared, integrated, and evaluated. In cancer research, standards are needed at several levels of data collection and analysis, from tumor collection, storage, and sample preparation to pre-processing and further computational study of the resulting HTP data.
For many HTP data types, there are now well-developed standards for data reporting, such as Minimum Information About a Microarray Experiment [MIAME (Brazma et al. 2001)] and large public repositories for raw data, such as the GEO (Barrett et al. 2005) and the PRoteomics IDEntifications database [PRIDE (Jones et al. 2006)]. Data standards development is an ongoing area of research, and has been extensively reviewed (Brazma et al. 2006; Brooksbank and Quackenbush 2006; Enkemann 2010). Some outstanding issues include data identifiers—e.g., the many-to-many mappings between genes from databases like EntrezGene and Ensembl—and open access to data. Though many high-impact journals now mandate that all HTP data and code associated with a publication be made open-access, this requirement is not universal, and sometimes the same journal will require microarray data submission, but not proteomic data. Also, many articles that do publish their data too frequently make them available only in an impractical form—such as hundreds of pages in supplementary PDF files. We need new initiatives to standardize (and enforce) HTP data submission formats to ensure that they are machine-readable. This will enable wider use of data and new discoveries, and may also substantially improve quality of research by reducing errors and mistakes (Baggerly and Coombes 2009; Carey and Stodden 2010).
For computational data analysis, we also need large-scale comparisons to provide a fair evaluation of different methods. In cancer research, these efforts depend on resources like GeneSigDB (Culhane et al. 2010), a curated database containing over 2,000 cancer gene signatures, and large well-annotated data sets such as the set of gene expression profiles for over 400 non-small cell lung cancer adenocarcinoma tumors provided by the Director’s Challenge Consortium for the Molecular Classification of Lung Adenocarcinoma (Shedden et al. 2008). New initiatives such as TCGA and ICGC are expanding cancer profiles across multiple different platforms and tumor types. Making the data and related clinical information publicly available will significantly contribute to our understanding of the molecular changes in cancer, enabling new discoveries as well as more comprehensive validation of novel prognostic and predictive signatures.
Recommendations for biological experiments
The quality of any computational analysis is limited by the data that are available. Considering intra- and inter-tumor heterogeneity, we may sometimes have too few samples or too much noise to be able to develop cancer signatures with the required accuracy and reproducibility. In this case, computational analyses of the available data can at least provide guidelines as to the kinds of experiments and data that are needed. For example, one study estimated that to achieve 50% overlap in prognostic gene sets for breast cancer patients would require several thousand samples (Ein-Dor et al. 2006), and other work created a general tool to calculate the number of samples needed to train a classifier as a function of normalized fold change, class prevalence, and the number of genes on an array (Dobbin et al. 2008). Much of the human PPI network, including PPIs of known cancer genes, remains uncharacterized. Past work shows that a reliable confidence score can be associated with an interaction by feeding the output of four different complementary HTP assays into a logistic regression model (Braun et al. 2009). Also, high-confidence PPIs predicted by various computational methods can focus future experiments and reduce their false positives and false negatives (Kotlyar and Jurisica 2006; Kotlyar et al. 2011).
A directory of tools and resources for integrative computational cancer biology
Below is a brief directory of links to some of the major resources for integrative computational biology that appear in this review.
Biological pathway annotations and related data
Reactome http://www.reactome.org/
Pathway Commons http://www.pathwaycommons.org/pc/
KEGG PATHWAY—Kyoto Encyclopedia of Genes and Genomes http://www.genome.jp/kegg/pathway.html
WikiPathways http://www.wikipathways.org/
GO—Gene Ontology http://www.geneontology.org/
Experimental data
Protein–protein interactions
I2D—Interologous Interaction Database http://ophid.utoronto.ca/i2d/
STRING—Search Tool for the Retrieval of Interacting Genes http://string-db.org/
BioGRID—Biological General Repository for Interaction Datasets http://thebiogrid.org/
HPRD—Human Protein Reference Database http://www.hprd.org/
MINT—Molecular INTeraction Database http://mint.bio.uniroma2.it/
IMEx—International Molecular Exchange Consortium http://www.imexconsortium.org/
Gene expression
CDIP—Cancer Data Integration Portal http://ophid.utoronto.ca/cdip
Oncomine https://www.oncomine.org/
ArrayExpress http://www.ebi.ac.uk/arrayexpress/
GEO—Gene Expression Omnibus http://www.ncbi.nlm.nih.gov/geo/
Mutations
Sanger Cancer Gene Census http://www.sanger.ac.uk/genetics/CGP/Census/
COSMIC—Catalogue of Somatic Mutations in Cancer http://www.sanger.ac.uk/resources/databases/cosmic.html
Proteomics
PRIDE—PRoteomics IDEntifications database http://www.ebi.ac.uk/pride/
PhosphoSite http://www.phosphosite.org/
microRNAs
mirDIP—microRNA Data Integration Portal http://ophid.utoronto.ca/mirDIP
Network visualization software
NAViGaTOR—Network Analysis, Visualization, & Graphing TORonto http://ophid.utoronto.ca/navigator/
Cytoscape http://www.cytoscape.org/
Gene function prediction
GeneMania http://genemania.org/
Cancer genome initiatives
TCGA—The Cancer Genome Atlas http://cancergenome.nih.gov/
ICGC—International Cancer Genome Consortium http://www.icgc.org/
Electronic supplementary material
Below is the link to the electronic supplementary material.
I2D interaction database, version 1.85. A tab-delimited file of protein interactions and their source databases. (TXT 5,794 kb)
Protein–protein interaction network from Figure 3. In NAViGaTOR 2.2 XML file format. (XML 150,401 kb)
Acknowledgments
This work was supported in part by Ontario Research Fund (GL2-01-030), Canada Institutes for Health Research (BIO-99745), the Canada Foundation for Innovation (CFI #12301 and #203383), the Canada Research Chair Program, and IBM to IJ, and the Ontario Ministry of Health and Long Term Care. The views expressed do not necessarily reflect those of the OMOHLTC. We thank M. Kotlyar, A. Hrvojic, A. Teisanu, and W. Xie for providing data for the figures.
Open Access
This article is distributed under the terms of the Creative Commons Attribution Noncommercial License which permits any noncommercial use, distribution, and reproduction in any medium, provided the original author(s) and source are credited.
References
- Agarwal R, Gonzalez-Angulo AM, Myhre S, Carey M, Lee JS, Overgaard J, Alsner J, Stemke-Hale K, Lluch A, Neve RM, Kuo WL, Sorlie T, Sahin A, Valero V, Keyomarsi K, Gray JW, Borresen-Dale AL, Mills GB, Hennessy BT. Integrative analysis of cyclin protein levels identifies cyclin b1 as a classifier and predictor of outcomes in breast cancer. Clin Cancer Res. 2009;15:3654–3662. doi: 10.1158/1078-0432.CCR-08-3293. [DOI] [PMC free article] [PubMed] [Google Scholar]
- Aggarwal A, Guo DL, Hoshida Y, Yuen ST, Chu KM, So S, Boussioutas A, Chen X, Bowtell D, Aburatani H, Leung SY, Tan P. Topological and functional discovery in a gene coexpression meta-network of gastric cancer. Cancer Res. 2006;66:232–241. doi: 10.1158/0008-5472.CAN-05-2232. [DOI] [PubMed] [Google Scholar]
- Altman RB, Bergman CM, Blake J, Blaschke C, Cohen A, Gannon F, Grivell L, Hahn U, Hersh W, Hirschman L, Jensen LJ, Krallinger M, Mons B, O’Donoghue SI, Peitsch MC, Rebholz-Schuhmann D, Shatkay H, Valencia A. Text mining for biology—the way forward: opinions from leading scientists. Genome Biol. 2008;9(Suppl 2):S7. doi: 10.1186/gb-2008-9-s2-s7. [DOI] [PMC free article] [PubMed] [Google Scholar]
- Aragues R, Sander C, Oliva B. Predicting cancer involvement of genes from heterogeneous data. BMC Bioinformatics. 2008;9:172. doi: 10.1186/1471-2105-9-172. [DOI] [PMC free article] [PubMed] [Google Scholar]
- Ashburner M, Ball CA, Blake JA, Botstein D, Butler H, Cherry JM, Davis AP, Dolinski K, Dwight SS, Eppig JT, Harris MA, Hill DP, Issel-Tarver L, Kasarskis A, Lewis S, Matese JC, Richardson JE, Ringwald M, Rubin GM, Sherlock G. Gene ontology: tool for the unification of biology. The Gene Ontology Consortium. Nat Genet. 2000;25:25–29. doi: 10.1038/75556. [DOI] [PMC free article] [PubMed] [Google Scholar]
- Auffray C, Chen Z, Hood L. Systems medicine: the future of medical genomics and healthcare. Genome Med. 2009;1:2. doi: 10.1186/gm2. [DOI] [PMC free article] [PubMed] [Google Scholar]
- Augen J (2001) Information technology to the rescue! Nat Biotechnol 19 Suppl: BE39–40 [DOI] [PubMed]
- Axelrod DE, Miller N, Chapman JA. Avoiding pitfalls in the statistical analysis of heterogeneous tumors. Biomed Inform Insights. 2009;2:11–18. doi: 10.4137/bii.s2222. [DOI] [PMC free article] [PubMed] [Google Scholar]
- Bachtiary B, Boutros PC, Pintilie M, Shi W, Bastianutto C, Li JH, Schwock J, Zhang W, Penn LZ, Jurisica I, Fyles A, Liu FF. Gene expression profiling in cervical cancer: an exploration of intratumor heterogeneity. Clin Cancer Res. 2006;12:5632–5640. doi: 10.1158/1078-0432.CCR-06-0357. [DOI] [PubMed] [Google Scholar]
- Bader GD, Betel D, Hogue CW. BIND: the Biomolecular Interaction Network Database. Nucleic Acids Res. 2003;31:248–250. doi: 10.1093/nar/gkg056. [DOI] [PMC free article] [PubMed] [Google Scholar]
- Baggerly KA, Coombes KR. Deriving chemosensitivity from cell lines: forensic bioinformatics and reproducible research in high-throughput biology. Ann Appl Stat. 2009;3:1309–1334. [Google Scholar]
- Bamford S, Dawson E, Forbes S, Clements J, Pettett R, Dogan A, Flanagan A, Teague J, Futreal PA, Stratton MR, Wooster R. The COSMIC (Catalogue of Somatic Mutations in Cancer) database and website. Br J Cancer. 2004;91:355–358. doi: 10.1038/sj.bjc.6601894. [DOI] [PMC free article] [PubMed] [Google Scholar]
- Barnes M, Freudenberg J, Thompson S, Aronow B, Pavlidis P. Experimental comparison and cross-validation of the Affymetrix and Illumina gene expression analysis platforms. Nucleic Acids Res. 2005;33:5914–5923. doi: 10.1093/nar/gki890. [DOI] [PMC free article] [PubMed] [Google Scholar]
- Barrett T, Suzek TO, Troup DB, Wilhite SE, Ngau WC, Ledoux P, Rudnev D, Lash AE, Fujibuchi W, Edgar R. NCBI GEO: mining millions of expression profiles—database and tools. Nucleic Acids Res. 2005;33:D562–D566. doi: 10.1093/nar/gki022. [DOI] [PMC free article] [PubMed] [Google Scholar]
- Bell AW, Deutsch EW, Au CE, Kearney RE, Beavis R, Sechi S, Nilsson T, Bergeron JJ. A HUPO test sample study reveals common problems in mass spectrometry-based proteomics. Nat Methods. 2009;6:423–430. doi: 10.1038/nmeth.1333. [DOI] [PMC free article] [PubMed] [Google Scholar]
- Blackhall FH, Pintilie M, Wigle D, Jurisica I, Liu N, Radulovitch N, Keshavjee S, Johnston M, Shepherd FA, Tsao M-S. Stability and heterogeneity of expression profiles in lung cancer specimens harvested following surgical resection. Neoplasia. 2004;6:761–767. doi: 10.1593/neo.04301. [DOI] [PMC free article] [PubMed] [Google Scholar]
- Boutros PC, Lau SK, Pintilie M, Liu N, Shepherd FA, Der SD, Tsao MS, Penn LZ, Jurisica I. Prognostic gene signatures for non-small-cell lung cancer. Proc Natl Acad Sci USA. 2009;106:2824–2828. doi: 10.1073/pnas.0809444106. [DOI] [PMC free article] [PubMed] [Google Scholar]
- Braun P, Tasan M, Dreze M, Barrios-Rodiles M, Lemmens I, Yu H, Sahalie JM, Murray RR, Roncari L, de Smet AS, Venkatesan K, Rual JF, Vandenhaute J, Cusick ME, Pawson T, Hill DE, Tavernier J, Wrana JL, Roth FP, Vidal M. An experimentally derived confidence score for binary protein–protein interactions. Nat Methods. 2009;6:91–97. doi: 10.1038/nmeth.1281. [DOI] [PMC free article] [PubMed] [Google Scholar]
- Brazma A, Hingamp P, Quackenbush J, Sherlock G, Spellman P, Stoeckert C, Aach J, Ansorge W, Ball CA, Causton HC, Gaasterland T, Glenisson P, Holstege FC, Kim IF, Markowitz V, Matese JC, Parkinson H, Robinson A, Sarkans U, Schulze-Kremer S, Stewart J, Taylor R, Vilo J, Vingron M. Minimum information about a microarray experiment (MIAME)—toward standards for microarray data. Nat Genet. 2001;29:365–371. doi: 10.1038/ng1201-365. [DOI] [PubMed] [Google Scholar]
- Brazma A, Krestyaninova M, Sarkans U. Standards for systems biology. Nat Rev Genet. 2006;7:593–605. doi: 10.1038/nrg1922. [DOI] [PubMed] [Google Scholar]
- Brooksbank C, Quackenbush J. Data standards: a call to action. OMICS. 2006;10:94–99. doi: 10.1089/omi.2006.10.94. [DOI] [PubMed] [Google Scholar]
- Brown KR, Jurisica I. Online predicted human interaction database. Bioinformatics. 2005;21:2076–2082. doi: 10.1093/bioinformatics/bti273. [DOI] [PubMed] [Google Scholar]
- Brown KR, Jurisica I. Unequal evolutionary conservation of human protein interactions in interologous networks. Genome Biol. 2007;8:R95. doi: 10.1186/gb-2007-8-5-r95. [DOI] [PMC free article] [PubMed] [Google Scholar]
- Brown KR, Otasek D, Ali M, McGuffin M, Xie W, Devani B, van Toch IL, Jurisica I. NAViGaTOR: Network Analysis, Visualization and Graphing Toronto. Bioinformatics. 2009;25:3327–3329. doi: 10.1093/bioinformatics/btp595. [DOI] [PMC free article] [PubMed] [Google Scholar]
- Buyse M, Loi S, van’t Veer L, Viale G, Delorenzi M, Glas AM, d’Assignies MS, Bergh J, Lidereau R, Ellis P, Harris A, Bogaerts J, Therasse P, Floore A, Amakrane M, Piette F, Rutgers E, Sotiriou C, Cardoso F, Piccart MJ (2006) Validation and clinical utility of a 70-gene prognostic signature for women with node-negative breast cancer. J Natl Cancer Inst 98: 1183–92 [DOI] [PubMed]
- Carey VJ, Stodden V. Reproducible research concepts and tools for cancer bioinformatics. In: Ochs MF, Cassagrande JT, Davuluri RV, editors. Biomedical informatics for cancer research. US: Springer; 2010. pp. 149–175. [Google Scholar]
- Carter SL, Eklund AC, Mecham BH, Kohane IS, Szallasi Z. Redefinition of Affymetrix probe sets by sequence overlap with cDNA microarray probes reduces cross-platform inconsistencies in cancer-associated gene expression measurements. BMC Bioinformatics. 2005;6:107. doi: 10.1186/1471-2105-6-107. [DOI] [PMC free article] [PubMed] [Google Scholar]
- Cerami EG, Gross BE, Demir E, Rodchenkov I, Babur O, Anwar N, Schultz N, Bader GD, Sander C. Pathway Commons, a web resource for biological pathway data. Nucleic Acids Res. 2011;39:D685–D690. doi: 10.1093/nar/gkq1039. [DOI] [PMC free article] [PubMed] [Google Scholar]
- Cervigne NK, Reis PP, Machado J, Sadikovic B, Bradley G, Galloni NN, Pintilie M, Jurisica I, Perez-Ordonez B, Gilbert R, Gullane P, Irish J, Kamel-Reid S. Identification of a microRNA signature associated with progression of leukoplakia to oral carcinoma. Hum Mol Genet. 2009;18:4818–4829. doi: 10.1093/hmg/ddp446. [DOI] [PubMed] [Google Scholar]
- Chandran UR, Dhir R, Ma C, Michalopoulos G, Becich M, Gilbertson J. Differences in gene expression in prostate cancer, normal appearing prostate tissue adjacent to cancer and prostate tissue from cancer free organ donors. BMC Cancer. 2005;5:45. doi: 10.1186/1471-2407-5-45. [DOI] [PMC free article] [PubMed] [Google Scholar]
- Choi JK, Yu U, Yoo OJ, Kim S. Differential coexpression analysis using microarray data and its application to human cancer. Bioinformatics. 2005;21:4348–4355. doi: 10.1093/bioinformatics/bti722. [DOI] [PubMed] [Google Scholar]
- Chuang HY, Lee E, Liu YT, Lee D, Ideker T. Network-based classification of breast cancer metastasis. Mol Syst Biol. 2007;3:140. doi: 10.1038/msb4100180. [DOI] [PMC free article] [PubMed] [Google Scholar]
- Clamp M, Fry B, Kamal M, Xie X, Cuff J, Lin MF, Kellis M, Lindblad-Toh K, Lander ES. Distinguishing protein-coding and noncoding genes in the human genome. Proc Natl Acad Sci USA. 2007;104:19428–19433. doi: 10.1073/pnas.0709013104. [DOI] [PMC free article] [PubMed] [Google Scholar]
- Cleator SJ, Powles TJ, Dexter T, Fulford L, Mackay A, Smith IE, Valgeirsson H, Ashworth A, Dowsett M. The effect of the stromal component of breast tumours on prediction of clinical outcome using gene expression microarray analysis. Breast Cancer Res. 2006;8:R32. doi: 10.1186/bcr1506. [DOI] [PMC free article] [PubMed] [Google Scholar]
- Cohen KB, Hunter L. Getting started in text mining. PLoS Comput Biol. 2008;4:e20. doi: 10.1371/journal.pcbi.0040020. [DOI] [PMC free article] [PubMed] [Google Scholar]
- Coleman MP, Quaresma M, Berrino F, Lutz JM, De Angelis R, Capocaccia R, Baili P, Rachet B, Gatta G, Hakulinen T, Micheli A, Sant M, Weir HK, Elwood JM, Tsukuma H, Koifman S, ES GA, Francisci S, Santaquilani M, Verdecchia A, Storm HH, Young JL. Cancer survival in five continents: a worldwide population-based study (CONCORD) Lancet Oncol. 2008;9:730–756. doi: 10.1016/S1470-2045(08)70179-7. [DOI] [PubMed] [Google Scholar]
- Culhane AC, Schwarzl T, Sultana R, Picard KC, Picard SC, Lu TH, Franklin KR, French SJ, Papenhausen G, Correll M, Quackenbush J. GeneSigDB—a curated database of gene expression signatures. Nucleic Acids Res. 2010;38:D716–D725. doi: 10.1093/nar/gkp1015. [DOI] [PMC free article] [PubMed] [Google Scholar]
- Curtis C, Lynch AG, Dunning MJ, Spiteri I, Marioni JC, Hadfield J, Chin SF, Brenton JD, Tavare S, Caldas C. The pitfalls of platform comparison: DNA copy number array technologies assessed. BMC Genomics. 2009;10:588. doi: 10.1186/1471-2164-10-588. [DOI] [PMC free article] [PubMed] [Google Scholar]
- Deisboeck TS, Zhang L, Yoon J, Costa J. In silico cancer modeling: is it ready for prime time? Nat Clin Pract Oncol. 2009;6:34–42. doi: 10.1038/ncponc1237. [DOI] [PMC free article] [PubMed] [Google Scholar]
- Dhanasekaran SM, Barrette TR, Ghosh D, Shah R, Varambally S, Kurachi K, Pienta KJ, Rubin MA, Chinnaiyan AM. Delineation of prognostic biomarkers in prostate cancer. Nature. 2001;412:822–826. doi: 10.1038/35090585. [DOI] [PubMed] [Google Scholar]
- Diamandis EP. Cancer biomarkers: can we turn recent failures into success? J Natl Cancer Inst. 2010;102:1462–1467. doi: 10.1093/jnci/djq306. [DOI] [PMC free article] [PubMed] [Google Scholar]
- Dobbin KK, Zhao Y, Simon RM. How large a training set is needed to develop a classifier for microarray data? Clin Cancer Res. 2008;14:108–114. doi: 10.1158/1078-0432.CCR-07-0443. [DOI] [PubMed] [Google Scholar]
- Dupuy A, Simon RM. Critical review of published microarray studies for cancer outcome and guidelines on statistical analysis and reporting. J Natl Cancer Inst. 2007;99:147–157. doi: 10.1093/jnci/djk018. [DOI] [PubMed] [Google Scholar]
- Edgar R, Domrachev M, Lash AE. Gene Expression Omnibus: NCBI gene expression and hybridization array data repository. Nucleic Acids Res. 2002;30:207–210. doi: 10.1093/nar/30.1.207. [DOI] [PMC free article] [PubMed] [Google Scholar]
- Eggle D, Debey-Pascher S, Beyer M, Schultze JL. The development of a comparison approach for Illumina bead chips unravels unexpected challenges applying newest generation microarrays. BMC Bioinformatics. 2009;10:186. doi: 10.1186/1471-2105-10-186. [DOI] [PMC free article] [PubMed] [Google Scholar]
- Ein-Dor L, Kela I, Getz G, Givol D, Domany E. Outcome signature genes in breast cancer: is there a unique set? Bioinformatics. 2005;21:171–178. doi: 10.1093/bioinformatics/bth469. [DOI] [PubMed] [Google Scholar]
- Ein-Dor L, Zuk O, Domany E. Thousands of samples are needed to generate a robust gene list for predicting outcome in cancer. Proc Natl Acad Sci USA. 2006;103:5923–5928. doi: 10.1073/pnas.0601231103. [DOI] [PMC free article] [PubMed] [Google Scholar]
- Elias JE, Haas W, Faherty BK, Gygi SP. Comparative evaluation of mass spectrometry platforms used in large-scale proteomics investigations. Nat Methods. 2005;2:667–675. doi: 10.1038/nmeth785. [DOI] [PubMed] [Google Scholar]
- Elo LL, Lahti L, Skottman H, Kylaniemi M, Lahesmaa R, Aittokallio T. Integrating probe-level expression changes across generations of Affymetrix arrays. Nucleic Acids Res. 2005;33:e193. doi: 10.1093/nar/gni193. [DOI] [PMC free article] [PubMed] [Google Scholar]
- Enkemann SA. Standards affecting the consistency of gene expression arrays in clinical applications. Cancer Epidemiol Biomarkers Prev. 2010;19:1000–1003. doi: 10.1158/1055-9965.EPI-10-0044. [DOI] [PMC free article] [PubMed] [Google Scholar]
- Ergun A, Lawrence CA, Kohanski MA, Brennan TA, Collins JJ. A network biology approach to prostate cancer. Mol Syst Biol. 2007;3:82. doi: 10.1038/msb4100125. [DOI] [PMC free article] [PubMed] [Google Scholar]
- Fend F, Raffeld M. Laser capture microdissection in pathology. J Clin Pathol. 2000;53:666–672. doi: 10.1136/jcp.53.9.666. [DOI] [PMC free article] [PubMed] [Google Scholar]
- Fierro AC, Vandenbussche F, Engelen K, Van de Peer Y, Marchal K. Meta analysis of gene expression data within and across species. Curr Genomics. 2008;9:525–534. doi: 10.2174/138920208786847935. [DOI] [PMC free article] [PubMed] [Google Scholar]
- Fortney K, Kotlyar M, Jurisica I. Inferring the functions of longevity genes with modular subnetwork biomarkers of Caenorhabditis elegans aging. Genome Biol. 2010;11:R13. doi: 10.1186/gb-2010-11-2-r13. [DOI] [PMC free article] [PubMed] [Google Scholar]
- Fujita A, Gomes LR, Sato JR, Yamaguchi R, Thomaz CE, Sogayar MC, Miyano S. Multivariate gene expression analysis reveals functional connectivity changes between normal/tumoral prostates. BMC Syst Biol. 2008;2:106. doi: 10.1186/1752-0509-2-106. [DOI] [PMC free article] [PubMed] [Google Scholar]
- Futreal PA, Coin L, Marshall M, Down T, Hubbard T, Wooster R, Rahman N, Stratton MR. A census of human cancer genes. Nat Rev Cancer. 2004;4:177–183. doi: 10.1038/nrc1299. [DOI] [PMC free article] [PubMed] [Google Scholar]
- Galsworthy MJ (2009) MEDSUM: an online MEDLINE summary tool. http://www.medsum.info
- Gautier L, Moller M, Friis-Hansen L, Knudsen S. Alternative mapping of probes to genes for Affymetrix chips. BMC Bioinformatics. 2004;5:111. doi: 10.1186/1471-2105-5-111. [DOI] [PMC free article] [PubMed] [Google Scholar]
- Gavin AC, Bosche M, Krause R, Grandi P, Marzioch M, Bauer A, Schultz J, Rick JM, Michon AM, Cruciat CM, Remor M, Hofert C, Schelder M, Brajenovic M, Ruffner H, Merino A, Klein K, Hudak M, Dickson D, Rudi T, Gnau V, Bauch A, Bastuck S, Huhse B, Leutwein C, Heurtier MA, Copley RR, Edelmann A, Querfurth E, Rybin V, Drewes G, Raida M, Bouwmeester T, Bork P, Seraphin B, Kuster B, Neubauer G, Superti-Furga G. Functional organization of the yeast proteome by systematic analysis of protein complexes. Nature. 2002;415:141–147. doi: 10.1038/415141a. [DOI] [PubMed] [Google Scholar]
- Goh KI, Cusick ME, Valle D, Childs B, Vidal M, Barabasi AL. The human disease network. Proc Natl Acad Sci USA. 2007;104:8685–8690. doi: 10.1073/pnas.0701361104. [DOI] [PMC free article] [PubMed] [Google Scholar]
- Gortzak-Uzan L, Ignatchenko A, Evangelou AI, Agochiya M, Brown KA, St Onge P, Kireeva I, Schmitt-Ulms G, Brown TJ, Murphy J, Rosen B, Shaw P, Jurisica I, Kislinger T. A proteome resource of ovarian cancer ascites: integrated proteomic and bioinformatic analyses to identify putative biomarkers. J Proteome Res. 2008;7:339–351. doi: 10.1021/pr0703223. [DOI] [PubMed] [Google Scholar]
- Gstaiger M, Aebersold R. Applying mass spectrometry-based proteomics to genetics, genomics and network biology. Nat Rev Genet. 2009;10:617–627. doi: 10.1038/nrg2633. [DOI] [PubMed] [Google Scholar]
- Hahn MW, Kern AD. Comparative genomics of centrality and essentiality in three eukaryotic protein–interaction networks. Mol Biol Evol. 2005;22:803–806. doi: 10.1093/molbev/msi072. [DOI] [PubMed] [Google Scholar]
- Hamosh A, Scott A, Amberger J, Bocchini C, McKusick V. Online Mendelian Inheritance in Man (OMIM), a knowledgebase of human genes and genetic disorders. Nucleic Acids Res. 2005;33:D514–D517. doi: 10.1093/nar/gki033. [DOI] [PMC free article] [PubMed] [Google Scholar]
- Han JD, Bertin N, Hao T, Goldberg DS, Berriz GF, Zhang LV, Dupuy D, Walhout AJ, Cusick ME, Roth FP, Vidal M. Evidence for dynamically organized modularity in the yeast protein–protein interaction network. Nature. 2004;430:88–93. doi: 10.1038/nature02555. [DOI] [PubMed] [Google Scholar]
- Hermjakob H, Montecchi-Palazzi L, Lewington C, Mudali S, Kerrien S, Orchard S, Vingron M, Roechert B, Roepstorff P, Valencia A, Margalit H, Armstrong J, Bairoch A, Cesareni G, Sherman D, Apweiler R. IntAct: an open source molecular interaction database. Nucleic Acids Res. 2004;32:D452–D455. doi: 10.1093/nar/gkh052. [DOI] [PMC free article] [PubMed] [Google Scholar]
- Hoffmann R, Valencia A (2005) Implementing the iHOP concept for navigation of biomedical literature. Bioinformatics 21 Suppl 2: ii252–ii258 [DOI] [PubMed]
- Hoffmann R, Krallinger M, Andres E, Tamames J, Blaschke C, Valencia A (2005) Text mining for metabolic pathways, signaling cascades, and protein networks. Sci STKE 2005(283):pe21 [DOI] [PubMed]
- Hornbeck PV, Chabra I, Kornhauser JM, Skrzypek E, Zhang B. PhosphoSite: a bioinformatics resource dedicated to physiological protein phosphorylation. Proteomics. 2004;4:1551–1561. doi: 10.1002/pmic.200300772. [DOI] [PubMed] [Google Scholar]
- Hornberg JJ, Bruggeman FJ, Westerhoff HV, Lankelma J. Cancer: a systems biology disease. Biosystems. 2006;83:81–90. doi: 10.1016/j.biosystems.2005.05.014. [DOI] [PubMed] [Google Scholar]
- Horvath S, Zhang B, Carlson M, Lu KV, Zhu S, Felciano RM, Laurance MF, Zhao W, Qi S, Chen Z, Lee Y, Scheck AC, Liau LM, Wu H, Geschwind DH, Febbo PG, Kornblum HI, Cloughesy TF, Nelson SF, Mischel PS. Analysis of oncogenic signaling networks in glioblastoma identifies ASPM as a molecular target. Proc Natl Acad Sci USA. 2006;103:17402–17407. doi: 10.1073/pnas.0608396103. [DOI] [PMC free article] [PubMed] [Google Scholar]
- Hu P, Bader G, Wigle DA, Emili A. Computational prediction of cancer-gene function. Nat Rev Cancer. 2007;7:23–34. doi: 10.1038/nrc2036. [DOI] [PubMed] [Google Scholar]
- Hubbard TJ, Aken BL, Ayling S, Ballester B, Beal K, Bragin E, Brent S, Chen Y, Clapham P, Clarke L, Coates G, Fairley S, Fitzgerald S, Fernandez-Banet J, Gordon L, Graf S, Haider S, Hammond M, Holland R, Howe K, Jenkinson A, Johnson N, Kahari A, Keefe D, Keenan S, Kinsella R, Kokocinski F, Kulesha E, Lawson D, Longden I, Megy K, Meidl P, Overduin B, Parker A, Pritchard B, Rios D, Schuster M, Slater G, Smedley D, Spooner W, Spudich G, Trevanion S, Vilella A, Vogel J, White S, Wilder S, Zadissa A, Birney E, Cunningham F, Curwen V, Durbin R, Fernandez-Suarez XM, Herrero J, Kasprzyk A, Proctor G, Smith J, Searle S, Flicek P. Ensembl 2009. Nucleic Acids Res. 2009;37:D690–D697. doi: 10.1093/nar/gkn828. [DOI] [PMC free article] [PubMed] [Google Scholar]
- Hudson TJ, Anderson W, Artez A, Barker AD, Bell C, Bernabe RR, Bhan MK, Calvo F, Eerola I, Gerhard DS, Guttmacher A, Guyer M, Hemsley FM, Jennings JL, Kerr D, Klatt P, Kolar P, Kusada J, Lane DP, Laplace F, Youyong L, Nettekoven G, Ozenberger B, Peterson J, Rao TS, Remacle J, Schafer AJ, Shibata T, Stratton MR, Vockley JG, Watanabe K, Yang H, Yuen MM, Knoppers BM, Bobrow M, Cambon-Thomsen A, Dressler LG, Dyke SO, Joly Y, Kato K, Kennedy KL, Nicolas P, Parker MJ, Rial-Sebbag E, Romeo-Casabona CM, Shaw KM, Wallace S, Wiesner GL, Zeps N, Lichter P, Biankin AV, Chabannon C, Chin L, Clement B, de Alava E, Degos F, Ferguson ML, Geary P, Hayes DN, Johns AL, Kasprzyk A, Nakagawa H, Penny R, Piris MA, Sarin R, Scarpa A, van de Vijver M, Futreal PA, Aburatani H, Bayes M, Botwell DD, Campbell PJ, Estivill X, Grimmond SM, Gut I, Hirst M, Lopez-Otin C, Majumder P, Marra M, McPherson JD, Ning Z, Puente XS, Ruan Y, Stunnenberg HG, Swerdlow H, Velculescu VE, Wilson RK, Xue HH, Yang L, Spellman PT, Bader GD, Boutros PC, Flicek P, Getz G, Guigo R, Guo G, Haussler D, Heath S, Hubbard TJ, Jiang T, et al. International network of cancer genome projects. Nature. 2010;464:993–998. doi: 10.1038/nature08987. [DOI] [PMC free article] [PubMed] [Google Scholar]
- Hwang YC, Lin CC, Chang JY, Mori H, Juan HF, Huang HC. Predicting essential genes based on network and sequence analysis. Mol Biosyst. 2009;5:1672–1678. doi: 10.1039/B900611G. [DOI] [PubMed] [Google Scholar]
- Ideker T, Ozier O, Schwikowski B, Siegel AF. Discovering regulatory and signalling circuits in molecular interaction networks. Bioinformatics. 2002;18(Suppl 1):S233–S240. doi: 10.1093/bioinformatics/18.suppl_1.s233. [DOI] [PubMed] [Google Scholar]
- Irizarry RA, Warren D, Spencer F, Kim IF, Biswal S, Frank BC, Gabrielson E, Garcia JG, Geoghegan J, Germino G, Griffin C, Hilmer SC, Hoffman E, Jedlicka AE, Kawasaki E, Martinez-Murillo F, Morsberger L, Lee H, Petersen D, Quackenbush J, Scott A, Wilson M, Yang Y, Ye SQ, Yu W. Multiple-laboratory comparison of microarray platforms. Nat Methods. 2005;2:345–350. doi: 10.1038/nmeth756. [DOI] [PubMed] [Google Scholar]
- Jensen LJ, Saric J, Bork P. Literature mining for the biologist: from information retrieval to biological discovery. Nat Rev Genet. 2006;7:119–129. doi: 10.1038/nrg1768. [DOI] [PubMed] [Google Scholar]
- Jeong H, Mason SP, Barabasi AL, Oltvai ZN. Lethality and centrality in protein networks. Nature. 2001;411:41–42. doi: 10.1038/35075138. [DOI] [PubMed] [Google Scholar]
- Jones P, Cote RG, Martens L, Quinn AF, Taylor CF, Derache W, Hermjakob H, Apweiler R. PRIDE: a public repository of protein and peptide identifications for the proteomics community. Nucleic Acids Res. 2006;34:D659–D663. doi: 10.1093/nar/gkj138. [DOI] [PMC free article] [PubMed] [Google Scholar]
- Jonsson PF, Bates PA. Global topological features of cancer proteins in the human interactome. Bioinformatics. 2006;22:2291–2297. doi: 10.1093/bioinformatics/btl390. [DOI] [PMC free article] [PubMed] [Google Scholar]
- Jubb AM, Buffa FM, Harris AL. Assessment of tumour hypoxia for prediction of response to therapy and cancer prognosis. J Cell Mol Med. 2010;14:18–29. doi: 10.1111/j.1582-4934.2009.00944.x. [DOI] [PMC free article] [PubMed] [Google Scholar]
- Kanehisa M, Araki M, Goto S, Hattori M, Hirakawa M, Itoh M, Katayama T, Kawashima S, Okuda S, Tokimatsu T, Yamanishi Y. KEGG for linking genomes to life and the environment. Nucleic Acids Res. 2008;36:D480–D484. doi: 10.1093/nar/gkm882. [DOI] [PMC free article] [PubMed] [Google Scholar]
- King AD, Przulj N, Jurisica I. Protein complex prediction via cost-based clustering. Bioinformatics. 2004;20:3013–3020. doi: 10.1093/bioinformatics/bth351. [DOI] [PubMed] [Google Scholar]
- Kirschner MW. The meaning of systems biology. Cell. 2005;121:503–504. doi: 10.1016/j.cell.2005.05.005. [DOI] [PubMed] [Google Scholar]
- Kislinger T, Emili A. Multidimensional protein identification technology: current status and future prospects. Expert Rev Proteomics. 2005;2:27–39. doi: 10.1586/14789450.2.1.27. [DOI] [PubMed] [Google Scholar]
- Kislinger T, Cox B, Kannan A, Chung C, Hu P, Ignatchenko A, Scott MS, Gramolini AO, Morris Q, Hallett MT, Rossant J, Hughes TR, Frey B, Emili A. Global survey of organ and organelle protein expression in mouse: combined proteomic and transcriptomic profiling. Cell. 2006;125:173–186. doi: 10.1016/j.cell.2006.01.044. [DOI] [PubMed] [Google Scholar]
- Kotlyar M, Jurisica I. Predicting protein–protein interactions by association mining. Inf Syst Frontiers. 2006;8:37–47. [Google Scholar]
- Kotlyar M, Niu Y, Ponzielli R, Ding Z, Mills GB, Penn LZ, Jurisica I (2011) Predicting human protein–protein interactions using non-independent features (in preparation)
- Kuhn M, Szklarczyk D, Franceschini A, Campillos M, von Mering C, Jensen LJ, Beyer A, Bork P. STITCH 2: an interaction network database for small molecules and proteins. Nucleic Acids Res. 2010;38:D552–D556. doi: 10.1093/nar/gkp937. [DOI] [PMC free article] [PubMed] [Google Scholar]
- Lau SK, Boutros PC, Pintilie M, Blackhall FH, Zhu CQ, Strumpf D, Johnston MR, Darling G, Keshavjee S, Waddell TK, Liu N, Lau D, Penn LZ, Shepherd FA, Jurisica I, Der SD, Tsao MS. Three-gene prognostic classifier for early-stage non small-cell lung cancer. J Clin Oncol. 2007;25:5562–5569. doi: 10.1200/JCO.2007.12.0352. [DOI] [PubMed] [Google Scholar]
- Ledford H. Big science: the cancer genome challenge. Nature. 2010;464:972–974. doi: 10.1038/464972a. [DOI] [PubMed] [Google Scholar]
- Li L, Zhang K, Lee J, Cordes S, Davis DP, Tang Z. Discovering cancer genes by integrating network and functional properties. BMC Med Genomics. 2009;2:61. doi: 10.1186/1755-8794-2-61. [DOI] [PMC free article] [PubMed] [Google Scholar]
- Lowe JA, Jones P, Wilson DM. Network biology as a new approach to drug discovery. Curr Opin Drug Discov Dev. 2010;13:524–526. [PubMed] [Google Scholar]
- Lynn DJ, Winsor GL, Chan C, Richard N, Laird MR, Barsky A, Gardy JL, Roche FM, Chan TH, Shah N, Lo R, Naseer M, Que J, Yau M, Acab M, Tulpan D, Whiteside MD, Chikatamarla A, Mah B, Munzner T, Hokamp K, Hancock RE, Brinkman FS. InnateDB: facilitating systems-level analyses of the mammalian innate immune response. Mol Syst Biol. 2008;4:218. doi: 10.1038/msb.2008.55. [DOI] [PMC free article] [PubMed] [Google Scholar]
- Maslov S, Sneppen K. Specificity and stability in topology of protein networks. Science. 2002;296:910–913. doi: 10.1126/science.1065103. [DOI] [PubMed] [Google Scholar]
- Matthews L, Gopinath G, Gillespie M, Caudy M, Croft D, de Bono B, Garapati P, Hemish J, Hermjakob H, Jassal B, Kanapin A, Lewis S, Mahajan S, May B, Schmidt E, Vastrik I, Wu G, Birney E, Stein L, D’Eustachio P. Reactome knowledgebase of human biological pathways and processes. Nucleic Acids Res. 2009;37:D619–D622. doi: 10.1093/nar/gkn863. [DOI] [PMC free article] [PubMed] [Google Scholar]
- McGuffin M, Jurisica I. Interaction techniques for selecting and manipulating subgraphs in network visualizations. IEEE Trans Vis Comput Graph. 2009;15(6):937–944. doi: 10.1109/TVCG.2009.151. [DOI] [PubMed] [Google Scholar]
- Mills GB, Jurisica I, Yarden Y, Norman JC. Genomic amplicons target vesicle recycling in breast cancer. J Clin Invest. 2009;119:2123–2127. doi: 10.1172/JCI40256. [DOI] [PMC free article] [PubMed] [Google Scholar]
- Milo R, Shen-Orr S, Itzkovitz S, Kashtan N, Chklovskii D, Alon U. Network motifs: simple building blocks of complex networks. Science. 2002;298:824–827. doi: 10.1126/science.298.5594.824. [DOI] [PubMed] [Google Scholar]
- Myhre S, Mohammed H, Tramm T, Alsner J, Finak G, Park M, Overgaard J, Borresen-Dale AL, Frigessi A, Sorlie T. In silico ascription of gene expression differences to tumor and stromal cells in a model to study impact on breast cancer outcome. PLoS One. 2010;5:e14002. doi: 10.1371/journal.pone.0014002. [DOI] [PMC free article] [PubMed] [Google Scholar]
- Nacu S, Critchley-Thorne R, Lee P, Holmes S. Gene expression network analysis and applications to immunology. Bioinformatics. 2007;23:850–858. doi: 10.1093/bioinformatics/btm019. [DOI] [PubMed] [Google Scholar]
- Newman ME. Modularity and community structure in networks. Proc Natl Acad Sci USA. 2006;103:8577–8582. doi: 10.1073/pnas.0601602103. [DOI] [PMC free article] [PubMed] [Google Scholar]
- Nibbe RK, Markowitz S, Myeroff L, Ewing R, Chance MR. Discovery and scoring of protein interaction subnetworks discriminative of late stage human colon cancer. Mol Cell Proteomics. 2009;8:827–845. doi: 10.1074/mcp.M800428-MCP200. [DOI] [PMC free article] [PubMed] [Google Scholar]
- Nibbe RK, Koyuturk M, Chance MR. An integrative-omics approach to identify functional sub-networks in human colorectal cancer. PLoS Comput Biol. 2010;6:e1000639. doi: 10.1371/journal.pcbi.1000639. [DOI] [PMC free article] [PubMed] [Google Scholar]
- Niu Y, Otasek D, Jurisica I. Evaluation of linguistic features useful in extraction of interactions from PubMed; application to annotating known, high-throughput and predicted interactions in I2D. Bioinformatics. 2010;26:111–119. doi: 10.1093/bioinformatics/btp602. [DOI] [PMC free article] [PubMed] [Google Scholar]
- Orchard S, Kerrien S, Jones P, Ceol A, Chatr-Aryamontri A, Salwinski L, Nerothin J, Hermjakob H. Submit your interaction data the IMEx way: a step by step guide to trouble-free deposition. Proteomics. 2007;7(Suppl 1):28–34. doi: 10.1002/pmic.200700286. [DOI] [PubMed] [Google Scholar]
- Orchard S, Albar JP, Deutsch EW, Eisenacher M, Binz PA, Hermjakob H. Implementing data standards: a report on the HUPOPSI workshop September 2009, Toronto, Canada. Proteomics. 2010;10:1895–1898. doi: 10.1002/pmic.201090034. [DOI] [PubMed] [Google Scholar]
- Palla G, Derenyi I, Farkas I, Vicsek T. Uncovering the overlapping community structure of complex networks in nature and society. Nature. 2005;435:814–818. doi: 10.1038/nature03607. [DOI] [PubMed] [Google Scholar]
- Pegram MD, Lipton A, Hayes DF, Weber BL, Baselga JM, Tripathy D, Baly D, Baughman SA, Twaddell T, Glaspy JA, Slamon DJ. Phase II study of receptor-enhanced chemosensitivity using recombinant humanized anti-p185HER2/neu monoclonal antibody plus cisplatin in patients with HER2/neu-overexpressing metastatic breast cancer refractory to chemotherapy treatment. J Clin Oncol. 1998;16:2659–2671. doi: 10.1200/JCO.1998.16.8.2659. [DOI] [PubMed] [Google Scholar]
- Pena-Castillo L, Tasan M, Myers CL, Lee H, Joshi T, Zhang C, Guan Y, Leone M, Pagnani A, Kim WK, Krumpelman C, Tian W, Obozinski G, Qi Y, Mostafavi S, Lin GN, Berriz GF, Gibbons FD, Lanckriet G, Qiu J, Grant C, Barutcuoglu Z, Hill DP, Warde-Farley D, Grouios C, Ray D, Blake JA, Deng M, Jordan MI, Noble WS, Morris Q, Klein-Seetharaman J, Bar-Joseph Z, Chen T, Sun F, Troyanskaya OG, Marcotte EM, Xu D, Hughes TR, Roth FP. A critical assessment of Mus musculus gene function prediction using integrated genomic evidence. Genome Biol. 2008;9(Suppl 1):S2. doi: 10.1186/gb-2008-9-s1-s2. [DOI] [PMC free article] [PubMed] [Google Scholar]
- Peri S, Navarro JD, Kristiansen TZ, Amanchy R, Surendranath V, Muthusamy B, Gandhi TK, Chandrika KN, Deshpande N, Suresh S, Rashmi BP, Shanker K, Padma N, Niranjan V, Harsha HC, Talreja N, Vrushabendra BM, Ramya MA, Yatish AJ, Joy M, Shivashankar HN, Kavitha MP, Menezes M, Choudhury DR, Ghosh N, Saravana R, Chandran S, Mohan S, Jonnalagadda CK, Prasad CK, Kumar-Sinha C, Deshpande KS, Pandey A. Human protein reference database as a discovery resource for proteomics. Nucleic Acids Res. 2004;32:D497–D501. doi: 10.1093/nar/gkh070. [DOI] [PMC free article] [PubMed] [Google Scholar]
- Pettifer S, Thorne D, McDermott P, Attwood T, Baran J, Bryne JC, Hupponen T, Mowbray D, Vriend G. An active registry for bioinformatics web services. Bioinformatics. 2009;25:2090–2091. doi: 10.1093/bioinformatics/btp329. [DOI] [PMC free article] [PubMed] [Google Scholar]
- Pico AR, Kelder T, van Iersel MP, Hanspers K, Conklin BR, Evelo C. WikiPathways: pathway editing for the people. PLoS Biol. 2008;6:e184. doi: 10.1371/journal.pbio.0060184. [DOI] [PMC free article] [PubMed] [Google Scholar]
- Ponzielli R, Boutros PC, Katz S, Stojanova A, Hanley AP, Khosravi F, Bros C, Jurisica I, Penn LZ. Optimization of experimental design parameters for high-throughput chromatin immunoprecipitation studies. Nucleic Acids Res. 2008;36:e144. doi: 10.1093/nar/gkn735. [DOI] [PMC free article] [PubMed] [Google Scholar]
- Przulj N. Biological network comparison using graphlet degree distribution. Bioinformatics. 2007;23:e177–e183. doi: 10.1093/bioinformatics/btl301. [DOI] [PubMed] [Google Scholar]
- Przulj N, Corneil DG, Jurisica I. Efficient estimation of graphlet frequency distributions in protein–protein interaction networks. Bioinformatics. 2006;22:974–980. doi: 10.1093/bioinformatics/btl030. [DOI] [PubMed] [Google Scholar]
- Radulovich N, Pham NA, Strumpf D, Leung L, Xie W, Jurisica I, Tsao MS. Differential roles of cyclin D1 and D3 in pancreatic ductal adenocarcinoma. Mol Cancer. 2010;9:24. doi: 10.1186/1476-4598-9-24. [DOI] [PMC free article] [PubMed] [Google Scholar]
- Rambaldi D, Giorgi FM, Capuani F, Ciliberto A, Ciccarelli FD. Low duplicability and network fragility of cancer genes. Trends Genet. 2008;24:427–430. doi: 10.1016/j.tig.2008.06.003. [DOI] [PubMed] [Google Scholar]
- Ravasz E, Somera AL, Mongru DA, Oltvai ZN, Barabasi AL. Hierarchical organization of modularity in metabolic networks. Science. 2002;297:1551–1555. doi: 10.1126/science.1073374. [DOI] [PubMed] [Google Scholar]
- Rebhan M, Chalifa-Caspi V, Prilusky J, Lancet D. GeneCards: integrating information about genes, proteins and diseases. Trends Genet. 1997;13:163. doi: 10.1016/s0168-9525(97)01103-7. [DOI] [PubMed] [Google Scholar]
- Reis PP, Tomenson M, Cervigne NK, Machado J, Jurisica I, Pintilie M, Sukhai MA, Perez-Ordonez B, Grenman R, Gilbert RW, Gullane PJ, Irish JC, Kamel-Reid S. Programmed cell death 4 loss increases tumor cell invasion and is regulated by miR-21 in oral squamous cell carcinoma. Mol Cancer. 2010;9:238. doi: 10.1186/1476-4598-9-238. [DOI] [PMC free article] [PubMed] [Google Scholar]
- Rhodes DR, Chinnaiyan AM (2005) Integrative analysis of the cancer transcriptome. Nat Genet 37 Suppl: S31–37 [DOI] [PubMed]
- Rhodes DR, Tomlins SA, Varambally S, Mahavisno V, Barrette T, Kalyana-Sundaram S, Ghosh D, Pandey A, Chinnaiyan AM. Probabilistic model of the human protein–protein interaction network. Nat Biotechnol. 2005;23:951–959. doi: 10.1038/nbt1103. [DOI] [PubMed] [Google Scholar]
- Rhodes DR, Kalyana-Sundaram S, Mahavisno V, Varambally R, Yu J, Briggs BB, Barrette TR, Anstet MJ, Kincead-Beal C, Kulkarni P, Varambally S, Ghosh D, Chinnaiyan AM. Oncomine 3.0: genes, pathways, and networks in a collection of 18, 000 cancer gene expression profiles. Neoplasia. 2007;9:166–180. doi: 10.1593/neo.07112. [DOI] [PMC free article] [PubMed] [Google Scholar]
- Rice JJ, Kershenbaum A, Stolovitzky G. Lasting impressions: motifs in protein–protein maps may provide footprints of evolutionary events. Proc Natl Acad Sci USA. 2005;102:3173–3174. doi: 10.1073/pnas.0500130102. [DOI] [PMC free article] [PubMed] [Google Scholar]
- Roberts PJ, Der CJ. Targeting the Raf-MEK-ERK mitogen-activated protein kinase cascade for the treatment of cancer. Oncogene. 2007;26:3291–3310. doi: 10.1038/sj.onc.1210422. [DOI] [PubMed] [Google Scholar]
- Rodriguez-Esteban R. Biomedical text mining and its applications. PLoS Comput Biol. 2009;5:e1000597. doi: 10.1371/journal.pcbi.1000597. [DOI] [PMC free article] [PubMed] [Google Scholar]
- Rual JF, Venkatesan K, Hao T, Hirozane-Kishikawa T, Dricot A, Li N, Berriz GF, Gibbons FD, Dreze M, Ayivi-Guedehoussou N, Klitgord N, Simon C, Boxem M, Milstein S, Rosenberg J, Goldberg DS, Zhang LV, Wong SL, Franklin G, Li S, Albala JS, Lim J, Fraughton C, Llamosas E, Cevik S, Bex C, Lamesch P, Sikorski RS, Vandenhaute J, Zoghbi HY, Smolyar A, Bosak S, Sequerra R, Doucette-Stamm L, Cusick ME, Hill DE, Roth FP, Vidal M. Towards a proteome-scale map of the human protein–protein interaction network. Nature. 2005;437:1173–1178. doi: 10.1038/nature04209. [DOI] [PubMed] [Google Scholar]
- Sandberg R, Larsson O. Improved precision and accuracy for microarrays using updated probe set definitions. BMC Bioinformatics. 2007;8:48. doi: 10.1186/1471-2105-8-48. [DOI] [PMC free article] [PubMed] [Google Scholar]
- Savas S, Geraci J, Jurisica I, Liu G. A comprehensive catalogue of functional genetic variations in the EGFR pathway: protein–protein interaction analysis reveals novel genes and polymorphisms important for cancer research. Int J Cancer. 2009;125:1257–1265. doi: 10.1002/ijc.24535. [DOI] [PubMed] [Google Scholar]
- Schmucker D, Clemens JC, Shu H, Worby CA, Xiao J, Muda M, Dixon JE, Zipursky SL. Drosophila Dscam is an axon guidance receptor exhibiting extraordinary molecular diversity. Cell. 2000;101:671–684. doi: 10.1016/s0092-8674(00)80878-8. [DOI] [PubMed] [Google Scholar]
- Sebolt-Leopold JS, Herrera R. Targeting the mitogen-activated protein kinase cascade to treat cancer. Nat Rev Cancer. 2004;4:937–947. doi: 10.1038/nrc1503. [DOI] [PubMed] [Google Scholar]
- Shannon P, Markiel A, Ozier O, Baliga NS, Wang JT, Ramage D, Amin N, Schwikowski B, Ideker T. Cytoscape: a software environment for integrated models of biomolecular interaction networks. Genome Res. 2003;13:2498–2504. doi: 10.1101/gr.1239303. [DOI] [PMC free article] [PubMed] [Google Scholar]
- Shedden K, Taylor JM, Enkemann SA, Tsao MS, Yeatman TJ, Gerald WL, Eschrich S, Jurisica I, Giordano TJ, Misek DE, Chang AC, Zhu CQ, Strumpf D, Hanash S, Shepherd FA, Ding K, Seymour L, Naoki K, Pennell N, Weir B, Verhaak R, Ladd-Acosta C, Golub T, Gruidl M, Sharma A, Szoke J, Zakowski M, Rusch V, Kris M, Viale A, Motoi N, Travis W, Conley B, Seshan VE, Meyerson M, Kuick R, Dobbin KK, Lively T, Jacobson JW, Beer DG. Gene expression-based survival prediction in lung adenocarcinoma: a multi-site, blinded validation study. Nat Med. 2008;14:822–827. doi: 10.1038/nm.1790. [DOI] [PMC free article] [PubMed] [Google Scholar]
- Shirdel EA, Xie W, Mak TW, Jurisica I (2011) NAViGaTing the microNome—using multiple microRNA prediction databases to identify signaling pathway-associated microRNA. PLoS One 6(2):e17429 [DOI] [PMC free article] [PubMed]
- Slamon DJ, Press MF. Alterations in the TOP2A and HER2 genes: association with adjuvant anthracycline sensitivity in human breast cancers. J Natl Cancer Inst. 2009;101:615–618. doi: 10.1093/jnci/djp092. [DOI] [PubMed] [Google Scholar]
- Sodek KL, Evangelou AI, Ignatchenko A, Agochiya M, Brown TJ, Ringuette MJ, Jurisica I, Kislinger T. Identification of pathways associated with invasive behavior by ovarian cancer cells using multidimensional protein identification technology (MudPIT) Mol Biosyst. 2008;4:762–773. doi: 10.1039/b717542f. [DOI] [PubMed] [Google Scholar]
- Spentzos D, Levine DA, Ramoni MF, Joseph M, Gu X, Boyd J, Libermann TA, Cannistra SA. Gene expression signature with independent prognostic significance in epithelial ovarian cancer. J Clin Oncol. 2004;22:4700–4710. doi: 10.1200/JCO.2004.04.070. [DOI] [PubMed] [Google Scholar]
- Spirin V, Mirny LA. Protein complexes and functional modules in molecular networks. Proc Natl Acad Sci USA. 2003;100:12123–12128. doi: 10.1073/pnas.2032324100. [DOI] [PMC free article] [PubMed] [Google Scholar]
- Stark C, Breitkreutz BJ, Reguly T, Boucher L, Breitkreutz A, Tyers M. BioGRID: a general repository for interaction datasets. Nucleic Acids Res. 2006;34:D535–D539. doi: 10.1093/nar/gkj109. [DOI] [PMC free article] [PubMed] [Google Scholar]
- Stelzl U, Worm U, Lalowski M, Haenig C, Brembeck FH, Goehler H, Stroedicke M, Zenkner M, Schoenherr A, Koeppen S, Timm J, Mintzlaff S, Abraham C, Bock N, Kietzmann S, Goedde A, Toksoz E, Droege A, Krobitsch S, Korn B, Birchmeier W, Lehrach H, Wanker EE. A human protein–protein interaction network: a resource for annotating the proteome. Cell. 2005;122:957–968. doi: 10.1016/j.cell.2005.08.029. [DOI] [PubMed] [Google Scholar]
- Stratton MR, Campbell PJ, Futreal PA. The cancer genome. Nature. 2009;458:719–724. doi: 10.1038/nature07943. [DOI] [PMC free article] [PubMed] [Google Scholar]
- Stumpf MP, Thorne T, de Silva E, Stewart R, An HJ, Lappe M, Wiuf C. Estimating the size of the human interactome. Proc Natl Acad Sci USA. 2008;105:6959–6964. doi: 10.1073/pnas.0708078105. [DOI] [PMC free article] [PubMed] [Google Scholar]
- Subramanian A, Tamayo P, Mootha VK, Mukherjee S, Ebert BL, Gillette MA, Paulovich A, Pomeroy SL, Golub TR, Lander ES, Mesirov JP. Gene set enrichment analysis: a knowledge-based approach for interpreting genome-wide expression profiles. Proc Natl Acad Sci USA. 2005;102:15545–15550. doi: 10.1073/pnas.0506580102. [DOI] [PMC free article] [PubMed] [Google Scholar]
- Syed AS, D’Antonio M, Ciccarelli FD. Network of Cancer Genes: a web resource to analyze duplicability, orthology and network properties of cancer genes. Nucleic Acids Res. 2010;38:D670–D675. doi: 10.1093/nar/gkp957. [DOI] [PMC free article] [PubMed] [Google Scholar]
- Szklarczyk D, Franceschini A, Kuhn M, Simonovic M, Roth A, Minguez P, Doerks T, Stark M, Muller J, Bork P, Jensen LJ, von Mering C. The STRING database in 2011: functional interaction networks of proteins, globally integrated and scored. Nucleic Acids Res. 2011;39:D561–D568. doi: 10.1093/nar/gkq973. [DOI] [PMC free article] [PubMed] [Google Scholar]
- Tan PK, Downey TJ, Spitznagel EL, Jr, Xu P, Fu D, Dimitrov DS, Lempicki RA, Raaka BM, Cam MC. Evaluation of gene expression measurements from commercial microarray platforms. Nucleic Acids Res. 2003;31:5676–5684. doi: 10.1093/nar/gkg763. [DOI] [PMC free article] [PubMed] [Google Scholar]
- Tian L, Greenberg SA, Kong SW, Altschuler J, Kohane IS, Park PJ. Discovering statistically significant pathways in expression profiling studies. Proc Natl Acad Sci USA. 2005;102:13544–13549. doi: 10.1073/pnas.0506577102. [DOI] [PMC free article] [PubMed] [Google Scholar]
- Tomasini R, Tsuchihara K, Wilhelm M, Fujitani M, Rufini A, Cheung CC, Khan F, Itie-Youten A, Wakeham A, Tsao MS, Iovanna JL, Squire J, Jurisica I, Kaplan D, Melino G, Jurisicova A, Mak TW. TAp73 knockout shows genomic instability with infertility and tumor suppressor functions. Genes Dev. 2008;22:2677–2691. doi: 10.1101/gad.1695308. [DOI] [PMC free article] [PubMed] [Google Scholar]
- van Vliet MH, Reyal F, Horlings HM, van de Vijver MJ, Reinders MJ, Wessels LF. Pooling breast cancer datasets has a synergetic effect on classification performance and improves signature stability. BMC Genomics. 2008;9:375. doi: 10.1186/1471-2164-9-375. [DOI] [PMC free article] [PubMed] [Google Scholar]
- Varambally S, Yu J, Laxman B, Rhodes DR, Mehra R, Tomlins SA, Shah RB, Chandran U, Monzon FA, Becich MJ, Wei JT, Pienta KJ, Ghosh D, Rubin MA, Chinnaiyan AM. Integrative genomic and proteomic analysis of prostate cancer reveals signatures of metastatic progression. Cancer Cell. 2005;8:393–406. doi: 10.1016/j.ccr.2005.10.001. [DOI] [PubMed] [Google Scholar]
- Viau C, McGuffin MJ, Chiricota Y, Jurisica I. The flowvizmenu and parallel scatterplot matrix: hybrid multidimensional visualizations for network exploration. Vis Comput Graph IEEE Trans. 2010;16:1100–1108. doi: 10.1109/TVCG.2010.205. [DOI] [PubMed] [Google Scholar]
- von Eichborn J, Murgueitio MS, Dunkel M, Koerner S, Bourne PE, Preissner R. PROMISCUOUS: a database for network-based drug-repositioning. Nucleic Acids Res. 2011;39:D1060–D1066. doi: 10.1093/nar/gkq1037. [DOI] [PMC free article] [PubMed] [Google Scholar]
- Wang ET, Sandberg R, Luo S, Khrebtukova I, Zhang L, Mayr C, Kingsmore SF, Schroth GP, Burge CB. Alternative isoform regulation in human tissue transcriptomes. Nature. 2008;456:470–476. doi: 10.1038/nature07509. [DOI] [PMC free article] [PubMed] [Google Scholar]
- Wang L, Tang H, Thayanithy V, Subramanian S, Oberg AL, Cunningham JM, Cerhan JR, Steer CJ, Thibodeau SN. Gene networks and microRNAs implicated in aggressive prostate cancer. Cancer Res. 2009;69:9490–9497. doi: 10.1158/0008-5472.CAN-09-2183. [DOI] [PMC free article] [PubMed] [Google Scholar]
- Warnat P, Eils R, Brors B. Cross-platform analysis of cancer microarray data improves gene expression based classification of phenotypes. BMC Bioinformatics. 2005;6:265. doi: 10.1186/1471-2105-6-265. [DOI] [PMC free article] [PubMed] [Google Scholar]
- Wei Y, Tong J, Taylor P, Strumpf D, Ignatchenko V, Pham NA, Yanagawa N, Liu G, Jurisica I, Shepherd FA, Tsao MS, Kislinger T, Moran MF. Primary tumor xenografts of human lung adeno and squamous cell carcinoma express distinct proteomic signatures. J Proteome Res. 2011;10:161–174. doi: 10.1021/pr100491e. [DOI] [PubMed] [Google Scholar]
- Wuchty S. Topology and weights in a protein domain interaction network—a novel way to predict protein interactions. BMC Genomics. 2006;7:122. doi: 10.1186/1471-2164-7-122. [DOI] [PMC free article] [PubMed] [Google Scholar]
- Xenarios I, Rice DW, Salwinski L, Baron MK, Marcotte EM, Eisenberg D. DIP: the database of interacting proteins. Nucleic Acids Res. 2000;28:289–291. doi: 10.1093/nar/28.1.289. [DOI] [PMC free article] [PubMed] [Google Scholar]
- Yu H, Paccanaro A, Trifonov V, Gerstein M (2006) Predicting interactions in protein networks by completing defective cliques. Bioinformatics 22(7):823–829 [DOI] [PubMed]
- Zanzoni A, Montecchi-Palazzi L, Quondam M, Ausiello G, Helmer-Citterich M, Cesareni G. MINT: a Molecular INTeraction database. FEBS Lett. 2002;513:135–140. doi: 10.1016/s0014-5793(01)03293-8. [DOI] [PubMed] [Google Scholar]
- Zhang B, Horvath S (2005) A general framework for weighted gene co-expression network analysis. Stat Appl Genet Mol Biol 4 (article17) [DOI] [PubMed]
- Zhang M, Yao C, Guo Z, Zou J, Zhang L, Xiao H, Wang D, Yang D, Gong X, Zhu J, Li Y, Li X. Apparently low reproducibility of true differential expression discoveries in microarray studies. Bioinformatics. 2008;24:2057–2063. doi: 10.1093/bioinformatics/btn365. [DOI] [PubMed] [Google Scholar]
- Zhu CQ, da Cunha Santos G, Ding K, Sakurada A, Cutz JC, Liu N, Zhang T, Marrano P, Whitehead M, Squire JA, Kamel-Reid S, Seymour L, Shepherd FA, Tsao MS. Role of KRAS and EGFR as biomarkers of response to erlotinib in National Cancer Institute of Canada Clinical Trials Group Study BR.21. J Clin Oncol. 2008;26:4268–4275. doi: 10.1200/JCO.2007.14.8924. [DOI] [PubMed] [Google Scholar]
- Zhu CQ, Pintilie M, John T, Strumpf D, Shepherd FA, Der SD, Jurisica I, Tsao M-S. Understanding prognostic gene expression signatures in lung cancer. Clin Lung Cancer. 2009;10(5):331–340. doi: 10.3816/CLC.2009.n.045. [DOI] [PubMed] [Google Scholar]
- Zhu CQ, Ding K, Strumpf D, Weir BA, Meyerson M, Pennell N, Thomas RK, Naoki K, Ladd-Acosta C, Liu N, Pintilie M, Der S, Seymour L, Jurisica I, Shepherd FA, Tsao MS. Prognostic and predictive gene signature for adjuvant chemotherapy in resected non-small-cell lung cancer. J Clin Oncol. 2010;28:4417–4424. doi: 10.1200/JCO.2009.26.4325. [DOI] [PMC free article] [PubMed] [Google Scholar]
- Zhu CQ, Strumpf D, Li CY, Li Q, Liu N, Der S, Shepherd FA, Tsao MS, Jurisica I. Prognostic gene expression signature for squamous cell carcinoma of lung. Clin Cancer Res. 2010;16:5038–5047. doi: 10.1158/1078-0432.CCR-10-0612. [DOI] [PubMed] [Google Scholar]
Associated Data
This section collects any data citations, data availability statements, or supplementary materials included in this article.
Supplementary Materials
I2D interaction database, version 1.85. A tab-delimited file of protein interactions and their source databases. (TXT 5,794 kb)
Protein–protein interaction network from Figure 3. In NAViGaTOR 2.2 XML file format. (XML 150,401 kb)