Abstract
Purpose
Using three publicly available small-animal atlases (Sprague–Dawley rat, MOBY, and Digimouse), we built three articulated atlases and present several applications in the scope of molecular imaging.
Procedures
Major bones/bone groups were manually segmented for each atlas skeleton. Then, a kinematic model for each atlas was built: each joint position was identified and the corresponding degrees of freedom were specified.
Results
The articulated atlases enable automated registration into a common coordinate frame of multimodal small-animal imaging data. This eliminates the postural variability (e.g., of the head, back, and front limbs) that occurs in different time steps and due to modality differences and nonstandardized acquisition protocols.
Conclusions
The articulated atlas proves to be a useful tool for multimodality image combination, follow-up studies, and image processing in the scope of molecular imaging. The proposed models were made publicly available.
Keywords: Small animal imaging, C57BL/6, C3H mouse, SD rat, Articulated atlas, Image processing, Registration, microCT, BLI, microMRI
Introduction
In preclinical research, different imaging modalities are used for the in vivo visualization of functional and anatomical information. Structural imaging modalities such as magnetic resonance imaging (MRI), computed tomography (CT), and ultrasound provide detailed depictions of anatomy; positron emission tomography (PET), single photon emission computed tomography (SPECT), and specialized MRI protocols add functional information. In addition, optical imaging modalities, such as bioluminescence imaging (BLI) and near-infrared fluorescence imaging, offer a high sensitivity in visualizing molecular processes in vivo. In combination, these modalities enable the visualization of the cellular function and the follow-up of molecular processes in living organisms without perturbing them.
Due to the high number of existing imaging modalities, a new, different challenge emerged: how to best combine and analyze all these data? The problem is shifting from data acquisition to data organization, processing and analysis, and the main difficulty of this task is the enormous data heterogeneity and volume/throughput. The above-mentioned imaging techniques provide 2D, 3D, or 4D images depending on modality and are used in follow-up and cross-sectional studies using different animals (according to strain, size, age, body fat percentage, population). One other very important factor is the postural variability: there is no standardized protocol for imaging. If a subject is imaged using different imaging modalities and protocols, during follow-up studies or if different animals are used, the subject is positioned in different ways and postural variations occur (e.g., of the head, back, and front limbs, etc.; Figs. 1, 3, 4). Although there are some multimodality animal holders, to date, they are not widely used, and even with the use of the holders, there are still significant differences in animal posture between different time points. All these factors contribute to the large data heterogeneity.
Fig. 1.
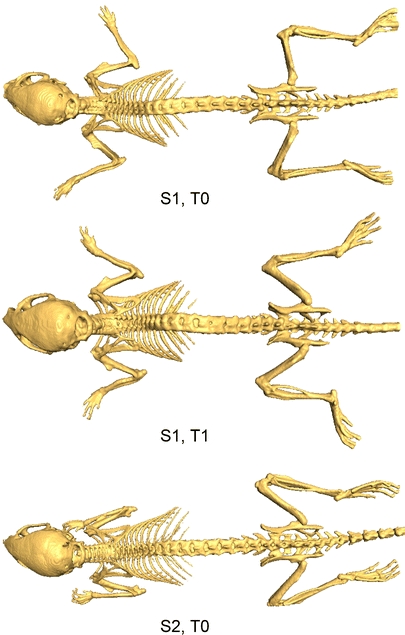
Illustration of the postural variability (limbs, head) that occurs in follow-up and cross-sectional molecular imaging studies: top and middle mouse—same subject S1, two time steps T0 and T1; bottom mouse—different subject S2.
Fig. 3.
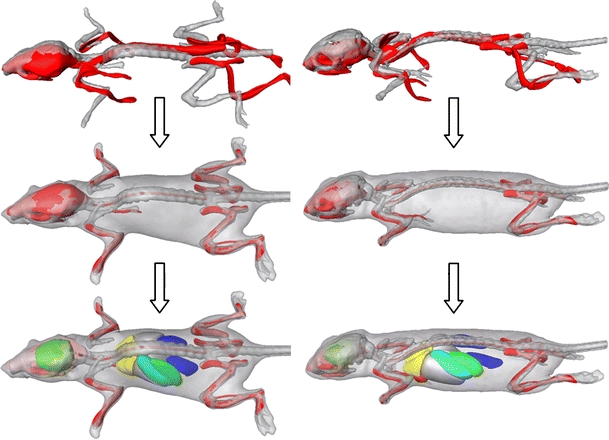
Registration results between the atlas (red) and two different subjects (gray) after coarsely aligning the skeleton (top), after the articulated registration (middle), and after organ approximation (bottom).
Fig. 4.
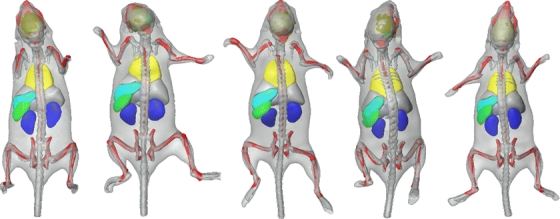
Skeleton registration and organ approximation using the same subject, at five different time points (4 weeks). The animal was put into the acquisition device arbitrarily, in supine (a–c) and prone (d–e) position, respectively, and the postural variations of the head, back, and front limbs are clearly visible.
One way of handling this problem is to use atlases. In biomedical imaging research, anatomical atlases have proven to be useful for defining a standard geometric reference for further subject analysis and meaningful comparisons. Atlases may consist of a 3D, sometimes 4D, whole-body or organ-based geometric representations. This enables mapping functional activity and anatomical variability among individuals and populations. Considering the issues mentioned above, having such a model allows for a more effective way to combine, structure, and execute all sorts of comparisons and correlations within the data. For example, it is possible to make population brain studies in a specific time frame. For that, brain images from each individual, obtained through MRI, PET, and other imaging techniques, are spatially warped to a brain template. After combining the data, inferences are made about tissue identity at a specific location by referring to the atlas or looking for variability of those locations within that population.
There are a large number of clinical atlases that are available and widely used in population imaging, image segmentation, image registration, and in shape differences and follow-up studies. Three of the most well-known and used atlases within the clinical research scope are the Talairach brain atlas [1], the Visible Human Project whole-body atlas [2], and the 4D NCAT torso phantom [3]. The Talairach atlas consists of a standard 3D coordinate space with labeled regions and structural probability maps and is available for clinical use. This atlas is not only used for stereotactic and functional neurosurgery but also in human brain mapping, neuroradiology, medical image analysis, and neuroscience education. The Visible Human Project consists of manually annotated MRI, CT, and cryosection images for both male and female human bodies. The available datasets were designed to serve as a reference for the study of human anatomy and have been applied to a wide range of educational, diagnostic, treatment planning, virtual reality, and artistic, mathematical, and industrial uses [2]. The 4D NCAT phantom on the other hand provides a more realistic model of the human anatomy and motions because it does not sacrifice any flexibility to model the anatomical variations and patient motion and has been used in SPECT simulations [3]. For a more detailed survey on computational anatomical and physiological models, see [4].
Within the scope of preclinical molecular imaging research, there are various mouse and rat atlases with different characteristics and purposes, acquired using different techniques (CT, MRI, cryosectioning, etc.). Many of those are thoroughly described and published in literature and are publicly available: the LONI Rat atlas published by the UCLA Laboratory of Neuro Imaging [5] and other brain focused atlases [6–10], the Edinburgh Mouse Atlas Project [11] that describes and presents a 3D model of the mouse embryo, the MRI Atlas of Mouse Development from the California Institute of Technology [12], the Mouse Cochlea Database made by the University of Minnesota [13], and whole-body small animal atlases like MOBY mouse [14] and Digimouse [15] and the high resolution Sprague–Dawley (SD) rat [16,17].
However, these mouse and rat atlases are either specific, organ-dedicated atlases (brain, hypothalamus, heart, etc.), low-resolution, or cannot deal with the large postural variations that occur within the scans acquired using different imaging modalities during follow-up studies (different time steps) or if different animals are used because mice are positioned in different ways when scanned and there is no standardized acquisition protocol.
The work described here addresses the abovementioned problems by introducing articulations in three existing whole-body atlases: (1) Digimouse [15], (2) MOBY mouse [14], and (3) high-resolution SD rat [16,17]. A kinematic model is built for each atlas where bones in each skeleton are manually segmented and labeled, and the corresponding degrees of freedom (DoFs) for each joint are defined.
Mapping to this articulated atlas has the advantage that all the different imaging modalities can be (semi) automatically registered to a common anatomical reference; postural variations can be corrected, and the different animals (according to strain, size, age, body fat percentage) can be scaled properly.
The goals of this work are to:
Introduce the concept of the articulated whole-body small animal atlas;
Present and discuss several implemented application examples: atlas to microCT data registration, follow-up microCT studies, cross-sectional microCT studies, multimodality atlas to BLI and microCT image registration and analysis, and atlas to microMRI data approximation; and
Make these three articulated whole-body small animal atlases publicly available.
Methods
Atlas Descriptions
Presently, in the work described here, three small animal atlases are used. In this section, a brief description of each one is presented.
MOBY (Mouse Whole-Body) Atlas
Segars et al. generated a realistic 4D digital mouse phantom based on high-resolution 3D MRI data from Duke University. The organs of this atlas were built using non-uniform rational b-spline (NURBS) surfaces, which are widely used in 3D computer graphics.
The final package includes a realistic 3D model of the mouse anatomy and accurate 4D models for the cardiac and respiratory motions. Both the cardiac and respiratory motion models were developed based on cardiac gated black-blood MRI and respiratory-gated MRI data from the University of Virginia. It has been used in simulation studies in SPECT and X-ray CT [14].
Digimouse Atlas
Dogdas et al. constructed a 3D whole-body multimodal mouse atlas from co-registered X-ray microCT and color cryosection data (anatomical information) of a normal nude male mouse. It also includes PET data (functional information) representing the distribution of a mixture of the tracers [18F] fluoride and 2-deoxy-2-[18F]fluoro-d-glucose within the mouse. The image data were co-registered to a common coordinate system using the fiducials and resampled to an isotropic 0.1 mm voxel size. Using interactive editing tools, several organs were segmented and labeled.
The final atlas consists of the 3D volume (in which the voxels are labeled to define the anatomical structures listed above) with co-registered PET, X-ray CT, and cryosection images and can be used in 3D BLI simulations and PET image reconstruction [15].
High-Resolution SD Rat Atlas
Xueling et al. built a high-resolution 3D anatomical atlas of a healthy adult SD rat from 9,475 horizontal cryosection images (at 20 μm thickness). Coronal and sagittal section images were digitized from the horizontal sections and anatomical structures under the guidance of an experienced anatomist. The 3D computerized model of the rat anatomy was generated using a parallel reconstruction algorithm and interactive atlas-viewing software was developed that offers orthoslice visualization, featuring zoom, anatomical labeling, and organ measurement. Also, an interactive 3D organ browser based on a virtual reality modeling language was deployed on a website. The models of each organ and tissue constructed from the images were used for calculations of absorbed dose from external photon sources [16,17].
Figure 9 in the Appendix provides a visual comparison between the original atlases described above. While the MOBY and Digimouse atlases are quite similar in content, they differ in terms of the species of the mouse, the types of organs defined, resolution, and in the modalities from which they were constructed. Also, the MOBY atlas includes a model of cardiac and respiratory motion. In Table 4 in the Appendix, an overview of the main differences between these three atlases is presented.
Articulated Atlas Construction
In all the abovementioned atlases, the included skeletons do not distinguish between single bones and joints. To render the registration performance independent of the data acquisition protocol and large postural variations due to postural heterogeneity between scans, we present a segmentation of the skeleton into individual bones and add anatomically realistic kinematic constraints to each joint.
Segmenting the Skeleton
The first step was to manually segment the following bones/bone groups in each atlas from the skeleton using the Amira™ V3.1 software [18], guided by anatomical text books [19,20], and a high resolution CT scan of a real mouse: scapula, humerus (upper front limb), clavicula (collarbone, rat only), ulna-radius (lower front limb), manus (front paw), femur (upper hind limb), tibia-fibula (lower hind limb), pes (hind paw), caput (skull), columna vertebralis (spine), costae (ribs), sternum (chest bone), and pelvis. The resulting labeled skeletons for each atlas can be seen in Fig. 2.
Fig. 2.
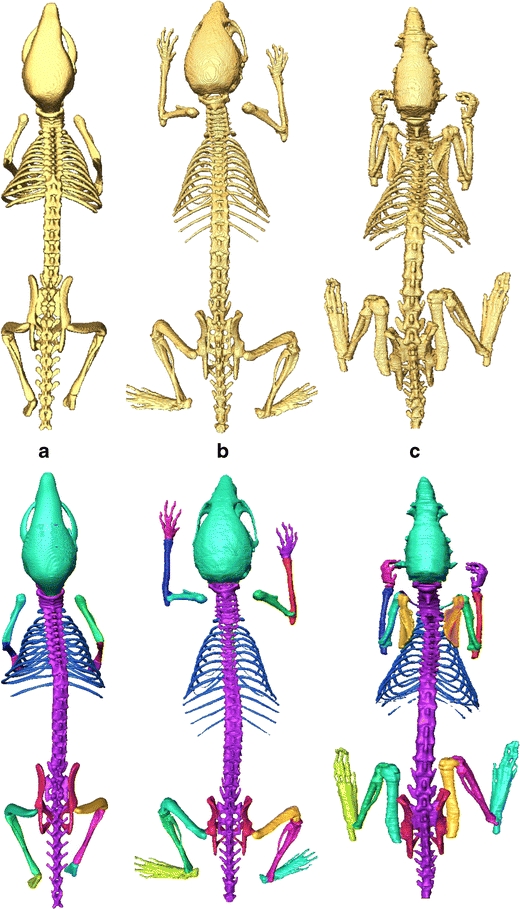
Illustration of the three segmented skeletons for each atlas: top row—before partitioning, bottom row—after partitioning. a MOBY, b Digimouse, and c SD Rat
Introducing Joint Kinematics
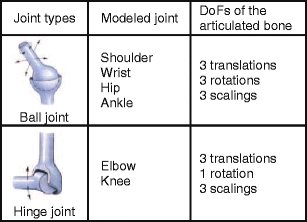
In the second step, a kinematic model for each atlas was built, i.e., each joint position was identified and the corresponding DoFs were specified. Two types of joints were distinguished: ball joints and hinge joints.
In Table 1, the DoFs for the ball and hinge joints can be seen. These DoFs are anatomically correct and were defined according to expert specifications described in literature [19,20].
Table 1.
Atlas-Based Whole-Body Registration/Segmentation of Small Animals Datasets
The skeleton is the rigid frame of the animal, in the sense of tissue stiffness. Besides the articulations of individual bones with respect to each other, little deformation takes places in the bones themselves within the same animal. This is in contrast to, e.g., organs, which highly vary in shape, depending on the posture of the animal. Therefore, a robust registration strategy should be based on the skeleton. Although there are approaches in literature that perform small animal whole-body image registration based on the entire skeleton [23,24], these methods may fail if large postural variations among different animals or among the same animal in a follow-up study occur.
Therefore, we propose an approach that employs the articulated skeleton model as described above for registration of the skeleton in a first step. Organs are non-rigidly matched in a second step, initialized by the result of the skeleton matching.
Skeleton Registration
The more distal a given bone is in the skeleton, the more variable its position between acquisitions is. Therefore, if datasets of several mice are globally aligned to each other, the location of the skulls is more similar than for instance that of the paws. Given that the entire atlas skeleton is coarsely aligned to a target dataset in a first step, all bones can subsequently be matched individually by executing the registration from proximal to distal bone segments. The registration of a distal segment is thereby constrained by the joint type of the proximal bone it connects to. For example, for the tibia, the registration is constrained by the DoFs of the knee joint. The deformation model that is required for the individual bones depends on the type of study and may vary between rigid (intra-subject) and non-rigid (inter-subject) deformation models. The selected registration criterion depends on the modality of interest. It can be a point-based (e.g., Euclidean distance), surface-based (e.g., Euclidean distance and surface curvature), or volume-based registration criterion (e.g., Normalized Mutual Information). In this paper, we limited ourselves to a surface-based registration measure, i.e., the Euclidean distance between two surfaces. Since the registration has to deal with large articulations, potentially pathological data (as a result of bone resorption) and inter-subject data, a rigid transformation model including non-isotropic scaling was chosen. This renders the registration robust to pathological cases while still taking different bone sizes into account. The registration was embedded in the Iterative Closest Point [25] framework and optimized using an interior-reflective Newton method.
Organ Registration
The registered skeleton allows us to initialize the registration of several other major organs, because their location is strongly dependent on the animal posture. To realize this, the transformation model should be chosen such that it can handle the large deformations that can occur for soft tissues. Many methods have been proposed for registration of individual organs (see e.g., [26,27] for reviews), which are not discussed further here. In the applications described next, we selected thin-plate-spline (TPS) interpolation [28]. The required anatomical landmarks that define the TPS mapping are primarily derived from the registered skeleton. To this end, we compute a sparse set of initial correspondences on the animal skin by selecting the skin points closest to a set of anatomical landmarks on the skeleton (e.g., the joints). From this sparse set of skin points, a denser set of point correspondences is calculated by means of an iterative matching of local distributions of geodesic distances [21]. This results in a set of correspondences on the skin and on the skeleton, which in combination define the TPS interpolants.
Evaluation Metrics for Registration Accuracy
To evaluate the accuracy of the registration algorithm for the skeleton, skin, and organs, three different error metrics were defined [21]:
Joint localization error is calculated as the Euclidean distance between corresponding anatomical landmarks (point-to-point distance). To this end, the locations of the upper lower limb and the lower limb-paw joints of all datasets were indicated manually using the extracted skeleton surfaces. For validation, the manually determined joint locations were compared to those automatically determined by registration of the skeleton.
Euclidean point-to-surface distance was determined to quantify border positioning errors. It was used to evaluate the registration error over the surface of the entire skeleton and skin.
- Dice coefficients of volume overlap [29] were computed to assess the organ interpolation performance. The Dice coefficient is widely used in literature to assess segmentation accuracy by evaluation of the spatial overlap of a manual and an automated segmentation. It is a voxel-based measure and therefore includes differences in object sizes as well as spatial misalignment [30]. Given the absolute volumes of a manual segmentation result Vm and an automated segmentation result Va, the Dice coefficient is defined as the intersection of the volumes, divided by the average volume:

1
Applications
In this section, two application examples are presented that employ the articulated skeleton model for analysis of follow-up, cross-sectional, and multimodality small animal imaging studies. Each application was quantitatively validated.
Atlas to microCT Registration for Follow-Up and Cross-Sectional microCT Studies
Whole-Body Segmentation Based on Articulated Skeleton Registration
Anatomical referencing of molecular events inside the animal using non-contrast-enhanced microCT is difficult, because although the skeleton can be extracted easily from the data as a whole it is often required to know exactly in which bone the molecular event takes places and because the poor soft-tissue contrast in the abdomen complicates organ localization and renders registration very difficult. Above that, microCT is often used in oncological studies to assess metastatic activity in bone, and since the locations where possible metastases can develop greatly varies, a very flexible data acquisition protocol with respect to animal positioning in the scanner is required. For such applications, animal posture, shape, and limb position may vary substantially.
To deal with the challenges specific to microCT, we employ the fully automated articulated atlas-based skeleton and organ segmentation method for non-contrast-enhanced whole-body data of mice [21] described in the section above. The skeleton is represented with a surface, derived from the modified MOBY atlas.
To test the proposed method, data acquired during a study of the metastatic behavior of breast cancer cells were used. Breast cancer has a preference to metastasize to bone, and at the location of a metastatic lesion, osteolysis occurs, causing structural damage in the skeleton (fractures or completely resorbed bones). The subject was injected with luciferase positive human MDA-MB-231 breast cancer cells into the cardiac left ventricle. The animal was scanned 40 days after cell injection to screen for possible small amounts of photo-emitting tumor cells in bone marrow/bone mimicking microCT-metastatic spread. Nine anesthetized mice (Balb/c, Charles River WIGA, Sulzfeld, Germany), 6–9 week old, eight female, one male, with a mean weight of 22.23 ± 2.18 g, were acquired with a Skyscan™ (Kontich, Belgium) 1178 microCT scanner. Fourteen 3D data volumes of the nine mice were acquired with step size 1°, 50 keV X-ray voltage, an anode current of 200 μA, an aluminum filter of 0.5 mm thickness, an exposure time of 640 ms, and without using a contrast agent. The reconstructed datasets covered the range between −1,000 (air) and +1,000 (bone) Hounsfield units. Neither cardiac nor respiratory gating was used. The mice were scanned in arbitrary prone and supine postures and arbitrary limb positions.
Table 2 shows the joint localization and point to surface errors for before and after registering the articulated atlas skeleton, lungs, and skin to the data. Subsequently, the brain, heart, liver, kidneys, spleen, and stomach were mapped from the atlas to the subject using TPS interpolation [21]. The result is a segmentation of the animal body into individual bones and major organs. This can be used for qualitative assessment of morphology at a single point in time in one or more animals—a cross-sectional study (Fig. 3), or to follow morphological changes over time—a follow-up study (Fig. 4). To facilitate the comparison of cross-sectional and follow-up data, also visualization concepts were developed that are based on mapping the data to a common reference frame and present the results simultaneously (Fig. 5).
Table 2.
Skeleton, lungs, and skin registration results. The results are separated in two columns: before registration, i.e.: after the initialization alone and after registration. For the bone, the used error metric is the joint localization error, while for the lungs, skin, and the whole skeleton, it is the point to surface distance
| Before registration | After registration | |
|---|---|---|
| Joint localization error (mm) | ||
| Right knee | 14.29 ± 5.51 | 0.75 ± 0.29 |
| Right ankle | 18.70 ± 5.87 | 1.82 ± 1.01 |
| Left knee | 16.61 ± 4.80 | 0.77 ± 0.26 |
| Left ankle | 19.93 ± 5.15 | 1.69 ± 1.14 |
| Right elbow | 5.66 ± 2.11 | 1.31 ± 0.44 |
| Right wrist | 15.56 ± 4.49 | 1.27 ± 0.53 |
| Left elbow | 5.23 ± 2.96 | 1.23 ± 0.39 |
| Left wrist | 18.04 ± 6.47 | 1.21 ± 0.56 |
| Euclidean point to surface distance (mm) | ||
| Entire skeleton | 3.68 ± 0.77 | 0.58 ± 0.03 |
| Lungs | 1.27 ± 0.26 | 0.47 ± 0.03 |
| Skin | 11.06 ± 8.49 | 0.75 ± 0.53 |
Fig. 5.
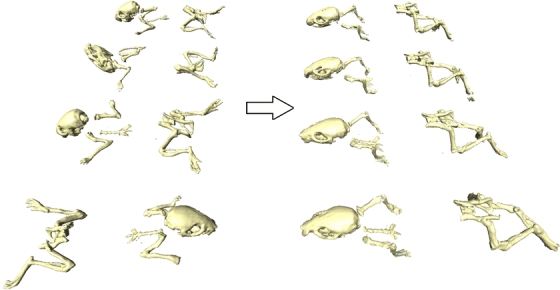
Demonstration of mapping the registered bones of four different animals from the corresponding target domain to a common reference domain (the MOBY atlas domain). The large postural differences of the animals (left) are not present any more (right), enabling a more intuitive comparison of different time points.
Multimodality Registration, Visualization, and Analysis Combination of BLI and Segmented microCT Data
BLI is an imaging technique that has found widespread application in preclinical research over the past years. It is used to track cells and monitor the function of specific genes and processes in the cellular biochemistry with a high sensitivity in living animals. A typical application domain is oncology, where researchers aim at monitoring the development of metastases using a highly sensitive optical modality, BLI, and relate it to morphological changes using an anatomical modality like microCT [31,32].
Since BLI does not show anatomical information, it is often overlaid on multiple 2D photographs from different angles around the animal. This, however, has the disadvantage that anatomical referencing is limited to the animal skin and, therefore, allows only coarse source localization. Thus, a combination with a real 3D anatomical modality like microCT is preferable. This requires a BLI to CT registration approach.
The BLI data in this work were acquired using the Xenogen IVIS Imaging System, 3D series scanner by Caliper LifeSciences™ (Alameda, USA). The data were collected from a study with two experiments in mice on the metastatic behavior of breast cancer cells as to visually verify the reconstructed BLI sources with the injection site as seen in the microCT data. One hundred thousand RC21-luc cells-luciferase expressing human renal carcinoma cell line and 100 μl 100,000 KS483-HisLuc cells-luciferase-expressing murine mesenchymal stem cell line were injected under the renal capsule and into the left heart ventricle, respectively, and scanned after 3 to 4 weeks (time for the carcinoma to establish).
Two alternative ways have been worked out to perform the BLI to CT registration. A semi-automated method, which requires manual selection of at least three anatomical landmarks both on the photographs, and the CT data were implemented. Subsequently, these corresponding landmarks are used to map one data domain to the other. As a second approach, a fully automated way to perform this registration was implemented. Based on the skin contours on the photographs, a 3D distance map is derived and used for registration of the animal skin, derived from CT [33]. In addition, the atlas to CT mapping as described above can be applied as well. The result is a fully segmented animal that serves for anatomical referencing if combined with a qualitative BLI source localization algorithm (e.g., [34]) as shown in Fig. 6. The quantitative results for the articulated skeleton atlas to microCT registration are the following: entire skeleton—before registration 4.25 ± 12.25 mm, after registration 0.63 ± 1.04 mm; lungs—before registration 1.27 ± 2.44 mm, after registration 0.50 ± 1.35 mm.
Fig. 6.
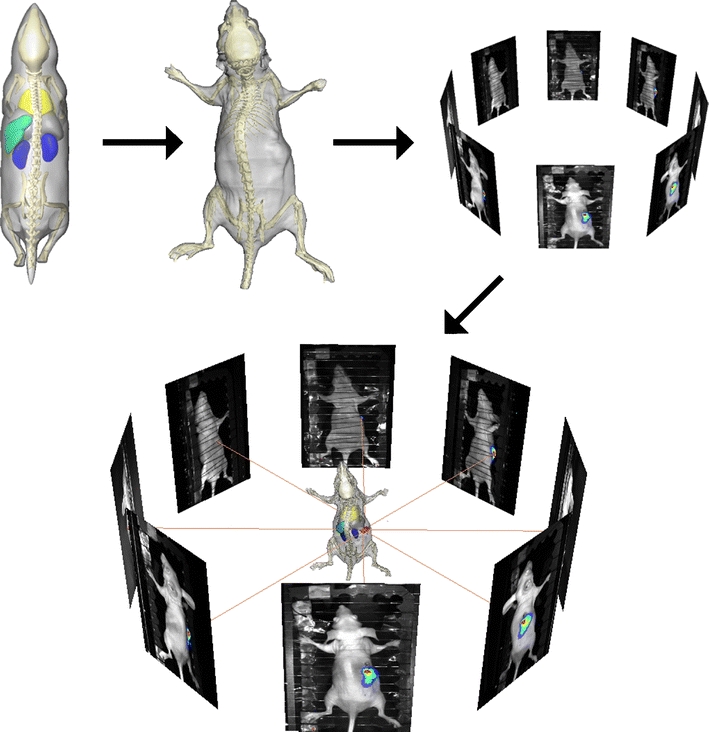
Overview of the steps towards a combined visualization of fully segmented whole-body microCT and BLI data. The MOBY atlas is registered to the microCT data and subsequently, the microCT data are registered to the BLI data using the photographs either by using manually selected landmarks or fully automatically using a 3D distance map (see text). In the resulting visualization, the BLI source (red) is shown and can be related to the skeleton and organs.
Atlas to μMRI Approximation
Organ and Bone Approximation for Ex Vivo Mouse Data
Since microMRI data provide greater contrast between the different soft tissues of the body but poorer bone contrast than CT data, it can be used to closely follow the changes in phenotype in studies that require genetic modifications.
A novel semi-automated organ approximation method for μMRI mouse data that considerably reduces the required user effort compared to manual segmentation was implemented. It includes the limbs and provides a shape approximation of the bones in MR data. To derive the set of skin correspondences, the user interactively points out the joints/bone landmarks guided by anatomically realistic kinematic constraints imposed by the articulated atlas. Given this set of dense skin correspondences, the organ approximation is performed using the TPS approximation as described in the “Methods” section. The bone approximation is performed by (1) automatically identifying all the joints out of the manually indicated landmarks and (2) applying a scaling and rotation to the atlas bone surfaces [35].
This MRI segmentation method was tested on female C3H mice perfusion fixed with formalin and 10 mM Magnevist with ultrasound guidance [36]. Imaging was performed on a 7T magnet with a four-channel VarianINOVA™ console (Varian Inc., Palo Alto, CA) multiplexed to 16 coils for parallel imaging. A spin echo sequence was used: TR/TE = 650/15 ms and (100 μm)3 voxels with an imaging time of 13 h.
Application of the registration resulted in segmentations of the limbs and six major organs: heart, spleen, lungs, kidneys, liver, and stomach. See Figs. 7 and 8 where the obtained results are presented both in 2D-and 3D visualizations, respectively. Table 3 shows the Dice coefficients for four major organs (heart, lungs, kidneys, and liver).
Fig. 7.
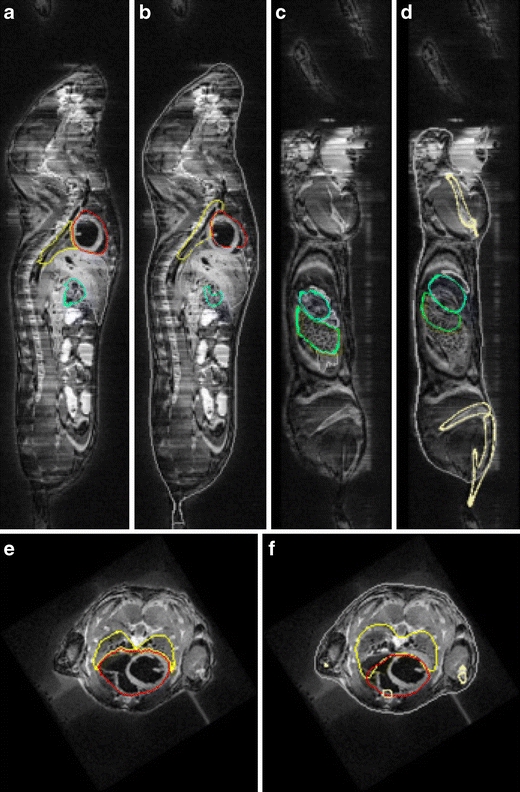
Organ and bone approximation results for microMRI mouse data: a, c, e manual organ segmentation. b, d, f organ and bone approximation results. Coronal and sagittal planes, respectively. yellow lungs, red heart, green spleen, cyan stomach, cream bone, gray skin, white liver. Reproduced from [35] with permission.
Fig. 8.
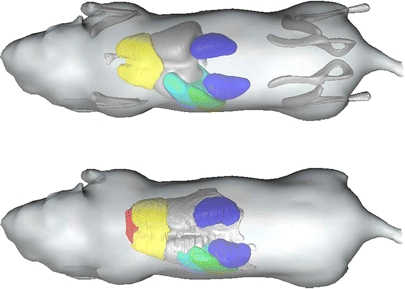
Top Atlas-based bone and organ approximation. Bottom Manual organ segmentation.
Table 3.
Organ approximation results for 3 μMRI mouse datasets: dice coefficients for four major organs—heart, lungs, kidneys, and liver. The last three columns provide a comparison with results obtained by Chaudari et al. [37], Baiker et al. [38], and Joshi et al. [39] for μCT data mouse data Vs subject volume, Va atlas volume
| Mouse 1 | Mouse 2 | Mouse 3 | [37] | [38] | [39] | |||||||
|---|---|---|---|---|---|---|---|---|---|---|---|---|
| Vs(mm3) | Va(mm3) | Dice | Vs (mm3) | Va (mm3) | Dice | Vs (mm3) | Va (mm3) | Dice | Dice | Dice | Dice | |
| Heart | 292.62 | 227.16 | 0.65 | 282.36 | 241.83 | 0.80 | 292.56 | 202.19 | 0.74 | 0.4673 | 0.81 | 0.8161 |
| Lungs | 421.15 | 392.78 | 0.39 | 429.74 | 437.26 | 0.56 | 344.55 | 362.38 | 0.44 | 0.4871 | 0.82 | N/A |
| Kidneys | 264.57 | 268.10 | 0.43 | 301.28 | 268.94 | 0.72 | 305.68 | 231.27 | 0.72 | 0.4363 | 0.60 | 0.5899 |
| Liver | 1131.77 | 1776.11 | 0.63 | 1087.54 | 1939.77 | 0.68 | 1484.82 | 1551.95 | 0.63 | 0.6508 | 0.80 | N/A |
In all the abovementioned application examples, experiments were executed using MATLAB™ R2008b (The Mathworks, Natick, USA) and took always ≤6 min of runtime in a 2.40 GHz Intel Quad Core™, with 4 GB of RAM, Windows™ PC.
Discussion and Conclusions
This paper introduces three realistic, articulated skeleton phantoms derived from publicly available small animal atlases: Digimouse [15], MOBY mouse [14], and Rat atlas [16,17]. A number of application examples using the MOBY atlas for such articulated atlases were presented. Mainly, it was demonstrated that articulated atlases can be used in correcting the postural variation, in referencing optical to CT data and in organ approximation. By combining the atlas with the hierarchical anatomical model and articulated registration, whole-body skeleton registration could be performed robustly, even in the presence of large postural variations: all 14 microCT datasets could be registered successfully. For the skeleton, a registration accuracy within two-voxel dimensions was achieved. This performance is comparable to the results given in [23]. However, that method takes several hours while the method presented here takes less than 10 min. Regarding the joint localization error, suboptimal registration results can occur where two adjacent long bones are pointing in almost the same direction. In some of these cases, the resulting scaling factor along the longitudinal bone axis was the maximum value that was considered anatomically realistic (scaling by 15%). As a result, parts of the distal bones were erroneously assigned to target bone during registration. Due to animal placement during acquisition, this mainly is a problem for the ankle joint and is reflected in the somewhat higher error. Also, the results for the joint localization errors are comparable to those reported in literature [40].
The obtained results for the semi-automatic atlas to MRI data approximation were generally satisfactory and similar to the manual segmentations (heart, kidneys, liver), while for other organs the atlas approximations are more variable (organs with inherent shape variability such as the stomach and spleen), and errors were larger. The calculated Dice coefficients reveal “moderate” (0.41–0.6 [41]) performance for the lungs and mostly “substantial” (0.61–0.80) or “excellent” (>0.7 [42]) performance for heart, liver, and kidneys. The comparison of the calculated Dice coefficients with previously published results shows that while performing better than [37] and at a similar level as [39], the proposed method does not obtain as good results for the lungs as the method proposed in [38] (see Table 3). However, the example given in Fig. 6 reveals that the proposed TPS mapping of the mouse major organs leads to a realistic approximation and can be used by biologists for qualitative anatomical referencing. Also, in the context of the intended application of combining segmented 3D data and BLI, the achieved accuracy should suffice to define a heterogeneous tissue model for Bioluminescence Tomography; it has been shown [43] that integration of tissue-specific photon properties yields more accurate and quantitative BLI source reconstruction than a homogeneous tissue model.
At the moment, microCT data are required to perform the whole-body segmentation step. To be able to obtain whole-body segmentation also in the absence of microCT data, without putting restrictions on the positioning of the animals during data acquisition, a method is under development to register the modified Digimouse atlas to a 3D distance map, which is derived from multiple photographs. This is especially interesting for cases, where researchers are interested mainly in quantification of the light source. If morphological changes have to be studied in detail over time, a microCT scan would still be required. However, since these usually occur at a later point in time, CT data acquisition could be omitted at early time points and therefore reduce radiation burden of the animals.
The strategy applied here to make the atlases articulated was outlined to deal with major postural variations (involving long bones or large bone complexes); however, it can be extended to the whole skeleton to cope with any minor variation. One can define a kinematic model for each vertebra of the columna vertebralis (whereas here the columna vertebralis is defined as one big bone complex) and even to some non-rigid organs. Also, it is important to refer that often, depending on the task at hand, the DoFs for each bone/bone complex can be defined or redefined accordingly (e.g., in [21] some additional DoFs were allowed, although they are anatomically unnecessary, to compensate for errors that have been made during the specific task of whole-body atlas to 3D mouse data registration).
The presented articulated models were made publicly available and can be downloaded from the “Articulated Atlas Downloads” section of the following web address: www.lkeb.nl.
Acknowledgments
We would like to acknowledge the people involved in the building process of the three “original” atlases in the research groups of Segars et al., Dogdas et al., and Bai et al. We would also like to thank Ivo Que from Clemens Löwik’s group and Josette Chen from Mark Henkelman’s group for providing the data used to validate the proposed algorithms. Financial support from Medical Delta is gratefully acknowledged. Peter Kok is acknowledged for the carousel CT/BLI/Atlas visualization acquired using the CVP software.
Conflict of Interest Disclosure The authors declare that they have no conflict of interest.
Appendix
Comparison of the Three Original Atlases
Fig. 9.
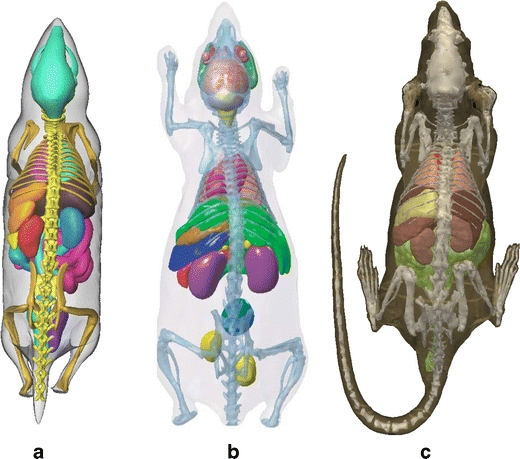
Illustration of the three original atlases: a MOBY, b Digimouse, and c SD Rat.
Table 4.
Comparison between the three atlases.
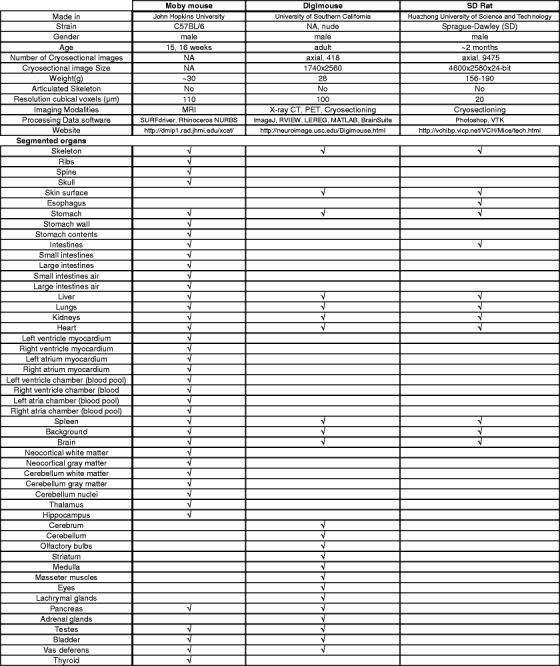
√ indicates whether a specific organ is present in one of the described atlases
Footnotes
Artem Khmelinskii and Martin Baiker contributed equally to this work.
References
- 1.Talairach J, Tournoux P. Co-planar stereotaxic atlas of the human brain: 3-dimensional proportional system—an approach to cerebral imaging. New York: Thieme; 1988. [Google Scholar]
- 2.The visible human project, http://www.nlm.nih.gov/research/visible/visible_human.html
- 3.Segars WP, Lalush DS, Tsui BMW. Modeling respiratory mechanics in the MCAT and spline-based MCAT phantoms. IEEE T Nucl Sci. 2001;48(1):89–97. doi: 10.1109/23.910837. [DOI] [Google Scholar]
- 4.Zaidi H, Tsui BMW. Review of computational anthropomorphic anatomical and physiological models. P IEEE. 2009;97(12):1938–1953. doi: 10.1109/JPROC.2009.2032852. [DOI] [Google Scholar]
- 5.Toga AW, Santori EM, Hazani R, Ambach K. A 3D digital map of rat brain. Brain Res Bull. 1995;38(1):76–85. doi: 10.1016/0361-9230(95)00074-O. [DOI] [PubMed] [Google Scholar]
- 6.Broadwell RD, Bleier R. A cytoarchitectonic atlas of the mouse hypothalamus. J Comp Neurol. 1976;167(3):315–339. doi: 10.1002/cne.901670304. [DOI] [PubMed] [Google Scholar]
- 7.Celio MR, Hof PR, Bloom FE, Young WG. Soc Neurosci Abst. 1998;24:1065–1065. [Google Scholar]
- 8.MacKenzie-Graham A, Lee EF, Dinov I, Bota M, Shattuck DW, Ruffins S, et al. A multimodal, multidimensional atlas of the c57bl/6j mouse brain. J Anat. 2004;204:93–102. doi: 10.1111/j.1469-7580.2004.00264.x. [DOI] [PMC free article] [PubMed] [Google Scholar]
- 9.Rosen GD, Williams AG, Capra JA, Connolly MT, Cruz B, Lu L, et al. The mouse brain library. Int Mouse Genome Conference. 2000;14:166. [Google Scholar]
- 10.Thompson PM, Mega MS, Narr KL, Sowell ER, Blanton RE, Toga AW. Brain image analysis and atlas construction. In: Sonka M, Fitzpatrick JM, editors. Medical image processing and analysis. New York: Academic; 2000. pp. 1063–1119. [Google Scholar]
- 11.Brune RM, Bard JBL, Dubreuil C, Guest E, Hill W, Kaufman M, et al. A three-dimensional model of the mouse at embryonic day 9. Dev Biol. 1999;216:457–468. doi: 10.1006/dbio.1999.9500. [DOI] [PubMed] [Google Scholar]
- 12.Dhenain M, Ruffins SW, Jacobs RE. Three-dimensional digital mouse atlas using high-resolution MRI. Division Biol. 2001;232:458–470. doi: 10.1006/dbio.2001.0189. [DOI] [PubMed] [Google Scholar]
- 13.Santi PA, Nietfeld J (2002) Development of a mouse cochlea database. ARO Session K4 Inner Ear Anatomy 2:Abst 376
- 14.Segars WP, Tsui BMW, Frey EC, Johnson GA, Berr SS. Development of a 4D digital mouse phantom for molecular imaging research. Mol Imag Biol. 2004;6(3):149–159. doi: 10.1016/j.mibio.2004.03.002. [DOI] [PubMed] [Google Scholar]
- 15.Dogdas B, Stout D, Chatziioannou A, Leahy RM. Digimouse: a 3D whole body mouse atlas from CT and cryosection data. Phys Med Biol. 2007;52(3):577–587. doi: 10.1088/0031-9155/52/3/003. [DOI] [PMC free article] [PubMed] [Google Scholar]
- 16.Bai X, Yu L, Liu Q, Zhang J, Li A, Han D, et al. A high-resolution anatomical rat atlas. J Anat. 2006;209(5):707–708. doi: 10.1111/j.1469-7580.2006.00645.x. [DOI] [PMC free article] [PubMed] [Google Scholar]
- 17.Wu L, Zhang G, Luo Q, Liu Q. An image-based rat model for Monte Carlo organ dose calculations. Med Phys. 2008;35(8):3759–3764. doi: 10.1118/1.2952647. [DOI] [PubMed] [Google Scholar]
- 18.Amira, http://www.amiravis.com
- 19.Cook MJ. Anatomy of the laboratory mouse. New York: Academic; 1965. [Google Scholar]
- 20.Bab I, Hajbi-Yonissi C, Gabet Y, Müller R. Micro-tomographic atlas of the mouse skeleton. New York: Springer; 2007. [Google Scholar]
- 21.Baiker M, Milles J, Dijkstra J, Henning T, Weber AW, Que I, et al. Atlas-based whole-body segmentation of mice from low-contrast Micro-CT data. Med Image Anal. 2010;14(6):723–737. doi: 10.1016/j.media.2010.04.008. [DOI] [PubMed] [Google Scholar]
- 22.Martini FH, Timmons MJ, Tallitsch RB, Ober WC, Garrison CW, Welch K, et al. Human anatomy. 5. San Francisco: Pearson Education-Benjamin Cummings; 2006. [Google Scholar]
- 23.Li X, Yankeelov TE, Peterson TE, Gore JC, Dawant BM. Automatic nonrigid registration of whole body CT mice images. Med Phys. 2008;35:1507–1520. doi: 10.1118/1.2889758. [DOI] [PMC free article] [PubMed] [Google Scholar]
- 24.Somayajula S, Joshi AA, Leahy RM (2008) Mutual information based non-rigid mouse registration using a scale-space approach. Proc IEEE Int Symp Biomedical Imaging. 1147–1150
- 25.Besl PJ, McKay ND. A method for registration of 3D shapes. IEEE T Pattern Anal. 1992;14:239–256. doi: 10.1109/34.121791. [DOI] [Google Scholar]
- 26.Maintz JBA, Viergever MA. A survey of medical image registration. Med Image Anal. 1998;2:1–36. doi: 10.1016/S1361-8415(01)80026-8. [DOI] [PubMed] [Google Scholar]
- 27.Zitova B, Flusser J. Image registration methods: a survey. Image Vision Comput. 2003;21:977–1000. doi: 10.1016/S0262-8856(03)00137-9. [DOI] [Google Scholar]
- 28.Bookstein FL. Principal warps - Thin-Plate Splines and the decomposition of deformations. IEEE T Pattern Anal. 1989;11:567–585. doi: 10.1109/34.24792. [DOI] [Google Scholar]
- 29.Dice L. Measures of the amount of ecologic association between species. Ecology. 1945;26:297–302. doi: 10.2307/1932409. [DOI] [Google Scholar]
- 30.Zijdenbos AP, Dawant BM, Margolin RA. Morphometric analysis of white-matter lesions in MR-images - method and validation. IEEE T Med. Imaging. 1994;13:716–724. doi: 10.1109/42.363096. [DOI] [PubMed] [Google Scholar]
- 31.Kaijzel EL, Pluijm G, Löwik CWGM. Whole-body optical imaging in animal models to assess cancer development and progression. Clin Cancer Res. 2007;13(12):3490–3497. doi: 10.1158/1078-0432.CCR-07-0402. [DOI] [PubMed] [Google Scholar]
- 32.Kaijzel EL, Snoeks TJA, Buijs JT, Pluijm G, Löwik CWGM. Multimodal imaging and treatment of bone metastasis. Clin Exp Metastasis. 2007;26(4):371–379. doi: 10.1007/s10585-008-9217-8. [DOI] [PubMed] [Google Scholar]
- 33.Wildeman MH, Baiker M, Reiber JHC, Löwik CWGM, Reinders MJT, Lelieveldt BPF (2009) 2D/3D registration of micro-CT data to multi-view photographs based on a 3D distance map. Proc IEEE Intl Symp Biomedical Imaging 987–990
- 34.Kok P, Dijkstra J, Botha CP, Post FH, Kaijzel E, Que I, et al. Integrated visualization of multi-angle bioluminescence imaging and micro CT. Proc SPIE Medical Imaging. 2007;6509:1–10. [Google Scholar]
- 35.Khmelinskii A, Baiker M, Chen XJ, Reiber JHC, Henkelman RM, Lelieveldt BPF (2010) Atlas-based organ & bone approximation for ex-vivo μMRI mouse data: a pilot study. IEEE Intl Symp Biomedical Imaging. 1197–1200
- 36.Zhou YQ, Davidson L, Henkelman RM, Nieman BJ, Foster FS, Yu LX, et al. Ultrasound-guided left-ventricular catheterization: a novel method of whole mouse perfusion for microimaging. Lab Invest. 2004;84(3):385–389. doi: 10.1038/labinvest.3700038. [DOI] [PubMed] [Google Scholar]
- 37.Chaudhari AJ, Joshi AA, Darvas F, Leahy RM (2007) A method for atlas-based volumetric registration with surface constraints for optical bioluminescence tomography in small animal imaging. Proc SPIE Medical Imaging 6510. Part 2:651024
- 38.Baiker M, Dijkstra J, Que I, Löwik CWGM, Reiber JHC, Lelieveldt BPF (2008) Organ approximation in μCT data with low soft tissue contrast using an articulated whole-body atlas. Proc IEEE Intl Symp Biomedical Imaging 1267–1270
- 39.Joshi AA, Chaudhari AJ, Shattuck DW, Dutta J, Leahy RM, Toga AW Posture matching and elastic registration of a mouse atlas to surface topography range data. Proc IEEE Intl Symp Biomedical Imaging 366–369 [DOI] [PMC free article] [PubMed]
- 40.Li X, Yankeelov TE, Peterson TE, Gore JC, Dawant BM. Constrained non-rigid registration for whole body image registration: method and validation. Proc SPIE Medical Imaging. 2007;6512:651202-1–651202-8. [Google Scholar]
- 41.Landis JR, Koch GG. The measurement of observer agreement for categorical data. Biometrics. 1977;33(1):159–174. doi: 10.2307/2529310. [DOI] [PubMed] [Google Scholar]
- 42.Bartko JJ. Measurement and reliability: statistical thinking considerations. Schizophr Bull. 1991;17(3):483–489. doi: 10.1093/schbul/17.3.483. [DOI] [PubMed] [Google Scholar]
- 43.Alexandrakis G, Rannou FR, Chatziioannou AF. Tomographic bioluminescence imaging by use of a combined optical-PET (OPET) system: a computer simulation feasibility study. Phys Med Biol. 2005;50(17):4225–4241. doi: 10.1088/0031-9155/50/17/021. [DOI] [PMC free article] [PubMed] [Google Scholar]


