Abstract
We have previously shown that supplementation with 17β-estradiol (E2) from the onset of diabetes attenuates the development of diabetic renal disease. The aim of this study was to examine if E2 can also attenuate the disease process once it has already developed. The study was performed in non-diabetic (ND) and streptozotocin (STZ)-induced diabetic (D) Sprague-Dawley rats. E2 supplementation began after 9 weeks of diabetes for further 8 weeks. Diabetes was associated with an increase in urine albumin excretion (UAE) (ND; 9.4±1.0; D, 56.2±8.9 mg/day; P<0.001), glomerulosclerosis (GSI; ND, 0.13±0.02; D, 1.38±0.09 AU; P<0.01), tubulointerstitial fibrosis (TIFI; ND, 0.17±0.04; D, 1.35±0.10 AU; P<0.01), renal cortical collagen type I (CI; ND, 1.02±0.05; D, 1.83±0.03 ROD; P<0.001), collagen type IV (CIV; ND, 0.97±0.05; D, 1.56±0.03 ROD, P<0.01), laminin (L; ND, 1.03±.0.03; D, 1.80±0.02 ROD; P<0.001), PAI-1 (ND, 0.34±0.08; D, 0.88±0.03 ROD; P<0.01), TIMP-1 (ND, 0.30±0.07; D, 0.93±0.14 ROD; P<0.01), TIMP-2 (ND, 0.40±0.09; D, 0.96±0.11 ROD; P<0.01), TGF-β (ND; 0.70±0.14; D, 1.63±0.08 ROD; P<0.001), TGF-βRI (ND, 0.69±0.23; D, 1.47±0.14 ROD; P<0.05), TGF-βRI (ND, 0.40±0.09; D, 1.07±0.10 ROD; P<0.001), Smad2/3 (ND, 0.68±0.08; D, 1.71±0.03 ROD; P<0.01), pSmad2/3 (ND, 0.28±0.07; D, 0.74±0.12 ROD, P<0.05) and Smad4 (ND, 0.82±.0.24; D, 1.77±0.03 ROD; P<0.05) protein expression and CD68-positive cells (ND, 5.0±0.8; D, 33.8±2.4 cells/mm2; P<0.001). Decreases in MMP-2 (ND, 1.35±0.06; D, 0.98±0.05 ROD; P<0.05) protein expression and activity (MMP-2 act; ND, 0.39±0.09; D, 0.22±0.01 ROD; P<0.05), Smad6 (ND, 0.85±0.10; D, 0.40±0.03 ROD; P<0.001) and Smad7 (ND, 1.41±0.06; D, 1.01±0.05 ROD; P<0.05) protein expression were also associated with D. E2 supplementation either completely or partially attenuated these changes. We conclude that E2 attenuates the progression of disease once it has already developed via regulating extracellular matrix, TGF-β and expression of its downstream regulatory proteins.
Keywords: diabetes, kidney, estrogen, extracellular matrix, fibrosis, glomerulosclerosis, transforming growth factor-beta, Smads
INTRODUCTION
While the female sex appears to be a protective factor against the development of non-diabetic renal disease (45, 50, 67), this protection is lost in diabetes. The incidence and the rate of progression of renal disease is far greater in diabetic than in non-diabetic women (9, 13, 50), suggesting that the diabetic milieu provides a stage for the development and faster progression of renal disease in women. Our previous studies suggested that the possible reasons for the loss of the female sex as a protective factor in diabetes are reduced levels of plasma estradiol and abnormal regulation of estrogen receptors in the diabetic kidney (40, 74). Furthermore, these studies showed that supplementation with 17β-estradiol (E2) from the onset of diabetes restored the levels of estradiol to those observed in non-diabetics, and protected against the development of diabetic renal injury (40). One of the mechanisms through which E2 exerts this renoprotection is through regulating extracellular matrix (ECM) protein expression (39, 40).
Increased extracellular matrix (ECM) protein synthesis and/or decreased ECM degradation contribute to the development of diabetes-associated glomerulosclerosis and tubulointerstitial fibrosis (42, 76, 80). It is now well recognized that the rate of progression of diabetic renal disease correlates with the degree of cortical tubulointerstitial fibrosis (22, 47, 56, 59). Thus, attenuating ECM accumulation and/or enhancing ECM degradation is considered a prime target in the treatment of diabetic renal complications.
Transforming growth factor-beta (TGF-β) is a key regulator of ECM protein synthesis and degradation in the diabetic kidney (7, 8, 11, 27, 28, 72). TGF-β has consistently been shown to be upregulated in renal parenchymal and infiltrating inflammatory cells in the diabetic kidney, both in humans and experimental models (4, 7, 27, 28, 79). A number of factors have been shown to stimulate TGF-β protein expression in the diabetic kidney, including hyperglycemia (31, 63, 73), advanced glycation end-products (52, 75), oxidative stress (68), mechanical stretch (24) and numerous vasoactive peptides such as angiotensin (12, 19, 73) and endothelin (63, 64). TGF-β exerts its effects through firstly binding to the membrane-bound TGF-β type II (TGF-βRII) and subsequent activation of the TGF-β type I receptor (TGF-βRI) (8, 72). This receptor activation is followed by activation of the Smad regulatory pathway; firstly, Smad2 and Smad3 are phosphorylated, form a heteromeric complex with Smad4 and then the complex translocates into the nucleus where it regulates transcription of target genes (21, 31, 46). In contrast, Smad6 and Smad7 are inhibitory Smads that act in a negative feedback loop to inhibit TGF-β activity by preventing phosphorylation of Smad proteins and activation of TGF-βRI (72). Smad7 also inhibits TGF-β signaling by promoting TGF-β receptor degradation involving ubiquitin ligase Smurf2 (20, 70).
Our previous studies have shown that supplementation with E2 from the onset of diabetes, prevents albuminuria, glomerulosclerosis and tubulointerstitial fibrosis associated with diabetic nephropathy, via regulating ECM synthesis and degradation (39, 40). While these studies show that E2 is able to attenuate diabetic renal injury when supplemented from the onset of diabetes, little is know about the ability of E2 to attenuate the progression of the disease once it has already developed. This is of particular importance since the vast majority of patients with diabetes present with either moderate or advanced renal injury, thus attenuating the disease progression is of high clinical relevance. The aim of the current study was to examine if E2 is also able to attenuate the progression of renal functional and structural changes once they have already been initiated by the diabetic milieu. Specifically, our study examined the effects of E2 supplementation on ECM protein expression and the expression of TGF-β and its downstream signaling proteins involving Smads and Smurf2 in the STZ-induced model of diabetic nephropathy.
MATERIALS AND METHODS
Animal model
Female Sprague Dawley rats (10 weeks of age) were purchased from Harlan (Madison, WI) and were maintained on a phytoestrogen-free rat chow (Harlan, Madison, WI) and tap water ad libitum. The animals were first randomly divided into 2 treatment groups: Non-diabetic (ND, n=8) and Diabetic (D, n=14) for 9 weeks. The diabetic animals were then further randomly divided into 2 treatment groups: Diabetic (D, n=7) and diabetic with E2 supplementation (D+E2, n=7). All animals, including the ND group, were treated for additional 8 weeks. After cumulative 17 weeks of treatment, the animals were weighed, anesthetized with sodium pentobarbitone (40 mg/kg ip) and blood collected (via cardiac puncture) for measurement of plasma E2 levels. The kidneys were weighed and then either snap frozen in liquid nitrogen for protein analysis or immersion fixed with HistoCHOICE (Amresco, Solon, OH) for morphological and immunohistochemical analysis. The experiments were performed according to the guidelines recommended by the National Institutes of Health and approved by the Georgetown University Animal Care and Use Committee.
Induction of diabetes
Following an overnight fast, the animals received either a single ip injection of 0.1 M citrate buffer (pH 4.5, ND) or 55 mg/kg streptozotocin (STZ, Sigma, St. Louis, MO) in 0.1 M citrate buffer (D and D+E2). Diabetic rats were supplemented with insulin (2–4 U sc. every second day, Lantus, Aventis Pharmaceuticals Inc., Kansas City, MO) for the duration of the study to maintain blood glucose levels between 250–450 mg/dl and prevent weight loss. Every 4 weeks, the animals were placed in metabolic cages for 24h for determination of urine output and measurement of UAE.
Estrogen supplementation and plasma Estradiol levels
At the time of induction of diabetes, the animals were subjected to two ip injections (4h apart) of Deslorelin acetate (10 μg/ml, Bachem Chemicals, Torrance, CA). The diabetic animals on E2 supplementation were injected with 17β-estradiol (5 μg/kg in 200 μl peanut oil, Sigma, St. Louis, MO) every 4 days, to mimic the cyclical nature of estrogen release, while animals not on E2 supplementation were injected with 200 μl peanut oil only. The dose of E2 was chosen based on our previous studies showing that this dose, when injected every 4 days results in circulating E2 levels that are in the peak physiological range (74). Plasma E2 levels were measured by ELISA (Alpha Diagnostic, San Antonio, TX) according to the manufacturer’s protocol.
Urine albumin excretion (UAE)
Urine albumin concentration was determined using the Nephrat II albumin kit (Exocell, Inc., Philadelphia PA), according to the manufacturer’s protocol. The rate of UAE was calculated from the measurement of urine albumin concentration and output.
Indices of glomerulosclerosis (GSI) and tubulointerstitial fibrosis (TIFI)
Glomerulosclerosis was defined as accumulation of extracellular matrix (ECM) deposits and mesangial expansion (1). The GSI was assessed in PAS-stained sections in 80 randomly selected glomeruli and the degree of sclerosis graded using a semi-quantitative scoring method as previously described (61). Tubulointerstitial fibrosis was defined as tubular atrophy or dilatation, deposition of ECM and presence of inflammatory cells (1). The TIFI was assessed in Masson’s trichrome-stained sections in 60 randomly selected fields of view at the magnification of X400 using a light microscope and the degree of fibrosis graded using a semi-quantitative scoring method as previously described (40).
Immunohistochemistry
In 4μm paraffin sections, endogenous avidin and biotin activities were blocked using a kit (Vector, Burlingame, CA). Sections were incubated with 0.1% albumin (for collagen type I and type IV) or with 10% non-immune goat serum (for other proteins) in phosphate buffered saline (PBS, pH 7.4) for blocking of non-specific immunolabeling. Sections were then incubated with antisera against proteins of interest (specific concentrations are given in the table below) at 4°C overnight. After washing with PBS, sections were incubated with biotinylated goat anti-rabbit, anti-mouse or anti-goat IgG (Dakopatts, Glostrup, Denmark) diluted 1:100 in PBS for 1 h at room temperature (RT), followed by incubation with the avidin-biotin complex (Vector, Burlingame, CA) diluted 1:100 with PBS for 1 h at RT. Positive immunoreaction was detected after incubation with 3,3-diaminobenzidine for 2 min at RT and counterstaining with Mayer’s hematoxylin. Sections incubated with 0.1% albumin or 10% goat serum instead of the primary antisera were used as negative controls.
Western blotting
Renal cortical tissue samples were homogenized and the protein concentration determined using a colorimetric assay (BioRad). For collagen type I and type IV, samples were analyzed under non-reducing conditions, while for other proteins, samples were denatured at 95°C for 10 minutes then treated according to the following conditions:
| Protein conc. | Ab. dil. IHC | % gel | Ab. dil. Western | Source | Manufacturer |
|---|---|---|---|---|---|
| Collagen type I (15 μg) | 1:200 | 4–20 | 1:1,000 | mouse | Sigma, St. Louis. MO |
| Collagen type IV | 1:400 | N/A | N/A | goat | Southern Biotech, Birmingham, AL |
| Collagen type IV(7 μg) | N/A | 4–20 | 1:1,000 | mouse | Chemicon, Temecula, CA |
| Laminin (30 μg) | 1:400 | 7.5 | 1:1,000 | rabbit | Research Diagnostics, Concord, MA |
| Fibronectin (30 μg) | 1:400 | 7.5 | 1:1,000 | mouse | Research Diagnostics |
| MMP-2 (50 μg) | 1:400 | 12.5 | 1:1,000 | Mouse | Oncogene, Cambridge, MA |
| MMP-9 (50 μg) | 1:400 | 12.5 | 1:1,000 | mouse | Oncogene |
| TIMP-1 (50 μg) | 1:100 | 18 | 1:100 | Mouse | Calbiochem, San Diego, CA |
| TIMP-2 (50 μg) | 1:100 | 18 | 1:100 | Mouse | Calbiochem |
| PAI-1 (38 μg) | 1:100 | 15 | 1:400 | goat | Santa Cruz, Santa Cruz, CA |
| TGF-β (30 μg) | 1:400 | 18 | 1:500 | rabbit | Santa Cruz |
| TGFβRI (30 μg) | 1:200 | 12.5 | 1:500 | rabbit | Santa Cruz |
| TGFβRII (30 μg) | 1:200 | 12.5 | 1:500 | rabbit | Santa Cruz |
| Smad2/3 (30 μg) | 1:200 | 12.5 | 1:500 | goat | Santa Cruz |
| pSmad2/3 (30 μg) | 1:200 | 12.5 | 1:500 | goat | Santa Cruz |
| Smad4 (30 μg) | 1:200 | 12.5 | 1:800 | goat | Santa Cruz |
| Smad6 (30 μg) | 1:200 | 12.5 | 1:800 | goat | Santa Cruz |
| Smad7 (30 μg) | 1:200 | 12.5 | 1:800 | goat | Santa Cruz |
| Smurf2 (30 μg) | 1:200 | 12.5 | 1:1,000 | goat | Santa Cruz |
| CD68 | 1:400 | N/A | N/A | mouse | Serotec, Oxford, UK |
Following incubation with primary antisera at 4°C overnight, the membranes were washed, incubated with either goat anti-rabbit or goat anti-mouse IgG conjugated to horseradish peroxidase and proteins visualized by enhanced chemiluminescence (KPL, Gaithersburg, MD). The densities of specific bands were normalized to the total amount of protein loaded in each well following densitometric analysis of gels stained with Coomassie blue. The densities of specific bands were quantitated by densitometry using the Scion Image beta (version 4.02) software.
Zymography
Renal cortical tissue samples were homogenized and the protein concentration determined using a colorimetric assay (BioRad). The homogenized samples were loaded onto a 10% SDS acrylamide gel containing 1 mg/ml gelatin (BioRad). After electrophoresis, the gel was incubated in renaturing buffer (Invitrogen, Carlsbad, CA), activated in developing buffer (Invitrogen) and gelatinase activity visualized by staining the gel with Coomassie blue. Bands were quantitated by densitometry using the Scion image beta (version 4.02) software.
Quantitative analysis of macrophage number
The number of macrophages (CD68-positive cells) was assessed by counting the number of positive cells in twenty random fields per section in 4 sections per kidney from each treatment group.
Statistical analysis
Data are expressed as means± SEM and were analyzed with a one-way ANOVA followed by the Tukey’s post test, using the Sigma Stat software. Differences were considered statistically significant at P < 0.05.
RESULTS
Body and kidney weight, blood glucose and E2 levels and UAE
No differences in either body or kidney weight were observed between any of the treatment groups (Table 1). Diabetes (D) was associated with increased blood glucose (ND, 109.3±8.9; D, 498.3±30.1 mg/dl; P<0.001), decreased plasma levels of E2 (ND, 54.9±4.6; D, 40.2±4.1 pg/ml; P<0.05) and increased UAE (ND; 9.4±1.0; D, 56.2±8.9 mg/day; P<0.001), compared with their non-diabetic (ND) counterpart (Table 1). Animals supplemented with E2 exhibited a similar increase in blood glucose levels as in D (446.6±23.0 mg/dl), while the decrease in plasma levels of E2 (53.1±6.4 pg/ml) and increase in UAE (39.4±15.7 mg/day) associated with D was completely (plasma E2) or partially (UAE) attenuated with E2 supplementation (Table 1).
Table 1.
Effects of E2 supplementation on metabolic and renal parameters
| ND | D | D+E2 | |
|---|---|---|---|
| Body weight (g) | 258.4±14 | 250±3.5 | 223±13 |
| Kidney weight (g) | 1.4±0.10 | 1.5±0.17 | 1.4±0.10 |
| Blood glucose (mg/dl) | 109.3±8.9 | 498.3±30.1aaa | 446.6±23.0aaa |
| Plasma E2 (pg/ml) | 54.9±4.6 | 40.2±4.1a | 53.1±6.4b |
| UAE9w (mg/day) | 6.6±0.4 | 19.4±3.1aa | N/A |
| UAE17w (mg/day) | 9.4±1.0 | 56.2±8.9aaa | 39.4±15.7aa,b |
| GSI (AU) | 0.13±0.02 | 1.38±0.09aa | 0.20±0.02a,b |
| TIFI (AU) | 0.17±0.04 | 1.35±0.10aa | 0.38±0.07aa |
Data are expressed as mean±SEM.
P<0.05,
P<0.01,
P<0.001 vs ND.
P<0.05 vs D.
E2, 17β-estradiol; ND, non-diabetic; D, diabetic, D+E2, diabetic with 17β-estradiol supplementation; UAE9w, urine albumin excretion after 9 weeks of diabetes; UAE17w, urine albumin excretion after 17 weeks of diabetes; GSI, glomerulosclerosis index; TIFI, tubulointerstitial fibrotic index, AU, arbitrary units.
UAE was also measured after the initial 9 weeks of diabetes, i.e. prior to E2 supplementation. At 9 weeks, increased UAE was already observed with D (ND, 6.6±0.4; D, 19.4±3.1mg/day; P<0.01; Table 1).
Glomerulosclerosis and Tubulointerstitial fibrosis
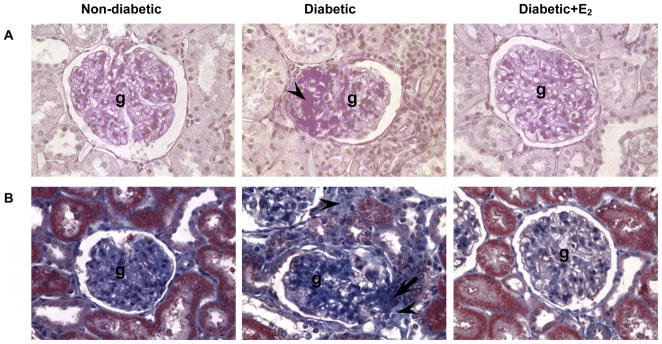
D was associated with moderate glomerulosclerosis (GSI; ND, 0.13±0.02; D, 1.38±0.09 AU; P<0.01; Fig. 1A, Table 1) and tubulointerstitial fibrosis (TIFI; ND, 0.17±0.04; D, 1.35±0.09 AU; P<0.01; Fig. 1B, Table 1). Supplementation with E2 attenuated these changes (GSI, 0.20±0.02 AU; TIFI, 0.38±0.078 AU; Fig. 1, Table 1).
Fig. 1.
Glomerulosclerosis (A) and tubulointerstitial fibrosis (B). A. PAS-stained sections of the renal cortex. Abbreviations: glomerulus (g), mesangial expansion (arrow head). B. Masson’s trichrome-stained sections of the renal cortex. Original magnification X400.
Collagen type I, collagen type IV, laminin and fibronectin
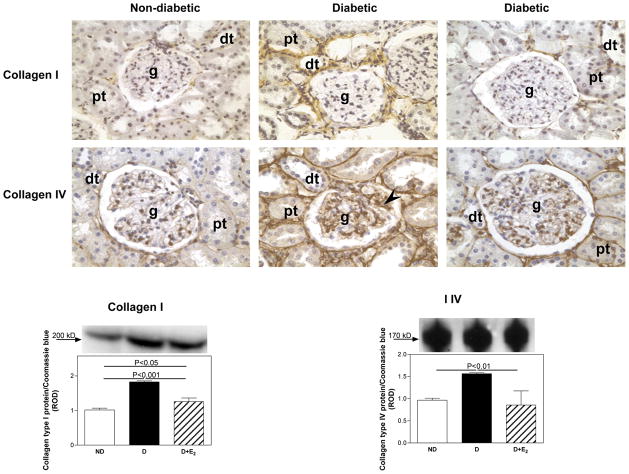
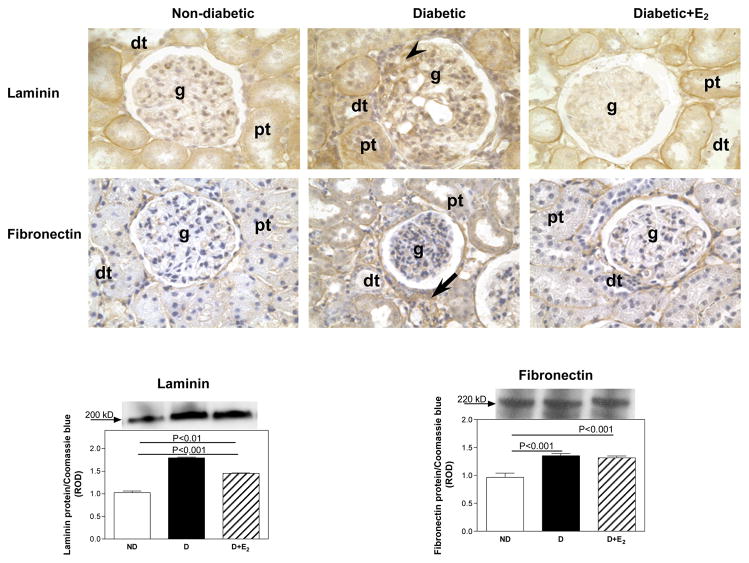
In the ND kidney, collagen type I was mainly immunolocalized to tubulointerstitial areas of the renal cortex (Fig. 2), while collagen type IV (Fig. 2), laminin (Fig. 3) and fibronectin (Fig. 3) were predominantly immunolocalized to basement membranes of the glomerulus, proximal and distal tubules. Diabetes was associated with an overall increase in the intensity of immunostaining for collagen type I, collagen type IV (Fig. 3), laminin and fibronectin (Fig. 4), while E2 supplementation either completely or partially attenuated these changes. Quantiation of changes in collagen type I, collagen type IV, laminin and fibronectin protein expression by western blotting confirmed the immunohistochemical observations. Diabetes was associated with an increase in collagen type I (CI; ND, 1.02±0.05; D, 1.83±0.03 ROD; P<0.001), collagen type IV (CIV; ND, 0.97±0.05; D, 1.56±0.03 ROD, P<0.01) and laminin (L; ND, 1.03±.0.03; D, 1.80±0.02 ROD; P<0.001) protein expression (Fig. 3 and Fig. 4), while no changes in fibronectin protein expression were observed with D (Fig. 4). Supplementation with E2 partially (CI, 1.26±0.10 ROD; L, 1.45±0.01 ROD) or fully (CIV, 0.86±0.32 ROD) attenuated these changes.
Fig. 2.
Collagen type I and type IV renal cortical immunolocalization and protein expression. Immunohistochemistry: abbreviations: proximal tubule (pt), distal tubule (dt), glomerulus (g), mesangial cells (arrow head). Original magnification X400. Western blotting: top panel, representative gels of collagen type I and type IV protein expression. Bottom panel, densitometric scans of collagen type I and type IV protein levels in relative optical density (ROD) expressed as a ratio of collagen type I/Coomassie blue and collagen type IV/Coomassie blue. Data are expressed as mean±SEM.
Fig. 3.
Laminin and fibronectin renal cortical immunolocalization and protein expression. Immunohistochemistry: abbreviations: proximal tubule (pt), distal tubule (dt), glomerulus (g), mesangial cells (arrow head), tubulointerstitial areas (arrow). Original magnification X400. Western blotting: top panel, representative gels of laminin and fibronectin protein expression. Bottom panel, densitometric scans of laminin and fibronectin protein levels in relative optical density (ROD) expressed as a ratio of laminin/Coomassie blue and fibronectin/Coomassie blue. Data are expressed as mean±SEM.
Fig. 4.
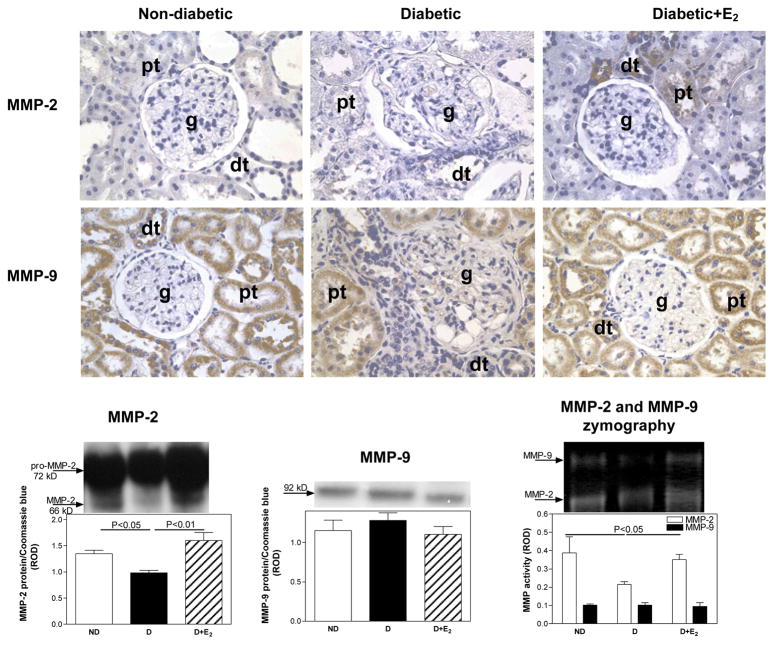
Matrix metalloproteinase-2 (MMP-2) and MMP-9 renal cortical immunolocalization, protein expression and activity. Immunohistochemistry: abbreviations: proximal tubule (pt), distal tubule (dt), glomerulus (g). Original magnification X400. Western blotting and zymography: top panel, representative gels of MMP-2 and MMP-9 protein expression. Bottom panel, densitometric scans of MMP-2 and MMP-9 protein levels in relative optical density (ROD) expressed as a ratio of MMP-2/Coomassie blue and MMP-9/Coomassie blue. Data are expressed as mean±SEM.
MMPs, TIMPs and PAI-1
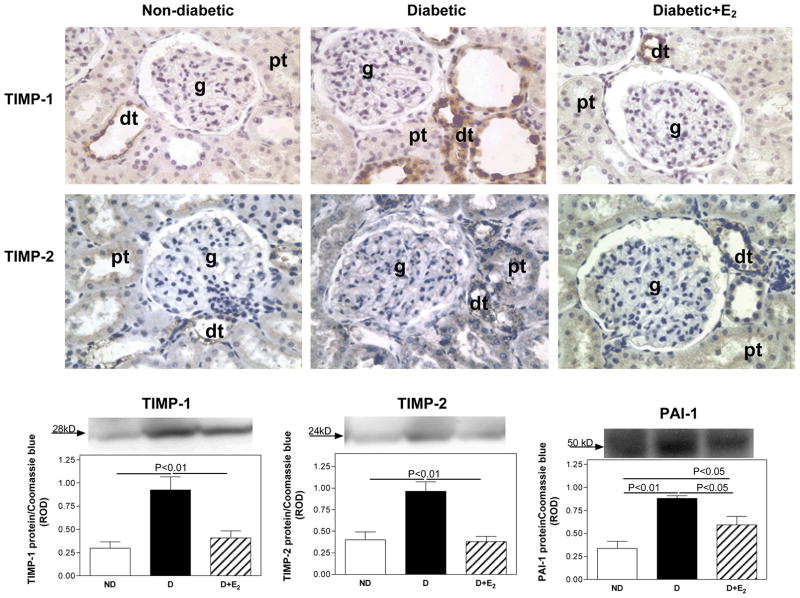
Diabetes was associated with no apparent differences in the intensity of immunostaining for either MMP-2 or MMP-9 (Fig. 5) compared with ND, while E2 supplementation appeared to increase the intensity of immunostaining for MMP-2 above the levels observed in ND. Qunatitative analysis of MMP-2 protein expression and activity by western blotting and zymography, respectively, showed a decrease in MMP-2 protein expression (ND, 1.35±0.06; D, 0.98±0.05 ROD; P<0.05) and activity (ND, 0.39±0.09; D, 0.22±0.01 ROD; P<0.05) associated with D, while no differences in either MMP-9 protein expression or activity were observed (Fig. 5). Supplementation with E2 increased MMP-2 protein expression and activity to levels above or similar to that observed in ND (Fig. 5).
Fig. 5.
Tissue inhibitor of matrix metalloproteinase-1 (TIMP-1), TIMP-2 and plasminogen activator inhibitor-1 (PAI-1) renal cortical immunolocalization and protein expression. Immunohistochemistry: abbreviations: proximal tubule (pt), distal tubule (dt), glomerulus (g). Original magnification X400. Western blotting: top panel, representative gels of TIMP-1, TIMP-2 and PAI-1 protein expression. Bottom panel, densitometric scans of TIMP-1, TIMP-2 and PAI-1 protein levels in relative optical density (ROD) expressed as a ratio of TIMP-1/Coomassie blue, TIMP-2/Coomassie blue and PAI-1/Coomassie blue. Data are expressed as mean±SEM.
While TIMP-1 was not detectable by immunohistochemistry, TIMP-2 was mainly immunolocalized to distal tubules (Fig. 5). Quantitative analysis of TIMP-1 and TIMP-2 protein expression by western blotting (Fig. 5) showed that D was associated with an increase in TIMP-1 (ND, 0.30±0.07; D, 0.93±0.14 ROD; P<0.01) and TIMP-2 (ND, 0.40±0.09; D, 0.96±0.11 ROD; P<0.01) protein expression. Supplementation with E2 completely attenuated these changes.
Similar to TIMPs, the intensity of PAI-1 immunostaining in proximal and distal tubules (Fig. 5) and protein expression (ND, 0.34±0.08; D, 0.88±0.03 ROD; P<0.01), was increased with D. Supplementation with E2 partially attenuated these changes.
Transforming growth factor beta (TGF-β) and TGF-β receptor (TGF-βRI and TGF-βRII) protein expression
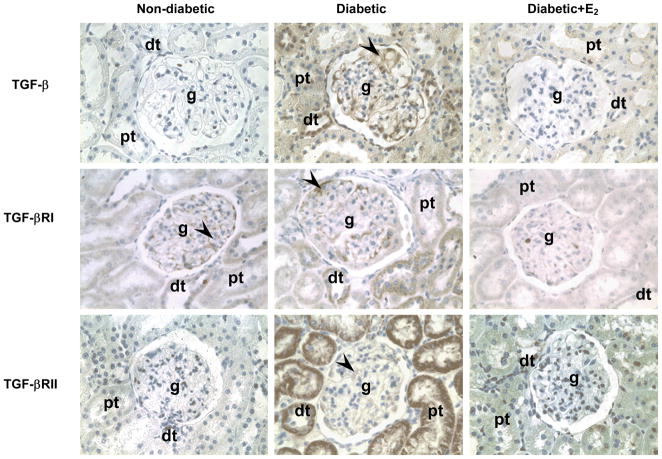
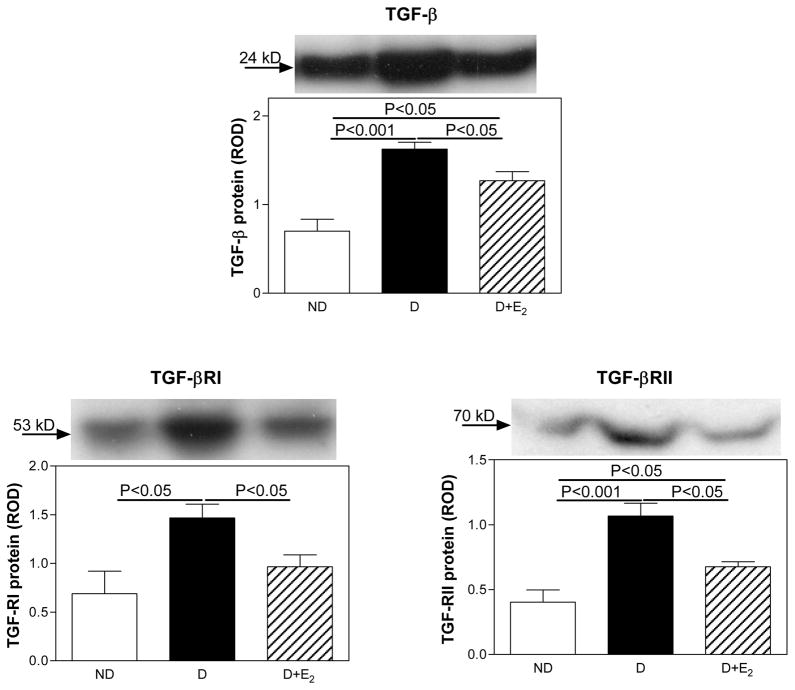
While only weak immunostaining for TGF-β was observed in the ND kidneys, the intensity of immunostaining in glomerular mesangial cells, proximal and distal tubules was increased in the D kidneys (Fig. 6). Supplementation with E2 attenuated this diabetes-associated increase in the intensity of TGF-β immunostaining. Western analysis confirmed the immunohistochemical findings. Diabetes (D) was associated with an increase in renal cortical expression of TGF-β protein (ND, 0.70±0.14; D, 1.63±0.08 ROD; P<0.001), while E2 supplementation partially attenuated this increase (D+E2, 1.27±0.10 ROD), Fig. 7.
Fig. 6.
TGF-β, TGF-βRI and TGF-βRII immunolocalization. Abbreviations: proximal tubule (pt), distal tubule (dt), glomerulus (g), mesangial cells (arrow head). Original magnification X400.
Fig. 7.
TGF-β, TGF-βRI and TGF-βRII protein expression. Top panel, representative gels of TGF-β, TGF-βRI and TGF-βRII protein expression. Bottom panel, densitometric scans of TGF-β, TGF-βRI and TGF-βRII protein levels in relative optical density (ROD) expressed as a ratio of TGF-β/Coomassie blue, TGF-βRI/Coomassie blue and TGF-βRII/Coomassie blue. Data are expressed as mean±SEM.
In the ND kidney, TGF-βRI was predominantly immunolocalized to glomerular mesangial cells (Fig. 6). D was associated with an apparent increase in the overall intensity of TGF-βRI immunostaining and in addition to being observed in the mesangial cells, TGF-βRI was also evident in distal, and to a lesser extent proximal tubules (Fig. 6). Supplementation with E2 attenuated this diabetes-associated increase in the intensity of TGF-βRI immunostaining. While TGF-βRII was not detectable in the ND kidneys by immunohistochemistry, it was immunolocalized predominantly to proximal and distal tubules and in the mesangial cells in the D kidneys (Fig. 6). Supplementation with E2 attenuated this diabetes-associated increase in the intensity of TGF-βRI immunostaining. Western analysis confirmed the immunohistochemical findings. Diabetes (D) was associated with an increase in renal cortical expression of TGF-βRI (ND, 0.69±0.23; D, 1.47±0.14 ROD; P<0.05) and TGF-βRII (ND, 0.40±0.09; D, 1.07±0.10 ROD; P<0.001) protein, while E2 supplementation partially attenuated this increase (TGF-βRI, 0.97±0.12; TGF-βRII, 0.68±0.04 ROD) Fig. 7.
Smad protein expression
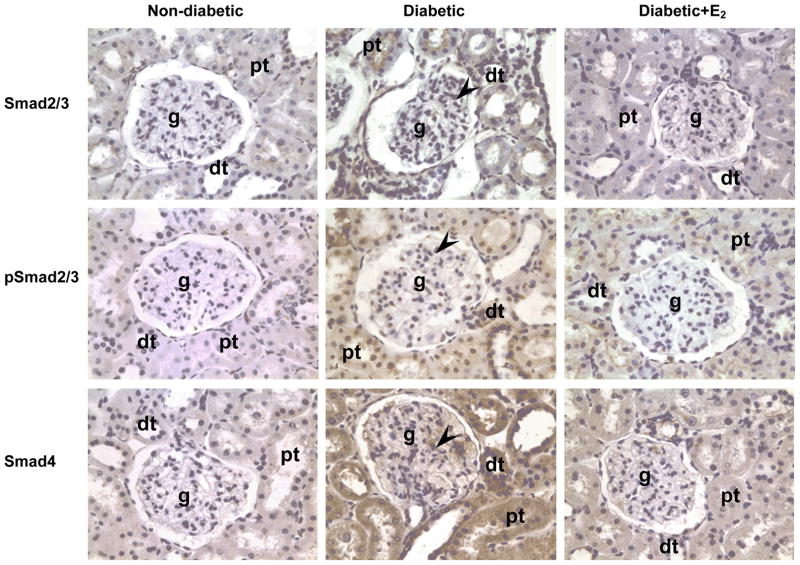
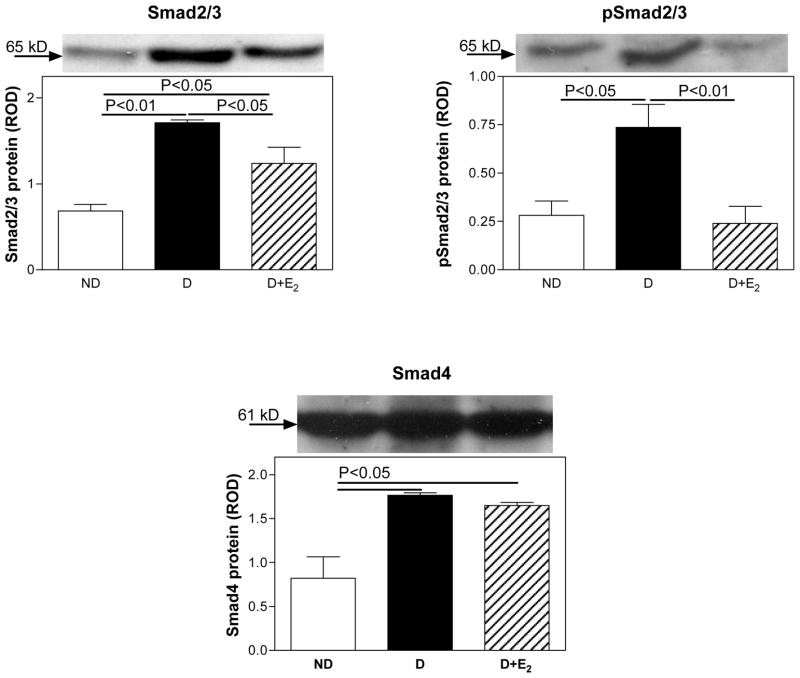
In the ND kidney, no Smad2/3, pSmad2/3 or Smad4 were detected by immunohistochemistry (Fig. 8). In the D kidney, Smad2/3, pSmad2/3 and Smad4 were immunolocalized to glomerular mesangial cells, proximal and distal tubules (Fig. 8). Supplementation with E2 attenuated this diabetes-associated increase in the intensity of Smad2/3, pSmad2/3 and Smad4 immunostaining. Western analysis confirmed the immunohistochemical findings. Diabetes (D) was associated with an increase in renal cortical expression of Smad2/3 (ND, 0.68±0.08; D, 1.71±0.03 ROD; P<0.01; Fig. 9), pSmad2/3 (ND, 0.28±0.07; D, 0.74±0.12 ROD; P<0.05; Fig. 9) and Smad4 (ND, 0.82±0.24; D, 1.77±0.03 ROD; P<0.05; Fig. 9) protein. Supplementation with E2 attenuated these changes (Smad2/3, 1.24±0.19; pSmad2/3, 0.24±0.09; Smad4, 1.65±0.03 ROD; Fig. 9).
Fig. 8.
Smad2/3, pSmad2/3 and Smad4 immunolocalization. Abbreviations: proximal tubule (pt), distal tubule (dt), glomerulus (g), mesangial cells (arrow head). Original magnification X400.
Fig. 9.
Smad2/3, pSmad2/3 and Smad4 protein expression. Top panel, representative gels of Smad2/3, pSmad2/3 and Smad4 protein expression. Bottom panel, densitometric scans of Smad2/3, pSmad2/3 and Smad4 protein levels in relative optical density (ROD) expressed as a ratio of Smad2/3/Coomassie blue, pSmad2/3/Coomassie blue and Smad4/Coomassie blue. Data are expressed as mean±SEM.
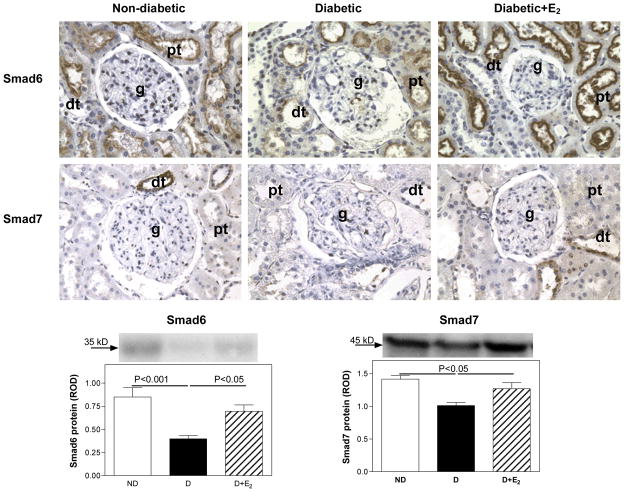
In the ND kidney, Smad6 was mainly immunolocalized to proximal, and to lesser extent distal tubules (Fig. 10), while Smad7 was immunolocalized predominantly to distal tubules (Fig. 10). In the D kidney, an overall decrease in the intensity of immunolocalization for both Smad6 and Smad7 was observed (Fig. 10). Supplementation with E2 attenuated this diabetes-associated decrease in the intensity of Smad6 and Smad7 immunostaining. Western analysis confirmed the immunohistochemical findings. Diabetes (D) was associated with a decrease in renal cortical expression of Smad6 (ND, 0.85±0.10; D, 0.40±0.03 ROD; P<0.001) and Smad7 (ND, 1.41±0.06; D, 1.01±0.05 ROD; P<0.05) protein, Fig. 10. Supplementation with E2 attenuated these changes (Smad6, 0.70±0.07; Smad7, 1.27±0.09 ROD).
Fig. 10.
Smad6 and Smad7 immunolocalization and protein expression. Immunohistochemistry: abbreviations: proximal tubule (pt), distal tubule (dt), glomerulus (g). Original magnification X400. Western blotting: top panel, representative gels of Smad6 and Smad7 protein expression. Bottom panel, densitometric scans of Smad6 and Smad7 protein levels in relative optical density (ROD) expressed as a ratio of Smad6/Coomassie blue and Smad7/Coomassie blue. Data are expressed as mean±SEM.
Smurf2 expression
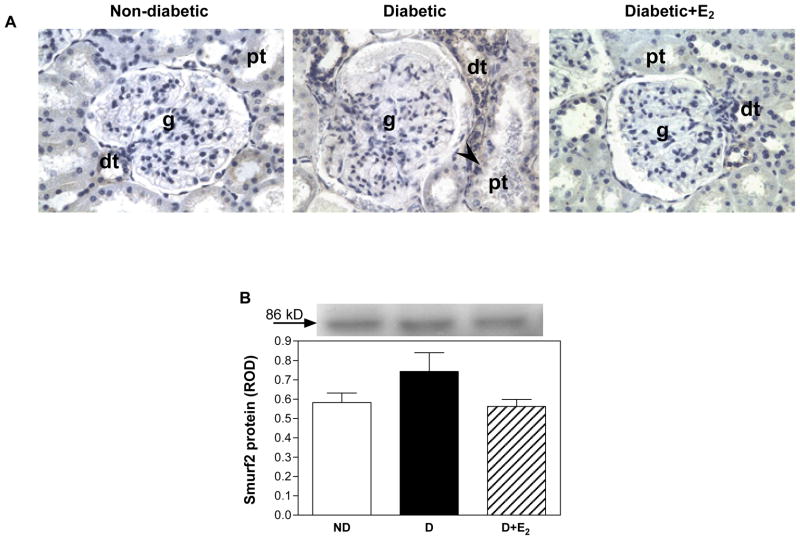
Weak immunostaining in distal tubules was observed in ND kidney, while in D, there was an overall increase in the intensity of staining for Smurf2, and in addition to distal tubules, staining was also observed in isolated cells in proximal tubules (Fig. 11). This increase in the intensity of immunostaining for Smurf2 was attenuated with E2 supplementation. While there was a trend towards an increase in Smurf2 protein expression in the D compared with ND kidneys and a decrease with E2 supplementation, this did not reach statistical significance (Fig. 11).
Fig. 11.
Smurf2 protein expression. A. Immunohistochemistry: abbreviations: proximal tubule (pt), distal tubule (dt), glomerulus (g), selected cells in the proximal tubule positive for Smurf2 (arrow head). Original magnification X400. B. Western blotting: top panel, representative gels of Smurf2 protein expression. Bottom panel, densitometric scans of Smurf2 protein levels in relative optical density (ROD) expressed as a ratio of Smurf2/Coomassie blue. Data are expressed as mean±SEM.
Renal inflammation
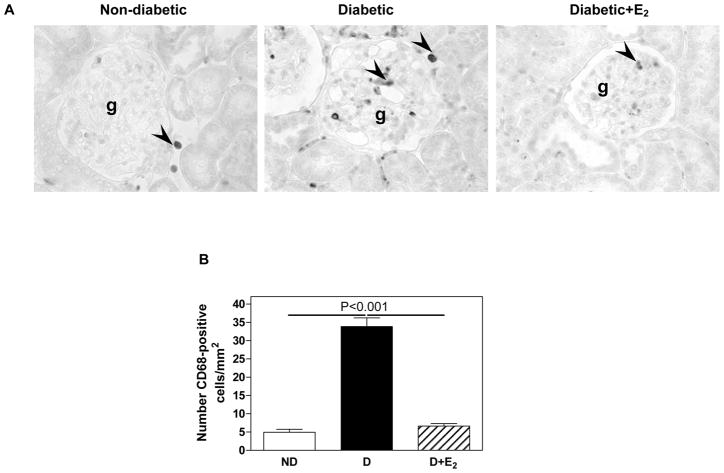
The D kidney was characterized by the presence of CD68-positive cells in the glomerulus and cortical tubulointerstitium (Fig. 12), suggesting the presence of macrophages. Quantitative analysis showed that D was associated with an increase in the abundance of CD68-positive cells compared with ND (ND, 5.0±0.8; D, 33.8±2.4 cells/mm2, P<0.001) and that E2 supplementation completely reversed this increase in abundance of CD68-positive cells associated with D (D+E2, 6.6±0.7 cells/mm2), Fig. 12.
Fig. 12.
CD68 immunostaining and abundance. A. Immunohistochemistry: abbreviations: proximal tubule (pt), distal tubule (dt), glomerulus (g). Original magnification X400. B. Quantitative analysis of CD68-positive cells expressed as the number of CD68-positive cells per mm2. Data are expressed as mean±SEM.
DISCUSSION
We have previously shown that E2, when supplemented from the onset of diabetes, is renoprotective by preventing albuminuria, glomerulosclerosis and tubulointerstitial fibrosis (39, 40). The present study demonstrates that when supplemented after 9 weeks of diabetes, E2 is also able to attenuate albuminuria and structural changes associated with diabetes through regulating ECM protein and TGF-β protein expression and signaling.
Increased UAE is a hallmark of diabetic renal disease (10). In our study, increased UAE was observed as early as 9 weeks of diabetes, and increased further for the duration of the study (17 weeks). E2 supplementation initiated after 9 weeks of diabetes, at a time when albuminuria has already developed, reduced this diabetes-associated increase in UAE. These observations suggest that in addition to being able to attenuate, E2 also reverses the decline in albuminuria associated with diabetes. Variable effects of E2 supplementation on UAE have been reported in other studies. While in the OLETF diabetic rat E2 had no effect (71), in type II diabetic patients E2 supplementation from the onset of diabetes reduced proteinuria (69). However, no studies to date have examined the ability of E2 to reverse diabetes-related albuminuria.
Our previous studies showed that E2 supplementation from the onset of diabetes prevents the development of glomerulosclerosis and tubulointerstitial fibrosis (39, 40). Our previous study also shows that the predominate receptor type through which E2 exerts its effects in the diabetic kidney is ERα (74). The present study shows that when supplemented after 9 weeks of diabetes, E2 also attenuates the progression of development of glomerulosclerosis and tubulointerstitial fibrosis. Specifically, we show that 17 weeks of diabetes is associated with an upregulation of collagen type I, collagen type IV and laminin and fibronectin protein expression, confirming observations of previous studies from this and other laboratories (32, 38, 39). Supplementation with E2 either partially (collagen type IV and laminin) or fully (collagen type I) attenuated these increases, but did not affect fibronectin protein expression. Most studies to date mainly examined the ability of E2 to regulate renal ECM protein expression in vitro. These studies have demonstrated that E2 inhibits: 1) catecholamine-induced collagen synthesis in human mesangial cells (16, 78), 2), collagen type IV accumulation in mesangial cells derived from glomerulosclerosis-resistant mice (58), and 3) collagen type I and type IV synthesis in mesangial cells derived from SJL/J (H-2S) mice (65, 66). The few in vivo studies, albeit, mostly performed in non-diabetic models, support the observation of the present study that E2 downregulates ECM protein expression. In the ROP Os/+ (18), Alb/TGF-beta transgenic mice (6) and the Dahl salt sensitive rat (41), E2 decreases synthesis of interstitial and basement membrane collagens and laminin. In ovariectomized db/db (14) and TGF-β1 transgenic mice (5), treatment with E2 for 8 and 6 weeks, respectively, attenuates diabetes-induced fibronectin and collagen protein expression. The finding of the inability of E2 to attenuate the diabetes-associated increase in fibronectin protein expression was surprising given that our previous study showed that when supplemented from the onset of diabetes, E2 attenuated fibronectin protein expression (39). One of the possible explanations for this observation may be the inability of E2 to adequately upregulate enzymes involved in fibronectin metabolism. While E2 upregulates expression of MMP-2, fibronectin degradation, with advanced diabetes, may be more dependent on other MMPs, including MMP-9, which are not responsive to treatment with E2.
In addition to increased synthesis, diabetes-related glomerulosclerosis and tubulointerstitial fibrosis is associated with a decrease in ECM degradation by MMPs (23, 30, 36, 42, 55). Our study shows that 17 weeks of diabetes is associated with a decrease in MMP-2 but not MMP-9 protein expression and activity and that E2 supplementation attenuates diabetes-induced MMP-2 protein expression and activity. Variable levels of MMP-2 and MMP-9 protein expression and activity have been observed in the diabetic kidney, depending on the duration and model of diabetes. In early diabetes, a decrease in MMP-2 and MMP-9 protein expression and activity has been reported (26, 39, 44) while in longer-term diabetes, in C57BL/6J mice made diabetic by a high fat diet (60) or the STZ-induced diabetic rat (15), no changes in MMP-9 activity were observed. It is conceivable that compensatory mechanisms are activated in response to prolonged diabetes that reverse MMP-9 expression and activity observed in early stages of the disease. Moreover, studies in the MMP-9 knockout mice showed that MMP-9 does not appear to have a discernible role in the progression of glomerulonephritis in a mouse model of Alport syndrome (2), suggesting compensation orredundancy of MMP-9 in this model. MMP-9 may similarly be redundant or compensated in the diabetic kidney especially after prolonged hypreglycemia. Similar to ECM protein expression, very few in vivo studies have examined the ability of E2 to regulate renal ECM metabolism, especially in the setting of diabetes. In cultured mesangial cells, E2 increases MMP-2 (25, 34) and hyperglycemia-induced downregulation of MMP-9 (57) protein expression and activity. These observations support the findings of the present study that E2 is renoportective by upregulating MMP expression and activity.
One of the mechanisms by which MMP activity is regulated is by altering the expression of its inhibitors, namely TIMPs and PAI-1. Diabetic nephropathy, in both humans and experimental models, is associated with increased TIMP-1 (44), TIMP-2 (26) and PAI-1 (36, 51, 54) protein expression, consistent with the findings of the present study. While E2 supplementation partially (TIMP-1) or fully (TIMP-2) attenuated the diabetes-associated increase in TIMPs, no effect of E2 on PAI-1 expression was observed. In previous studies, E2 was shown to attenuate TIMP-2 and PAI-1 expression in the Alb/TGF-beta transgenic mice (6), and attenuate TIMP-1 and TIMP-2 in the diabetic kidney (39). Furthermore, combined estrogen and medroxyprogesterone treatment in post-menopausal diabetic women reduces serum PAI-1 levels (53). These studies clearly demonstrate the ability of E2 to regulate PAI-1 expression; however, it appears that this regulation is ineffective once diabetes has progressed, at least in the kidney. But despite the inability of E2 to regulate PAI-1 expression directly, its effects on other ECM regulatory pathways appear to be sufficient to effectively attenuate the progression of glomerulosclerosis and tubulointerstitial fibrosis in the diabetic kidney.
Numerous studies have demonstrated the importance of TGF-β in the pathophysiology of renal disease, including diabetic nephropathy. The diabetic kidney is characterized by temporal overexpression of TGF-β mRNA and protein in both experimental models (4, 27, 28) and in humans (7, 79). Our previous (40) and current study confirm the finding that TGF-β is overexpressed in glomerular mesangial cells, proximal and distal tubules in the STZ-induced diabetic rat after 9 weeks of diabetes. Our present study also shows that supplementation with E2 for 8 weeks following the 9-week period of diabetes attenuates TGF-β protein expression, suggesting that one of the mechanisms by which E2 exerts its renoprotective effects in the diabetic kidney is through regulating the expression of locally active cytokines, such as TGF-β. A similar renoprotective effect of E2 has been observed in the 5/6 remnant kidney model, in which E2 supplementation inhibits tubulointerstitial fibrosis via reducing TGF-β expression (3, 33). In Alb/TGF-β1 transgenic mice overexpressing TGF-β, supplementation with E2 reverses renal injury (6). In cultured human embryonic kidney carcinoma cells (43) and in cultured mesangial cells (49), E2 inhibits TGF-β protein expression under high glucose conditions, further providing support that E2 is renoprotective in the face of increased TGF-β expression.
The present study supports the previous observations from this and other laboratories that TGF-β protein is upregulated in the diabetic kidney and that this upregulation is associated with glomerulosclerosis and tubulointerstitial fibrosis (40, 42, 76, 80). Numerous studies have demonstrated that TGF-β promotes renal cell growth, stimulates synthesis of key ECM proteins including, type I and type IV collagen, laminin and fibronectin and inhibits ECM degradation via decreasing activity of matrix metalloproteinases (MMPs) (7, 8, 11, 27, 28, 72). Our study also shows that increased TGF-β protein expression in the diabetic kidney coincides with glomerulosclerosis, tubulointerstitial fibrosis, increase in collagen type I, collagen type IV and laminin protein expression and decrease in MMP-2 activity (see accompanying manuscript). The present study also shows that E2 supplementation attenuated all these changes. In the ROP Os/+ mice, E2 prevents tubulointerstitial fibrosis by decreasing synthesis of interstitial and basement membrane collagens (18), while in cultured mesangial cells, E2 increases the activity of MMPs (57) via inhibiting TGF-β expression (48). Collectively, these findings support the role for E2 in attenuating the progression, and possibly reversing diabetes-associated glomerulosclerosis and tubulointerstitial fibrosis via regulating TGF-β protein expression.
Observations from the present study indicate that both TGF-βRII and TGF-βRI protein expression is upregulated in the diabetic kidney, supporting the observations from previously reported studies (27, 28, 35). Our study also shows that E2 supplementation reduces TGF-βRII and TGF-βRI protein expression, suggesting that E2 exerts its renoprotective effects through regulating the expression of both the ligand (TGF-β) and its receptors. While both in vivo (3, 6, 33) and in vitro (49) studies have shown that E2 downregulates TGF-β in the setting of diabetes/high glucose, no studies to date have reported the effects of E2 on TGF- βRII and TGF-βRI protein expression. Our observations thus demonstrate a novel aspect of E2 regulation of the TGF-β pathway in the diabetic kidney.
Evidence suggests that TGF-β exerts its profibrotic effect through activation of Smad2/3 which then forms a complex with Smad4 that is then translocated into the nucleus to upregulate transcription of profibrotic genes (46, 72). Our study found that diabetes was associated with an increase in the renal cortical expression of Smad2/3 protein as well as its phosphorylated form, pSmad2/3, indicating increased activation of Smad2/3 in the setting of diabetes. Other studies have also reported increases in renal cortical Smad2/3 and Smad4 in the diabetic kidney (21, 29, 31). Our study shows that E2 supplementation attenuates diabetes-associated increases in Smad2/3 and pSmad2/3 protein expression, while no effects on Smad4 were observed. In cultured human embryonic kidney carcinoma cells, E2 also decreases Smad3 protein expression (43), further providing support that E2, in addition to being able to directly regulate TGF-β protein expression, it also suppresses TGF-β activity via downregulating its profibrotic regulatory proteins Smad2/3. Although E2 did not affect Smad4 protein expression, it is conceivable that E2 suppresses the profibrotic TGF-β effect through downregulating Smad2/3 protein expression and its phosphorylation only without an effect on Smad4.
TGF-β activity can be downregulated in part by: 1) a feedback mechanism involving Smad7, which prevents phosphorylation of Smad2/3 by binding to the TGF-βRI (72, 77) and by 2) activation of transcriptional repressor function of Smad6 (62). Our study shows that diabetes is associated with a decrease in renal cortical Smad6 and Smad7 protein expression, indicating that this may be one of the mechanisms by which the profibrotic effect of TGF-β is exerted in the diabetic kidney. Interestingly, out study demonstrates that E2 supplementation attenuates diabetes-associated decrease in both Smad6 and Smad7 protein expression, suggesting that this may be one of the pathways by which E2 attenuate the profibrotic effects of TGF-β in the diabetic kidney. These observations provide evidence for a dual role for E2 in regulating TGF-β activity in the diabetic kidney: via downregulating the expression of profibrotic signaling molecules (Smad2/3) and via upregulating antifibrotic signaling molecules (Smad6 and Smad7).
Studies thus far have reported contradictory evidence for the role for Smurf2 in regulating TGF-β signaling and activity. Smurf2 has been reported to induce ubiquitin-dependent degradation of Smad2, induce nuclear export of Smad7 with subsequent increase in TGF-βRI degradation thus negatively regulate TGF-β signaling (17, 37). In contrast, in the unilateral ureteral obstruction model of progressive tubulointerstitial fibrosis, Smurf2 expression is increased in very early stages of the disease (20), at a time when TGF-β protein expression is also upregulated, suggesting that Smurf2 may in fact potentiate TGF-β activity. While our study only observed a trend towards an increase in Smurf2 protein expression at a time when TGF-β protein is upregulated, this change did not reach statistical significance and may only suggest that Smurf2 may not play a role in TGF-β signaling in the STZ-induced diabetic kidney disease, at least not in our hands.
In summary, our study demonstrates that in the STZ-induced diabetic rat, E2 is renoprotective by attenuating albuminuria and ECM protein expression associated with diabetic glomerulosclerosis and tubulointerstitial fibrosis. One of the mechanisms by which E2 exerts its renoprotective effects in diabetes is through regulating the expression of TGF-β and its downstream signaling pathway involving members of the Smad family of proteins. These findings suggest that E2 supplementation may be beneficial in the preventing the development and progression of diabetic renal disease.
Acknowledgments
This work was supported by the Carl W. Gottschalk Award from the American Society of Nephrology and the Research Award from the American Diabetes Association to C. Maric. The authors would like to acknowledge the technical help of Mr. Joseph Garman.
References
- 1.Animal models of diabetic complications Consortium. Validation of mouse models of diabetic nephropathy. http://wwwamdccorg/
- 2.Andrews KL, Betsuyaku T, Rogers S, Shipley JM, Senior RM, Miner JH. Gelatinase B (MMP-9) is not essential in the normal kidney and does not influence progression of renal disease in a mouse model of Alport syndrome. Am J Pathol. 2000;157:303–311. doi: 10.1016/S0002-9440(10)64541-5. [DOI] [PMC free article] [PubMed] [Google Scholar]
- 3.Antus B, Hamar P, Kokeny G, Szollosi Z, Mucsi I, Nemes Z, Rosivall L. Estradiol is nephroprotective in the rat remnant kidney. Nephrol Dial Transplant. 2003;18:54–61. doi: 10.1093/ndt/18.1.54. [DOI] [PubMed] [Google Scholar]
- 4.Benigni A, Zoja C, Campana M, Corna D, Sangalli F, Rottoli D, Gagliardini E, Conti S, Ledbetter S, Remuzzi G. Beneficial effect of TGFbeta antagonism in treating diabetic nephropathy depends on when treatment is started. Nephron Exp Nephrol. 2006;104:158–168. doi: 10.1159/000094967. [DOI] [PubMed] [Google Scholar]
- 5.Birch Nielsen C, Krag S, ROS, Flyvbjerg A, Nyengaard J, Forman A, Wogensen L. Transforming growth factor beta1-induced glomerulopathy is prevented by 17beta-estradiol supplementation. Virchows Arch. 2004;444:561–566. doi: 10.1007/s00428-004-1006-4. [DOI] [PubMed] [Google Scholar]
- 6.Blush J, Lei J, Ju W, Silbiger S, Pullman J, Neugarten J. Estradiol reverses renal injury in Alb/TGF-beta1 transgenic mice. Kidney Int. 2004;66:2148–2154. doi: 10.1111/j.1523-1755.2004.66005.x. [DOI] [PubMed] [Google Scholar]
- 7.Border WA, Yamamoto T, Noble NA. Transforming growth factor beta in diabetic nephropathy. Diabetes Metab Rev. 1996;12:309–339. doi: 10.1002/(SICI)1099-0895(199612)12:4<309::AID-DMR171>3.0.CO;2-A. [DOI] [PubMed] [Google Scholar]
- 8.Branton MH, Kopp JB. TGF-beta and fibrosis. Microbes Infect. 1999;1:1349–1365. doi: 10.1016/s1286-4579(99)00250-6. [DOI] [PubMed] [Google Scholar]
- 9.Breyer JA, Bain RP, Evans JK, Nahman NS, Jr, Lewis EJ, Cooper M, McGill J, Berl T. Predictors of the progression of renal insufficiency in patients with insulin-dependent diabetes and overt diabetic nephropathy. The Collaborative Study Group. Kidney Int. 1996;50:1651–1658. doi: 10.1038/ki.1996.481. [DOI] [PubMed] [Google Scholar]
- 10.Caramori ML, Fioretto P, Mauer M. Enhancing the predictive value of urinary albumin for diabetic nephropathy. J Am Soc Nephrol. 2006;17:339–352. doi: 10.1681/ASN.2005101075. [DOI] [PubMed] [Google Scholar]
- 11.Chen S, Hong S, Iglesias-de lCM, Isono M, Casaretto A, Ziyadeh F. The key role of the transforming growth factor-beta system in the pathogenesis of diabetic nephropathy. Ren Fail. 2001;23:471–481. doi: 10.1081/jdi-100104730. [DOI] [PubMed] [Google Scholar]
- 12.Chen S, Lee JS, Iglesias-de la Cruz MC, Wang A, Izquierdo-Lahuerta A, Gandhi NK, Danesh FR, Wolf G, Ziyadeh FN. Angiotensin II stimulates alpha3(IV) collagen production in mouse podocytes via TGF-beta and VEGF signalling: implications for diabetic glomerulopathy. Nephrol Dial Transplant. 2005;20:1320–1328. doi: 10.1093/ndt/gfh837. [DOI] [PubMed] [Google Scholar]
- 13.Cherney DZ, Sochett EB, Miller JA. Gender differences in renal responses to hyperglycemia and angiotensin-converting enzyme inhibition in diabetes. Kidney Int. 2005;68:1722–1728. doi: 10.1111/j.1523-1755.2005.00588.x. [DOI] [PubMed] [Google Scholar]
- 14.Chin M, Isono M, Isshiki K, Araki S, Sugimoto T, Guo B, Sato H, Haneda M, Kashiwagi A, Koya D. Estrogen and raloxifene, a selective estrogen receptor modulator, ameliorate renal damage in db/db mice. Am J Pathol. 2005;166:1629–1636. doi: 10.1016/s0002-9440(10)62473-x. [DOI] [PMC free article] [PubMed] [Google Scholar]
- 15.Dong FQ, Li H, Cai WM, Tao J, Li Q, Ruan Y, Zheng FP, Zhang Z. Effects of pioglitazone on expressions of matrix metalloproteinases 2 and 9 in kidneys of diabetic rats. Chin Med J (Engl) 2004;117:1040–1044. [PubMed] [Google Scholar]
- 16.Dubey RK, Zacharia LC, Gillespie DG, Imthurn B, Jackson EK. Catecholamines block the antimitogenic effect of estradiol on human glomerular mesangial cells. Hypertension. 2003;42:349–355. doi: 10.1161/01.HYP.0000088320.81260.26. [DOI] [PubMed] [Google Scholar]
- 17.Ebisawa T, Fukuchi M, Murakami G, Chiba T, Tanaka K, Imamura T, Miyazono K. Smurf1 interacts with transforming growth factor-beta type I receptor through Smad7 and induces receptor degradation. J Biol Chem. 2001;276:12477–12480. doi: 10.1074/jbc.C100008200. [DOI] [PubMed] [Google Scholar]
- 18.Elliot SJ, Karl M, Berho M, Potier M, Zheng F, Leclercq B, Striker GE, Striker LJ. Estrogen deficiency accelerates progression of glomerulosclerosis in susceptible mice. Am J Pathol. 2003;162:1441–1448. doi: 10.1016/S0002-9440(10)64277-0. [DOI] [PMC free article] [PubMed] [Google Scholar]
- 19.Fukami K, Ueda S, Yamagishi S, Kato S, Inagaki Y, Takeuchi M, Motomiya Y, Bucala R, Iida S, Tamaki K, Imaizumi T, Cooper ME, Okuda S. AGEs activate mesangial TGF-beta-Smad signaling via an angiotensin II type I receptor interaction. Kidney Int. 2004;66:2137–2147. doi: 10.1111/j.1523-1755.2004.66004.x. [DOI] [PubMed] [Google Scholar]
- 20.Fukasawa H, Yamamoto T, Togawa A, Ohashi N, Fujigaki Y, Oda T, Uchida C, Kitagawa K, Hattori T, Suzuki S, Kitagawa M, Hishida A. Down-regulation of Smad7 expression by ubiquitin-dependent degradation contributes to renal fibrosis in obstructive nephropathy in mice. Proc Natl Acad Sci USA. 2004;101:8687–8692. doi: 10.1073/pnas.0400035101. [DOI] [PMC free article] [PubMed] [Google Scholar]
- 21.Furuse Y, Hashimoto N, Maekawa M, Toyama Y, Nakao A, Iwamoto I, Sakurai K, Suzuki Y, Yagui K, Yuasa S, Toshimori K, Saito Y. Activation of the Smad pathway in glomeruli from a spontaneously diabetic rat model, OLETF rats. Nephron Exp Nephrol. 2004;98:100–108. doi: 10.1159/000080685. [DOI] [PubMed] [Google Scholar]
- 22.Gilbert RE, Akdeniz A, Weitz S, Usinger WR, Molineaux C, Jones SE, Langham RG, Jerums G. Urinary connective tissue growth factor excretion in patients with type 1 diabetes and nephropathy. Diabetes Care. 2003;26:2632–2636. doi: 10.2337/diacare.26.9.2632. [DOI] [PubMed] [Google Scholar]
- 23.Gilbert RE, Cooper ME. The tubulointerstitium in progressive diabetic kidney disease: more than an aftermath of glomerular injury? Kidney Int. 1999;56:1627–1637. doi: 10.1046/j.1523-1755.1999.00721.x. [DOI] [PubMed] [Google Scholar]
- 24.Gruden G, Zonca S, Hayward A, Thomas S, Maestrini S, Gnudi L, Viberti GC. Mechanical stretch-induced fibronectin and transforming growth factor-beta1 production in human mesangial cells is p38 mitogen-activated protein kinase-dependent. Diabetes. 2000;49:655–661. doi: 10.2337/diabetes.49.4.655. [DOI] [PubMed] [Google Scholar]
- 25.Guccione M, Silbiger S, Lei J, Neugarten J. Estradiol upregulates mesangial cell MMP-2 activity via the transcription factor AP-2. Am J Physiol Renal Physiol. 2002;282:F164–F169. doi: 10.1152/ajprenal.0318.2000. [DOI] [PubMed] [Google Scholar]
- 26.Han SY, Jee YH, Han KH, Kang YS, Kim HK, Han JY, Kim YS, Cha DR. An imbalance between matrix metalloproteinase-2 and tissue inhibitor of matrix metalloproteinase-2 contributes to the development of early diabetic nephropathy. Nephrol Dial Transplant. 2006;21:2406–2416. doi: 10.1093/ndt/gfl238. [DOI] [PubMed] [Google Scholar]
- 27.Hill C, Flyvbjerg A, Gronbaek H, Petrik J, Hill DJ, Thomas CR, Sheppard MC, Logan A. The renal expression of transforming growth factor-beta isoforms and their receptors in acute and chronic experimental diabetes in rats. Endocrinology. 2000;141:1196–1208. doi: 10.1210/endo.141.3.7359. [DOI] [PubMed] [Google Scholar]
- 28.Hong SW, Isono M, Chen S, Iglesias-De La Cruz MC, Han DC, Ziyadeh FN. Increased glomerular and tubular expression of transforming growth factor-beta1, its type II receptor, and activation of the Smad signaling pathway in the db/db mouse. Am J Pathol. 2001;158:1653–1663. doi: 10.1016/s0002-9440(10)64121-1. [DOI] [PMC free article] [PubMed] [Google Scholar]
- 29.Huang HC, Preisig PA. G1 kinases and transforming growth factor-beta signaling are associated with a growth pattern switch in diabetes-induced renal growth. Kidney Int. 2000;58:162–172. doi: 10.1046/j.1523-1755.2000.00151.x. [DOI] [PubMed] [Google Scholar]
- 30.Ina K, Kitamura H, Tatsukawa S, Takayama T, Fujikura Y, Shimada T. Transformation of interstitial fibroblasts and tubulointerstitial fibrosis in diabetic nephropathy. Med Electron Microsc. 2002;35:87–95. doi: 10.1007/s007950200011. [DOI] [PubMed] [Google Scholar]
- 31.Isono M, Chen S, Hong SW, Iglesias-de la Cruz MC, Ziyadeh FN. Smad pathway is activated in the diabetic mouse kidney and Smad3 mediates TGF-beta-induced fibronectin in mesangial cells. Biochem Biophys Res Commun. 2002;296:1356–1365. doi: 10.1016/s0006-291x(02)02084-3. [DOI] [PubMed] [Google Scholar]
- 32.Jackle-Meyer I, Szukics B, Neubauer K, Metze V, Petzoldt R, Stolte H. Extracellular matrix proteins as early markers in diabetic nephropathy. Eur J Clin Chem Clin Biochem. 1995;33:211–219. doi: 10.1515/cclm.1995.33.4.211. [DOI] [PubMed] [Google Scholar]
- 33.Kang DH, Yu ES, Yoon KI, Johnson R. The impact of gender on progression of renal disease: potential role of estrogen-mediated vascular endothelial growth factor regulation and vascular protection. Am J Pathol. 2004;164:679–688. doi: 10.1016/S0002-9440(10)63155-0. [DOI] [PMC free article] [PubMed] [Google Scholar]
- 34.Karl M, Berho M, Pignac-Kobinger J, Striker GE, Elliot SJ. Differential effects of continuous and intermittent 17beta-estradiol replacement and tamoxifen therapy on the prevention of glomerulosclerosis: modulation of the mesangial cell phenotype in vivo. Am J Pathol. 2006;169:351–361. doi: 10.2353/ajpath.2006.051255. [DOI] [PMC free article] [PubMed] [Google Scholar]
- 35.Kim HW, Kim BC, Song CY, Kim JH, Hong HK, Lee HS. Heterozygous mice for TGF-betaIIR gene are resistant to the progression of streptozotocin-induced diabetic nephropathy. Kidney Int. 2004;66:1859–1865. doi: 10.1111/j.1523-1755.2004.00959.x. [DOI] [PubMed] [Google Scholar]
- 36.Lee HB, Ha H. Plasminogen activator inhibitor-1 and diabetic nephropathy. Nephrology (Carlton) 2005;10 (Suppl):S11–S13. doi: 10.1111/j.1440-1797.2005.00449.x. [DOI] [PubMed] [Google Scholar]
- 37.Lin X, Liang M, Feng XH. Smurf2 is a ubiquitin E3 ligase mediating proteasome-dependent degradation of Smad2 in transforming growth factor-beta signaling. J Biol Chem. 2000;275:36818–36822. doi: 10.1074/jbc.C000580200. [DOI] [PubMed] [Google Scholar]
- 38.Ma G, Allen TJ, Cooper ME, Cao Z. Calcium channel blockers, either amlodipine or mibefradil, ameliorate renal injury in experimental diabetes. Kidney Int. 2004;66:1090–1098. doi: 10.1111/j.1523-1755.2004.00859.x. [DOI] [PubMed] [Google Scholar]
- 39.Mankhey R, Wells CC, Bhatti F, Maric C. 17-beta estradiol supplementation reduces tubulointerstitial fibrosis by increasing MMP activity in the diabetic kidney. Am J Physiol-Reg, Integr, Comp Physiol. 2006;292:R769–R777. doi: 10.1152/ajpregu.00375.2006. [DOI] [PubMed] [Google Scholar]
- 40.Mankhey RW, Bhatti F, Maric C. 17beta-Estradiol replacement improves renal function and pathology associated with diabetic nephropathy. Am J Physiol Renal Physiol. 2005;288:F399–F405. doi: 10.1152/ajprenal.00195.2004. [DOI] [PubMed] [Google Scholar]
- 41.Maric C, Sandberg K, Hinojosa-Laborde C. Glomerulosclerosis and Tubulointerstitial Fibrosis are Attenuated with 17beta-Estradiol in the Aging Dahl Salt Sensitive Rat. J Am Soc Nephrol. 2004;15:1546–1556. doi: 10.1097/01.asn.0000128219.65330.ea. [DOI] [PubMed] [Google Scholar]
- 42.Mason RM, Wahab NA. Extracellular matrix metabolism in diabetic nephropathy. J Am Soc Nephrol. 2003;14:1358–1373. doi: 10.1097/01.asn.0000065640.77499.d7. [DOI] [PubMed] [Google Scholar]
- 43.Matsuda T, Yamamoto T, Muraguchi A, Saatcioglu F. Cross-talk between transforming growth factor-beta and estrogen receptor signaling through Smad3. J Biol Chem. 2001;276:42908–42914. doi: 10.1074/jbc.M105316200. [DOI] [PubMed] [Google Scholar]
- 44.McLennan SV, Kelly DJ, Cox AJ, Cao Z, Lyons JG, Yue DK, Gilbert RE. Decreased matrix degradation in diabetic nephropathy: effects of ACE inhibition on the expression and activities of matrix metalloproteinases. Diabetologia. 2002;45:268–275. doi: 10.1007/s00125-001-0730-4. [DOI] [PubMed] [Google Scholar]
- 45.Metcalfe PD, Meldrum KK. Sex differences and the role of sex steroids in renal injury. J Urol. 2006;176:15–21. doi: 10.1016/S0022-5347(06)00490-3. [DOI] [PubMed] [Google Scholar]
- 46.Nakagawa T, Li JH, Garcia G, Mu W, Piek E, Bottinger EP, Chen Y, Zhu HJ, Kang DH, Schreiner GF, Lan HY, Johnson RJ. TGF-beta induces proangiogenic and antiangiogenic factors via parallel but distinct Smad pathways. Kidney Int. 2004;66:605–613. doi: 10.1111/j.1523-1755.2004.00780.x. [DOI] [PubMed] [Google Scholar]
- 47.Nangaku M. Mechanisms of tubulointerstitial injury in the kidney: final common pathways to end-stage renal failure. Intern Med. 2004;43:9–17. doi: 10.2169/internalmedicine.43.9. [DOI] [PubMed] [Google Scholar]
- 48.Negulescu O, Bognar I, Lei J, Devarajan P, Silbiger S, Neugarten J. Estradiol reverses TGF-beta1-induced mesangial cell apoptosis by a casein kinase 2-dependent mechanism. Kidney Int. 2002;62:1989–1998. doi: 10.1046/j.1523-1755.2002.00679.x. [DOI] [PubMed] [Google Scholar]
- 49.Neugarten J, Acharya A, Lei J, Silbiger S. Selective estrogen receptor modulators suppress mesangial cell collagen synthesis. Am J Physiol Renal Physiol. 2000;279:F309–F318. doi: 10.1152/ajprenal.2000.279.2.F309. [DOI] [PubMed] [Google Scholar]
- 50.Neugarten J, Acharya A, Silbiger SR. Effect of gender on the progression of nondiabetic renal disease: a meta-analysis. J Am Soc Nephrol. 2000;11:319–329. doi: 10.1681/ASN.V112319. [DOI] [PubMed] [Google Scholar]
- 51.Nicholas SB, Aguiniga E, Ren Y, Kim J, Wong J, Govindarajan N, Noda M, Wang W, Kawano Y, Collins A, Hsueh WA. Plasminogen activator inhibitor-1 deficiency retards diabetic nephropathy. Kidney Int. 2005;67:1297–1307. doi: 10.1111/j.1523-1755.2005.00207.x. [DOI] [PubMed] [Google Scholar]
- 52.Oldfield MD, Bach LA, Forbes JM, Nikolic-Paterson D, McRobert A, Thallas V, Atkins RC, Osicka T, Jerums G, Cooper ME. Advanced glycation end products cause epithelial-myofibroblast transdifferentiation via the receptor for advanced glycation end products (RAGE) J Clin Invest. 2001;108:1853–1863. doi: 10.1172/JCI11951. [DOI] [PMC free article] [PubMed] [Google Scholar]
- 53.Park JS, Jung HH, Yang WS, Kim SB, Min WK, Chi HS. Effects of hormonal replacement therapy on lipid and haemostatic factors in post-menopausal ESRD patients. Nephrol Dial Transplant. 2000;15:1835–1840. doi: 10.1093/ndt/15.11.1835. [DOI] [PubMed] [Google Scholar]
- 54.Paueksakon P, Revelo MP, Ma LJ, Marcantoni C, Fogo AB. Microangiopathic injury and augmented PAI-1 in human diabetic nephropathy. Kidney Int. 2002;61:2142–2148. doi: 10.1046/j.1523-1755.2002.00384.x. [DOI] [PubMed] [Google Scholar]
- 55.Phillips AO. The role of renal proximal tubular cells in diabetic nephropathy. Curr Diab Rep. 2003;3:491–496. doi: 10.1007/s11892-003-0013-1. [DOI] [PubMed] [Google Scholar]
- 56.Phillips AO, Steadman R. Diabetic nephropathy: the central role of renal proximal tubular cells in tubulointerstitial injury. Histol Histopathol. 2002;17:247–252. doi: 10.14670/HH-17.247. [DOI] [PubMed] [Google Scholar]
- 57.Potier M, Elliot SJ, Tack I, Lenz O, Striker GE, Striker LJ, Karl M. Expression and regulation of estrogen receptors in mesangial cells: influence on matrix metalloproteinase-9. J Am Soc Nephrol. 2001;12:241–251. doi: 10.1681/ASN.V122241. [DOI] [PubMed] [Google Scholar]
- 58.Potier M, Karl M, Zheng F, Elliot SJ, Striker GE, Striker LJ. Estrogen-related abnormalities in glomerulosclerosis-prone mice: reduced mesangial cell estrogen receptor expression and prosclerotic response to estrogens. Am J Pathol. 2002;160:1877–1885. doi: 10.1016/S0002-9440(10)61134-0. [DOI] [PMC free article] [PubMed] [Google Scholar]
- 59.Praga M, Morales E. Renal damage associated with proteinuria. Kidney Int Suppl. 2002:42–46. doi: 10.1046/j.1523-1755.62.s82.9.x. [DOI] [PubMed] [Google Scholar]
- 60.Rodriguez WE, Tyagi N, Joshua IG, Passmore JC, Fleming JT, Falcone JC, Tyagi SC. Pioglitazone mitigates renal glomerular vascular changes in high-fat, high-calorie-induced type 2 diabetes mellitus. Am J Physiol Renal Physiol. 2006;291:F694–F701. doi: 10.1152/ajprenal.00398.2005. [DOI] [PubMed] [Google Scholar]
- 61.Saito T, Sumithran E, Glasgow EF, Atkins RC. The enhancement of aminonucleoside nephrosis by the co-administration of protamine. Kidney Int. 1987;32:691–699. doi: 10.1038/ki.1987.262. [DOI] [PubMed] [Google Scholar]
- 62.Schiffer M, Schiffer LE, Gupta A, Shaw AS, Roberts IS, Mundel P, Bottinger EP. Inhibitory smads and tgf-Beta signaling in glomerular cells. J Am Soc Nephrol. 2002;13:2657–2666. doi: 10.1097/01.asn.0000033276.06451.50. [DOI] [PubMed] [Google Scholar]
- 63.Schrijvers BF, De Vriese AS, Flyvbjerg A. From hyperglycemia to diabetic kidney disease: the role of metabolic, hemodynamic, intracellular factors and growth factors/cytokines. Endocr Rev. 2004;25:971–1010. doi: 10.1210/er.2003-0018. [DOI] [PubMed] [Google Scholar]
- 64.Sharma K, Ziyadeh FN, Alzahabi B, McGowan TA, Kapoor S, Kurnik BR, Kurnik PB, Weisberg LS. Increased renal production of transforming growth factor-beta1 in patients with type II diabetes. Diabetes. 1997;46:854–859. doi: 10.2337/diab.46.5.854. [DOI] [PubMed] [Google Scholar]
- 65.Silbiger S, Lei J, Neugarten J. Estradiol suppresses type I collagen synthesis in mesangial cells via activation of activator protein-1. Kidney Int. 1999;55:1268–1276. doi: 10.1046/j.1523-1755.1999.00376.x. [DOI] [PubMed] [Google Scholar]
- 66.Silbiger S, Lei J, Ziyadeh FN, Neugarten J. Estradiol reverses TGF-beta1-stimulated type IV collagen gene transcription in murine mesangial cells. Am J Physiol. 1998;274:F1113–F1118. doi: 10.1152/ajprenal.1998.274.6.F1113. [DOI] [PubMed] [Google Scholar]
- 67.Silbiger SR, Neugarten J. The role of gender in the progression of renal disease. Adv Ren Replace Ther. 2003;10:3–14. doi: 10.1053/jarr.2003.50001. [DOI] [PubMed] [Google Scholar]
- 68.Susztak K, Raff AC, Schiffer M, Bottinger EP. Glucose-induced reactive oxygen species cause apoptosis of podocytes and podocyte depletion at the onset of diabetic nephropathy. Diabetes. 2006;55:225–233. [PubMed] [Google Scholar]
- 69.Szekacs B, Vajo Z, Varbiro S, Kakucs R, Vaslaki L, Acs N, Mucsi I, Brinton EA. Postmenopausal hormone replacement improves proteinuria and impaired creatinine clearance in type 2 diabetes mellitus and hypertension. BJOG. 2000;107:1017–1021. doi: 10.1111/j.1471-0528.2000.tb10406.x. [DOI] [PubMed] [Google Scholar]
- 70.Togawa A, Yamamoto T, Suzuki H, Fukasawa H, Ohashi N, Fujigaki Y, Kitagawa K, Hattori T, Kitagawa M, Hishida A. Ubiquitin-dependent degradation of Smad2 is increased in the glomeruli of rats with anti-thymocyte serum nephritis. Am J Pathol. 2003;163:1645–1652. doi: 10.1016/S0002-9440(10)63521-3. [DOI] [PMC free article] [PubMed] [Google Scholar]
- 71.Tomiyoshi Y, Sakemi T, Aoki S, Miyazono M. Different effects of castration and estrogen administration on glomerular injury in spontaneously hyperglycemic Otsuka Long-Evans Tokushima Fatty (OLETF) rats. Nephron. 2002;92:860–867. doi: 10.1159/000065442. [DOI] [PubMed] [Google Scholar]
- 72.Wang W, Koka V, Lan HY. Transforming growth factor-beta and Smad signalling in kidney diseases. Nephrology (Carlton) 2005;10:48–56. doi: 10.1111/j.1440-1797.2005.00334.x. [DOI] [PubMed] [Google Scholar]
- 73.Weigert C, Brodbeck K, Klopfer K, Haring HU, Schleicher ED. Angiotensin II induces human TGF-beta 1 promoter activation: similarity to hyperglycaemia. Diabetologia. 2002;45:890–898. doi: 10.1007/s00125-002-0843-4. [DOI] [PubMed] [Google Scholar]
- 74.Wells CC, Riazi S, Mankhey RW, Bhatti F, Ecelbrager C, Maric C. Diabetic nephropathy is associated with decreased circulating estradiol levels and imbalance in the expression of renal estrogen receptors. Gender Medicine. 2005;2:227–237. doi: 10.1016/s1550-8579(05)80052-x. [DOI] [PubMed] [Google Scholar]
- 75.Wendt T, Tanji N, Guo J, Hudson BI, Bierhaus A, Ramasamy R, Arnold B, Nawroth PP, Yan SF, D’Agati V, Schmidt AM. Glucose, glycation, and RAGE: implications for amplification of cellular dysfunction in diabetic nephropathy. J Am Soc Nephrol. 2003;14:1383–1395. doi: 10.1097/01.asn.0000065100.17349.ca. [DOI] [PubMed] [Google Scholar]
- 76.Wolf G. Growth factors and the development of diabetic nephropathy. Curr Diab Rep. 2003;3:485–490. doi: 10.1007/s11892-003-0012-2. [DOI] [PubMed] [Google Scholar]
- 77.Wrana JL. Regulation of Smad activity. Cell. 2000;100:189–192. doi: 10.1016/s0092-8674(00)81556-1. [DOI] [PubMed] [Google Scholar]
- 78.Xiao S, Gillespie DG, Baylis C, Jackson EK, Dubey RK. Effects of estradiol and its metabolites on glomerular endothelial nitric oxide synthesis and mesangial cell growth. Hypertension. 2001;37:645–650. doi: 10.1161/01.hyp.37.2.645. [DOI] [PubMed] [Google Scholar]
- 79.Yamamoto T, Nakamura T, Noble NA, Ruoslahti E, Border WA. Expression of transforming growth factor beta is elevated in human and experimental diabetic nephropathy. Proc Natl Acad Sci USA. 1993;90:1814–1818. doi: 10.1073/pnas.90.5.1814. [DOI] [PMC free article] [PubMed] [Google Scholar]
- 80.Ziyadeh F. The extracellular matrix in diabetic nephropathy. Am J Kidney Dis. 1993;22:736–744. doi: 10.1016/s0272-6386(12)80440-9. [DOI] [PubMed] [Google Scholar]


