Abstract
This paper reports measurements of land–atmosphere fluxes of sensible and latent heat, momentum, CO2, volatile organic compounds (VOCs), NO, NO2, N2O and O3 over a 30 m high rainforest canopy and a 12 m high oil palm plantation in the same region of Sabah in Borneo between April and July 2008. The daytime maximum CO2 flux to the two canopies differs by approximately a factor of 2, 1200 mg C m−2 h−1 for the oil palm and 700 mg C m−2 h−1 for the rainforest, with the oil palm plantation showing a substantially greater quantum efficiency. Total VOC emissions are also larger over the oil palm than over the rainforest by a factor of 3. Emissions of isoprene from the oil palm canopy represented 80 per cent of the VOC emissions and exceeded those over the rainforest in similar light and temperature conditions by on average a factor of 5. Substantial emissions of estragole (1-allyl-4-methoxybenzene) from the oil palm plantation were detected and no trace of this VOC was detected in or above the rainforest. Deposition velocities for O3 to the rainforest were a factor of 2 larger than over oil palm. Emissions of nitrous oxide were larger from the soils of the oil palm plantation than from the soils of the rainforest by approximately 25 per cent. It is clear from the measurements that the large change in the species composition generated by replacing rainforest with oil palm leads to profound changes in the net exchange of most of the trace gases measured, and thus on the chemical composition of the boundary layer over these surfaces.
Keywords: oil palm, rainforest, trace gas emissions, carbon exchange, micrometeorology
1. Introduction
This is the first of three closely related papers on the effects of land use in the tropics on atmospheric composition and climate. The subject area is much larger than the scope of the three papers, which are focused on the effects of changing rainforest into oil palm plantations on atmospheric composition and chemistry. The measurements to support the analysis were made over rainforest and oil palm plantations from tower-based micrometeorological instruments, and more widely in the boundary layer using a research aircraft in Sabah, Malaysia, in 2008 in the OP3 project (‘Oxidant and Particle Photochemical Processes above a South-East Asian Tropical Rainforest’ [1]). The focus of this paper is on the plant canopy and the landscape scale, considering the differences in net surface–atmosphere exchange fluxes of energy and trace gases between the two contrasting land uses. The second paper [2] considers the atmospheric chemistry at the local and regional scale of emissions from the two contrasting land uses and the third paper [3] considers the larger scale atmospheric impacts.
The effect of land use on trace gas exchange forms part of the wider study of the exchange of mass and energy between terrestrial surfaces and the atmosphere, which has been in progress for much of the last century. The earlier work was mainly devoted to physical processes, including the capture of solar radiation by terrestrial vegetation, the associated partitioning into sensible and latent heat fluxes, and interactions between the wind and plant canopies. The exchange of sensible and latent heat and momentum, and the underlying physics of the exchange processes, remains a primary driver of a research agenda in which there are large feedbacks to climate. The underlying physical processes are reasonably well understood, and fluxes of sensible and latent heat and momentum above extensive tracts of vegetation are routinely measured, mainly using eddy covariance methods. While these aspects of the science are not the main focus of this paper, differences in the canopy–atmosphere exchange of energy between these contrasting surfaces are likely to have substantial effects on the trace gas fluxes and form an important part of the context for the trace gas fluxes.
The measurement of trace gas fluxes other than water vapour over vegetation began with CO2 [4], using an aerodynamic flux-gradient technique, and the net exchange of CO2 has remained a priority for flux measurement ever since. The measurement of net ecosystem CO2 exchange has become routine, and networks of monitoring sites over Europe (CarboEurope) and North America (Ameriflux) have accumulated many site-years of direct measurements [5]. The subject has attracted considerable research and wider public interest over the last two decades as the interactions between terrestrial surfaces and the atmosphere have been shown to have strong feedbacks into the climate system. The primary focus of quantifying the net seasonal exchange of carbon by terrestrial ecosystems remains an important objective, and it has proved a major challenge to measure the net annual atmosphere exchange of carbon directly. There are several problems in obtaining this value. First, while in fully turbulent conditions the net uptake by plant canopies may be measured with adequate precision and accuracy by eddy covariance, the nocturnal respiration by vegetation and soil has proved a challenge. The main problem with the nocturnal measurements is that in areas with strong atmospheric stability and low wind speeds, the respired CO2 flux leads to accumulation within the canopy and surface layers of the atmosphere, below the measurement point, and is not readily measurable by an eddy flux system on a tower that is effectively decoupled from the surface [6].The problem has proved particularly challenging in the tropics and the additional complexity in local flows of drainage air in calm conditions in complex terrain further complicates the interpretation of field data. Thus, while the basic measurement is straightforward, there remain important uncertainties in the net long-term fluxes of CO2, which form a part of the measurements reported here and in related papers from the OP3 consortium.
The development of annual net exchange time series from semi-continuous flux measurements has provided a pragmatic way forward, and gap-filling of the data to generate the continuous record has provided a methodology to obtain a continuous record [5].
The list of trace gas fluxes measured by micrometeorological methods and the range of techniques employed have expanded greatly through the last four decades and now include a range of volatile organic compounds (VOCs), ozone (O3), sulphur dioxide (SO2), dimethyl sulphide and carbonyl sulphide, the reactive nitrogen species, nitric oxide (NO), nitrogen dioxide (NO2), nitric acid (HNO3) and ammonia (NH3), and particles ranging in size from 10 nm to 10 µm, reviewed recently [7]. In addition to CO2, the other greenhouse gases methane (CH4) and nitrous oxide (N2O) have also become priority trace gases for flux measurement [8].
The majority of recent trace gas flux measurements have been made over temperate ecosystems, especially within Europe and North America, thus there remain many ecosystems over which few measurements have been made. In particular, tropical ecosystems have become a focus, and most tropical forest flux measurements have been made over the Amazon forest [9]. Flux measurements of heat and water vapour over tropical forests began at a site close to Manaus in the Amazon basin in the 1980s [10] and were extended to CO2 and to many of the compounds listed above. However, these vital measurements in the Amazon basin represent a small fraction of the global literature on land–atmosphere exchange, and for many tropical forests there are no measurements. A recent campaign of flux measurements over tropical forests in Borneo at Danum Valley has provided a complementary series of measurements of a wide range of trace gases [1]. In addition to fluxes of VOCs and CO2, measurements were also made of aerosols over the rainforest [11]. The major change in land use in progress in Borneo is from rainforest to oil palm, and to study the effects of these changes, an additional set of measurements over oil palm (H2O, CO2, VOCs, O3, aerosols) were made. The primary papers reporting the measurements are provided by Misztal et al. [12] and Whitehead et al. [13]. This paper provides an overview of the data from Borneo and a summary of trace gas exchange over these two contrasting surfaces. The effects on air chemistry locally and at larger scales are described in two companion papers [2,3].
2. Methods
(a). Site and canopy characteristics
(i). Oil palm measurement site
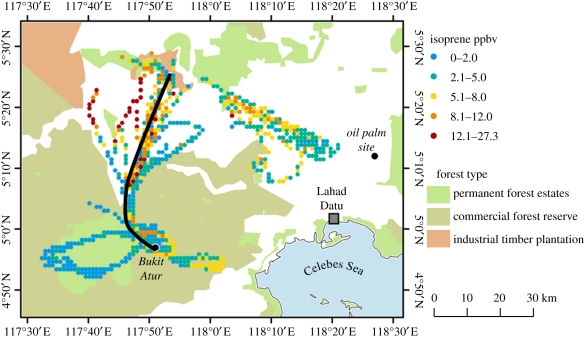
The sites of the measurements in Sabah in Eastern Borneo (Sabahmas oil palm plantation coordinates 5°14′58.69″ N, 118°27′15.76″ E) are shown in figure 1. The flux measurements were made from a 15 m high pump-up tower over extensive oil palm at the Sabahmas plantation, 28 km northeast of Lahad Datu. The canopy of oil palm (Elaeis guineensis×Elaesis oleifera) has an average height of 12 m and a (single-sided, projected) leaf area index of approximately 6, and comprises trees planted at a density of 150 ha−1 with little ground-level vegetation and mostly bare soil and dead oil palm fronds. The fetch available for the measurements extends to 300 m in most directions, and the region is extensively covered by oil palm plantations. During the measurement period, the ground was largely dry, in contrast to the rainforest, although it periodically floods during the wetter season.
Figure 1.
Location of flux measurement sites over the rainforest (at Bukit Atur) and oil palm (Sabahmas) in the Malaysian state of Sabah on Borneo. The tracks of the aircraft sampling in the region during the OP3 campaign are shown as coloured dots, with the colour representing measured isoprene concentrations (adapted from MacKenzie [2] and Hewitt et al. [14]).
(ii). Forest canopy measurement site (Bukit Atur near Danum Valley)
The rainforest measurements were made at Bukit Atur, near Danum Valley (4°58′49.10″ N, 117°51′19.12″ E) in Eastern Sabah, from a 100 m high tower that forms part of the Global Atmospheric Watch (GAW) network. The tower is on a small hill 260 m above the valley bottom and is at an altitude of 437 m above sea level (a.s.l.). The surrounding rainforest is either virgin or has not been logged since 1988 [15]. The approximately 440 km2 conservation area to the west of the site is primary (or unlogged) rainforest; the rest of the region (except for the marked water catchment area) has been logged incrementally by a fixed logging area in the 1970s, with all ‘healthy and commercially viable trees with a diameter at breast height (d.b.h.) >60 cm’ extracted [16].
The measurements of fluxes from the tower sampled over a larger area of the forest, including some primary forest with rather different species composition. Newbery et al. [16] conducted a field survey in this region of primary rainforest. They showed that for trees greater than or equal to 30 cm d.b.h., the Euphorbiaceae contribute the most to density at 21 per cent, with Dipterocarpaceae second at 16 per cent; corresponding basal areas are 7 and 49 per cent. For trees greater than or equal to 10 cm d.b.h., density of the Euphorbiaceae reaches 28 per cent, Dipterocarpaceae 9 per cent, followed by Annonaceae 8 per cent, Lauraceae 7 per cent and Meliaceae 6 per cent. Lauraceae was the most species-rich family (83 species), then Euphorbiaceae (51 species) and Meliaceae (36 species). The rainforest canopy species composition differs markedly from the monoculture oil palm canopy, both in morphology and species composition. Remarkably, the two surfaces showed similar total leaf areas of about 6, but distributed very differently in the vertical and in morphology.
The contrast with oil palm is therefore quite striking, with a single species of even-aged plants providing a rather uniform canopy of palm fronds between 4 and 10 m above ground and almost bare ground below the canopy. The rainforest in contrast is very uneven, and comprises a diverse mixture of trees varying in height from a few metres to 40 m and lower layers of vegetation through the canopy to the ground layer, at which a complex community of species from mosses and ferns through to higher plants and seedlings of canopy species is present and no bare soil is visible.
(b). Measurement techniques
The measurement technique used was based on eddy covariance [5]. The local vertical flux is given by the covariance between instantaneous deviations (sampled at several hertz) in vertical wind speed (w′) from its mean value ( ) and the instantaneous deviations in gas concentration (χ′) from its mean value (
 ) (equation (2.1)), taking into account any potential shift (τ) in the time series owing to sampling inlets:
| 2.1 |
The measured local flux represents the surface flux only if several important conditions are fulfilled:
— Measurements need to be made in the constant flux layer, in which fluxes of heat and momentum are independent of height. Such a layer develops over uniform vegetation. The measurement point samples from an upwind area of the surface (the footprint) and the footprint of the measured 30 min average flux extends typically in the upwind direction over a distance approximately 100× the height above ground of the measurement point. The footprint varies with wind speed and stability, being much greater in stable conditions and smallest in strongly unstable conditions. The fetch provided by the canopies of vegetation extended for 300 m in all directions at the oil palm site and for several kilometres at the rainforest.
— Equation (2.1) requires that the measurement averaging period is sufficiently long so that the full range of eddies contributing to the vertical exchange is measured, and given the small size of some contributing eddies, the response times of instruments impose important constraints on instrumentation.
— Fluxes are conserved with height (e.g. negligible air chemistry in the canopy space).
— The application of equation (2.1) requires the mean vertical flow to be negligible. In these conditions, there is no divergence or convergence of the flux between the measurement height and the surface, so that the measured flux represents the net vertical exchange of the entity under consideration (χ) over the footprint of the surface.
The measurements of fluxes of sensible and latent heat, momentum, water vapour, CO2, O3 and aerosols were all made by eddy covariance as described. The measurements of the VOC fluxes were made by the virtual disjunct eddy covariance method as described by Langford et al. [11]. The technique provided half hour average flux measurements of a wide range of VOC species at friction velocities above 0.15 ms−1. The range of corrections to the data and signal processing are also described in detail for the two canopies [11,12] and follow a common protocol at both sites used in this paper. For compounds emitted from the canopy, emission fluxes are reported directly, whereas in the case of compounds deposited onto the forest canopy, the deposition rate was characterized by the deposition velocity (vd) calculated as
| 2.2 |
The instruments at the oil palm site were mounted on the pump-up mast extending above the plant canopy with a sonic anemometer (Solent R3, Gill Instruments) and an open-path infrared gas analyser (IRGA; Li-COR 7200) for H2O and CO2 mounted at a height of 15 m, and a sampling inlet for trace gas analysis close to the frame of the Gill anemometer. The heated PTFE sampling tube (1/4″ outside diameter) was pumped at 35 l min−1 and sub-sampled by a proton transfer reaction mass spectrometer (PTR-MS, Ionicon GmbH, Innsbruck, Austria) at 0.4 l min−1, with the PTR-MS located below canopy in an enclosure.
The measurements over the rainforest were made on a 100 m tower, with most flux measurements made at a height of 75 m and additional O3 and aerosol flux measurements made from a lower height of 45 m. Here, the PTR-MS and an additional closed-path IRGA (Li-COR 7000) were housed in a laboratory at the foot of the tower and sub-sampled from an 80 m long 3/8″ OD Teflon inlet line, flushed at 60 l min−1. At both sites, a weather station (WXT510 Weather transmitter, Vaisala) was operated above the canopy, together with a rapid ozone flux instrument [17], based on the dry chemiluminescence method.
The micrometeorology of the rainforest site is described in detail by Helfter et al. [18], and an overview of the main results of the experiment are provided by Hewitt et al. [1], together with a full list of the instrumentation used for the chemical (concentration) measurements.
3. Results and discussion
(a). Measurements of energy and momentum exchange over rainforest and oil palm canopies
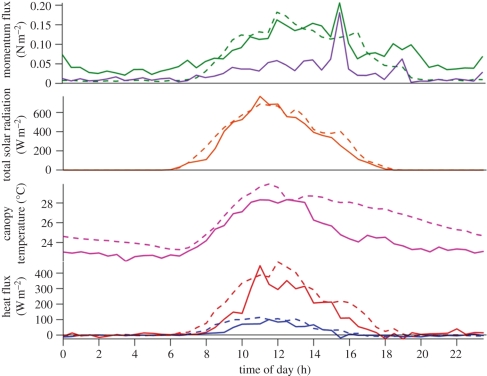
The canopy–atmosphere micrometeorological data obtained during the OP3 campaign have been averaged to show the diurnal development of the energy fluxes during the 30 days of measurement during 2008. The data in figure 2 show the momentum flux, total irradiance and air temperature at the height of the flux measurements, and the partitioning of the available energy into latent and sensible heat fluxes. The forest and oil palm canopies show similar momentum fluxes at similar wind speeds, implying drag coefficients for the two canopies of the same order. The momentum fluxes were between 0.1 and 0.2 N m–2 in daytime conditions, declining to negligible values during the hours of darkness, with strong stability developing between the canopy top and higher levels, effectively decoupling the surface from the free troposphere.
Figure 2.
Averaged diurnal profiles of the energy fluxes and air temperature from 30 days of measurements over forest (solid lines) and oil palm (dashed lines) vegetation during the OP3 campaigns in summer 2008. Solid purple line, in-canopy (32 m); blue lines, sensible heat; red lines, latent heat. (adapted from Helfter et al. [18]).
It is notable that the momentum fluxes are larger over the forest at night, a reflection of the substantially higher instrument location at the forest site (75 m) at which the measurements were largely decoupled from the immediate surface as marked by a distinct temperature inversion at the canopy top and the formation of an associated fog layer. In these conditions, the measured momentum flux represents much larger scale dynamics and is not comparable with the measurements over the oil palm at a height of 15 m, just above the palm canopy.
The averaged diurnal profiles of momentum and the underlying latent and sensible heat fluxes show some interesting features. The heat fluxes are strongly coupled to the cycle in solar radiation and are in-phase, whereas the momentum fluxes, in the absence of strong regional pressure gradients, are also coupled but lag behind the primary energy drivers of sensible and latent heat fluxes and are consistent with the gradual development of deep convection during the morning, leading to showers and their associated turbulence later in the day. In this way, the momentum flux continues into the evening along with the associated shower activity, long after sensible and latent heat fluxes have declined to negligible values. The momentum flux then declines through the night. The two canopies, despite large differences in morphology and species composition, show broadly similar rates of turbulent exchange that are driven primarily by the convection generated by the large latent heat fluxes from the surface. For both sites, the mean wind speeds (not shown) are small and show a pronounced diurnal cycle, with the largest values in the afternoon and a minimum during the early hours of the morning (02.00–06.00).
The majority of the available energy is used to drive evaporation from both canopies, with midday values of the latent heat flux of nearly 400 W m−2 and sensible heat fluxes of approximately 100 W m−2 (figure 2). These lead to average Bowen ratios for these sites of between 0.2 and 0.4 for the oil palm and rainforest, respectively. Averaging the data for the period 09.00–11.00 for the entire campaign shows the largest latent heat fluxes and smallest Bowen ratios for the oil palm plantation (table 1). For both canopies, the afternoon period, with frequent rain, leads to even smaller Bowen ratios than during the morning hours and even more of the available energy being used in the latent heat flux (figure 2 and table 2). While both canopies use most of the available energy for evaporation, the latent heat and sensible heat fluxes are larger over the oil palm plantation owing to greater availability of solar radiation, especially in the afternoon, a consequence of the greater cloudiness and higher rainfall at the forest location. The later morning rise in the sensible heat flux at the rainforest may be a consequence of the greater energy used to evaporate the cloud layer at the top of the canopy over the rainforest, below the measurement height.
Table 1.
Bowen ratio measurements over the oil palm and rainforest canopies during the OP3 campaign. The data have been averaged to show the average difference between morning (09.00–11.00) and afternoon (12.00–15.00) and the differences between the two canopies.
| oil palm |
rain forest |
|||
|---|---|---|---|---|
| am | pm | am | pm | |
| mean | 0.29 | 0.06 | 0.47 | 0.19 |
| s.d. | 0.05 | 0.09 | 0.37 | 0.20 |
| median | 0.28 | 0.08 | 0.39 | 0.16 |
Table 2.
The mean daily total rainfall, sensible and latent heat fluxes at the rainforest and oil palm sites in the 30 day OP3 campaign in Sabah 2008 (adapted from Helfter et al. [18]).
| 30 day mean | rainforest | oil palm |
|---|---|---|
| rainfall (mm d−1) | 13 | 2.1 |
| sensible heat (MJ m−2 d−1) | 1.3 | 2.1 |
| latent heat (MJ m−2 d−1) | 6.7 | 7.8 |
The first clear feature of the two canopies is that the oil palm latent heat fluxes are larger and account for a larger proportion of available energy. At first, this seems counterintuitive, as rainforests are wet in the lower layers of the canopy almost all the time and the upper canopy is wet for much of the afternoon, evening and night following the heavy showers in the afternoon and evening. However, the latent heat flux requires available energy and the average available energy is smaller at the forest location owing to increased cloudiness. The forest site was also wetter than the oil palm plantation, with the daily rainfall averaging 13 mm at the forest and only 2.1 mm at the oil palm through the measurement period. Rainfall increases as the air is advected inland over the moist vegetation and elevated by the topography; the rainforest site is further inland and at higher elevations and therefore has significantly greater rainfall. The average diurnal cycle in air temperature (figure 2) shows nocturnal values larger at the oil palm site owing to the lower altitude while the difference increases during the day owing to slightly greater radiant heating of the surface, as a result of the greater cloudiness at the rainforest.
(b). Carbon and biogenic volatile organic compound fluxes over the oil palm and rainforest
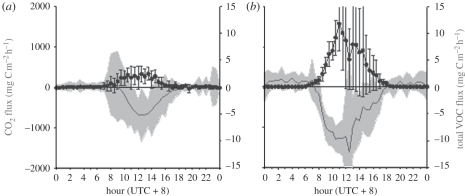
The measurement sites provided continuous daytime measurements of the CO2 flux and a range of VOC species. Daily averaged fluxes of VOCs and CO2 for the forest and oil palm sites are shown in figure 3 for the entire measurement period.
Figure 3.
Diurnal profiles of CO2 (solid line) and total VOC-C fluxes (the sum of isoprene, monoterpenes, methanol, acetaldehyde, acetone, acetic acid, MVK + MACR, hexanal and EVK fluxes; squares) measured over (a) the rainforest at Danum Valley and (b) the oil palm plantation at Sabahamas during 30 days of the OP3 campaign in Sabah; the error bars and the shaded area denote ±1 s.d. of the mean values (adapted from Langford et al. [11]).
The net uptake of CO2 by the oil palm canopy from the boundary layer increases rapidly with increasing available radiation following sunrise, becoming significant by 08.00, reaching a maximum at approximately 10.00 and continuing at the maximum rate for between 3 and 4 h before declining more slowly through the afternoon, reaching zero at approximately sunset and then becoming negative through the night. The very low wind speeds and lack of turbulence preclude satisfactory flux measurements during the night, so while the indication of net respiration fluxes in the data obtained is correct, the absolute values obtained directly from the instrumentation are substantial underestimates of the real surface fluxes. A range of methods to estimate nocturnal respiration have been developed (e.g. [5]), but these lie outside the scope of this study in which the focus is on daytime conditions. The net CO2 uptake by the rainforest (figure 3) is somewhat later than at the oil palm site, and does not show significant uptake from the boundary layer until about 09.30 and then increases through until midday. There is however a period soon after sunrise with upward fluxes from the canopy, as the accumulated nocturnally respired CO2 accumulated in the approximately 30 m forest canopy and up to the level of the flux measurement (75 m) reconnects with the boundary layer above the canopy. The release of CO2 follows the breakdown of the nocturnal inversion. Some of the respired CO2 is consumed by the early photosynthesis but the excess appears as an upward flux from the canopy and has been commonly observed in measurements over rainforests [19]. The consequence of this effect is that the net drawdown from the boundary layer does not begin until 09.30, an hour and a half later than the oil palm canopy. More quantitatively, the maximum rates of uptake by the rainforest, at approximately 600 mg C m−2 h−1, are only about half those of the oil palm canopy, where the maximum rates of CO2 uptake reach approximately 1200 mg C m−2 h−1. The period of maximum uptake by the two canopies also differs, with the rainforest carbon uptake declining more rapidly than the oil palm canopy carbon uptake, owing to the rapid decline in radiation during the afternoon, with the intensity and frequency of rain at the forest exceeding that at the oil palm site (table 2).
The average daytime carbon fluxes into these contrasting canopies differ appreciably, with the rates of net CO2 uptake into the oil palm exceeding those at the rainforest. With an average of 25.8 g C m−2 d−1, the oil palm average net daytime CO2 uptake is more than a factor of 2 larger than that of the rainforest (10.1 g C m−2 d−1), calculated as the integrated flux between 08.00 and 18.00 scaled up to an average day over the measurement period. Care must be exercised in the interpretation of these data. Some of the difference may be due to the forest consuming a substantial fraction of the nocturnal respiration, while some of the oil palm nocturnal respiration may have been emitted to the atmosphere and not captured by the eddy covariance system at night, i.e. the detected respiration may have different temporal patterns at the two sites. The difference in available radiation at the two sites is a small additional contributor to the difference. Figure 2 shows the average available radiation at the two sites during the measurements, with a marginally smaller daily total of available radiation at the rainforest location, mostly because of smaller values in the afternoons. The difference is however substantially smaller than the difference in productivity of the two canopies. Another likely contributor to the differences between the canopies is the management, and especially the nutrient supply. In the case of the rainforest, nutrients are provided by litter decomposition and wet and dry deposition of nutrients, especially nitrogen. The site of rainforest measurements at the Bukit Atur GAW tower is also the site of long-term measurements of atmospheric trace gases and rainfall composition. These measurements show wet deposition of nitrogen of approximately 5 kg N ha−1 annually. The atmospheric concentrations of NO2, HNO3 and NH3 and aerosol NO3− and NH4+ are all sufficiently small to make the dry deposition contributions smaller in total than 4 kg N ha−1 annually. Most of the N input into rainforest ecosystems is by biological fixation of molecular N2 rather than from atmospheric deposition [20]. The atmospheric inputs of total phosphorus to the forest are not quantified at the GAW monitoring station, but are also likely to be very small [21]. The inputs of nitrogen to the oil palm plantation are dominated by the fertilizer application to the plantation. The fertilizer inputs are placed close to each tree, rather than distributed over the plantation in the manner of an agricultural crop, but expressed on an area basis for the entire plantation the application rates are approximately 80 kg N ha−1 annually, nearly an order of magnitude larger than the estimates of reactive nitrogen inputs to the rainforest. Phosphorus is also included in the fertilizer inputs to the oil palm; there are no estimates of the phosphorus availability at the rainforest but P availability to the oil palms would have been substantially greater than that in the rainforest.
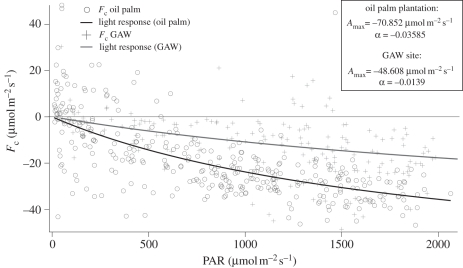
The differences in average daytime CO2 uptake between these canopies are substantial and appear to be due to a combination of the greater nutrient availability and larger average daily radiation available for the oil palm canopy. Of the two contributors, the nutrient availability seems to be the major cause of the increased productivity, which drives an enhanced photosynthetic efficiency of the oil palm canopy. This is supported by observed differences in the photosynthesis–light response curves for the two canopies, which can be derived directly from the flux measurements. The data for the two plant canopies (figure 4) show maximum rates of photosynthesis (Amax) and the quantum efficiency (α) of the oil palm canopy exceeding those of the rainforest by 50 per cent and a factor of 2, respectively, accounting for the difference in midday CO2 fluxes at similar light levels. The canopy leaf area indices are similar for the two canopies, being approximately 6 in both cases.
Figure 4.
Carbon assimilation light response curves for the rainforest and oil palm canopies during the OP3 campaign (adapted from Tuovinen et al. [22]). PAR, photosynthetically active radiation.
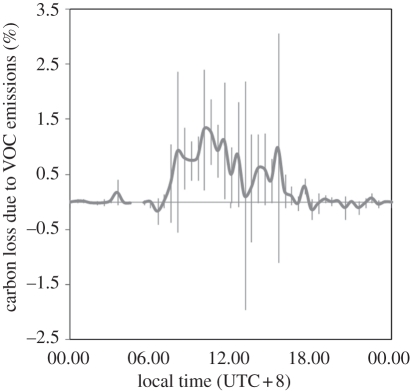
The other major feature of the carbon fluxes between these canopies is in the emission of VOC compounds. The total net VOC exchange comprises isoprene, monoterpenes, methanol, acetaldehyde, acetone, acetic acid, methyl vinyl ketone (MVK) and methacroline (MACR), hexanal and ethyl vinyl ketone (EVK) fluxes. The net daily emissions averaged over the 30 day campaign begin at daybreak and increase rapidly at both sites through the morning, reaching a maximum at approximately midday and decline through the afternoon, roughly in phase with the CO2 flux and available radiation for photosynthesis (figures 2, 3 and 5). The maximum in total VOC emissions from the oil palm canopy was approximately 21 mg m−2 h−1, while that for the rainforest averaged 4.4 mg m−2 h−1. The largest emission fluxes, from the oil palm canopy, were more than a factor of 4 larger than from the rainforest canopy. The fraction of the carbon uptake flux represented by emissions of VOCs is small, in the range 0.1–1%, but the data for these canopies suggest both a larger fraction of the uptake flux (at approx. 0.5%) for the oil palm relative to the rainforest (at 0.3%), and the overall magnitude of the flux being very much larger for the oil palm. The average fraction of the carbon loss through this process conceals considerable short-term variability, as shown in figure 5 [12].
Figure 5.
The diurnal cycle in net canopy carbon loss owing to biogenic VOC emissions from the oil palm plantation averaged over the measurement period (adapted from Misztal et al. [12]).
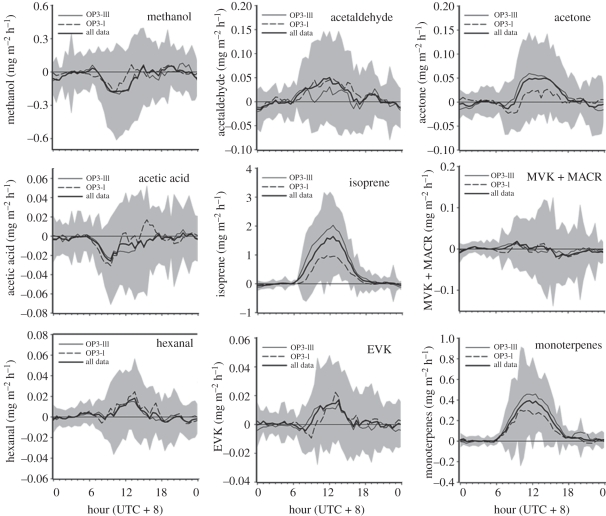
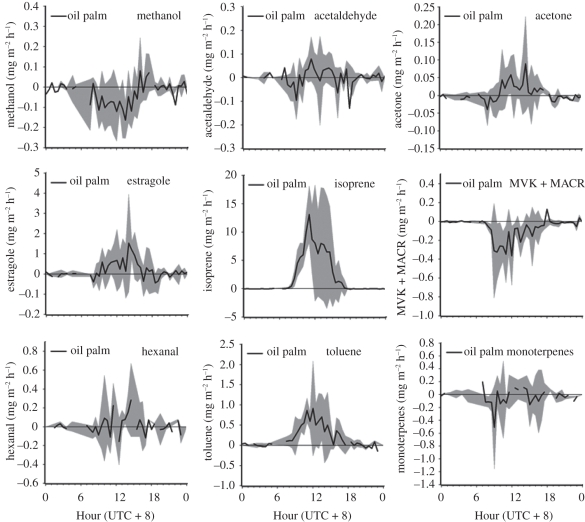
The composition of emitted VOC compounds differs considerably between the two canopies. The detailed fluxes are shown in figure 6 [11] for the rainforest and in figure 7 [12] for the oil palm plantation. The differences in the composition of the VOCs emitted by the two canopies are important in the atmospheric processing of the organic compounds, as they differ in their reactivity within the atmosphere and their ability to produce ozone [23] and organic aerosol. The detail of the chemical degradation of VOC compounds emitted by these plant canopies, and their influence on regional air chemistry, is the focus of the companion paper [2]. The larger scale consequences of the emissions are considered in the companion paper by Pyle et al. [3].
Figure 6.
Diurnal profiles of VOC fluxes over the rainforest at Danum Valley during the two OP3 campaigns in 2008 with the mean of all data as the solid line. The grey bands represent ±1 s.d. of the average hourly fluxes (adapted from Langford et al. [11]).
Figure 7.
Diurnal profiles of VOC fluxes over the oil palm plantation during the OP3 campaign in 2008. The grey bands represent ±1 s.d. of the average hourly fluxes (adapted from Misztal et al. [12]).
Both canopies emit isoprene (2-methyl-1,3-butadiene) but at very different rates. Importantly, isoprene, which dominates the VOC emissions from both canopies, is emitted at five times the rate from the oil palm compared with the rainforest. The rainforest fluxes also include methanol, acetaldehyde, acetone, acetic acid, the sum of MVK and MACR, and hexanal, as shown in figure 6 [11] . The dominant emissions from the rainforest were isoprene, representing 80 per cent of the reactive carbon flux, and monoterpenes, comprising 18 per cent of the total, while the other compounds measured collectively contributed just 2 per cent of the reactive carbon flux. The emissions from the oil palm canopy, with the exception of isoprene, differ qualitatively from those from the forest canopy. Isoprene contributes the dominant flux, with 84 per cent of total reactive VOC emissions, with estragole second in importance with 9 per cent of the total and toluene third with 7 per cent. The remaining VOCs contribute less than 1 per cent of the resolved reactive carbon from the oil palm canopy. The sources of the VOCs also differ between the two canopies; estragole for example is emitted by the flowers of the oil palm canopy and is a compound that is not emitted at all by the rainforest [12].
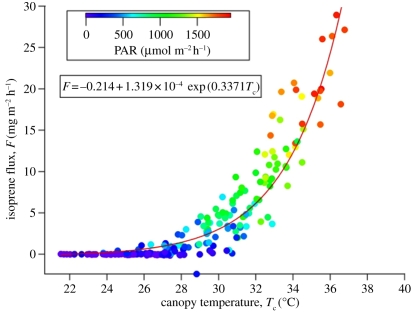
The warmer canopy of oil palm noted in the earlier section of the paper combined with the change in land use and different signature of VOC emissions creates enhanced emissions of some of the VOCs that show a pronounced temperature dependence in their VOC emission. The temperature dependence of isoprene emission from the oil palm canopy is illustrated in figure 8, derived from the flux measurements over the oil palm canopy at different temperatures and different levels of photosynthetically active radiation. The exponential relationship between the isoprene flux and canopy temperature shows the sensitivity of the emissions to changes in climate. Thus, the change in land use from rainforest to oil palm results in a positive feedback in VOC emissions in combining a greater specific emission of VOC per unit land area with a higher daytime temperature. The overall response to the change in land use amounts to almost an order of magnitude increase in VOC emissions, expressed per unit land area, for the oil palm plantation.
Figure 8.
The temperature dependence of isoprene emissions from the oil palm canopy derived from measurements during the OP3 campaign. The colour-coded values show data taken at different levels of photosynthetically active radiation (PAR) [24].
(c). Emissions of methane and N2O from the oil palm and rainforest soils
Measurements of emissions of the greenhouse gases CH4 and N2O were made at both the rainforest and oil palm sites using surface chamber methods below the plant canopies [25].
Measured N2O emissions from the unfertilized areas of the oil palm plantation were less than 100 µg N2O m−2 h−1, averaging 33.7 µg N2O-N m−2 h−1, while the values from the fertilized areas close to individual palm trees averaged 5850 µg N2O-N m−2 h−1, as illustrated in figure 9.
Figure 9.
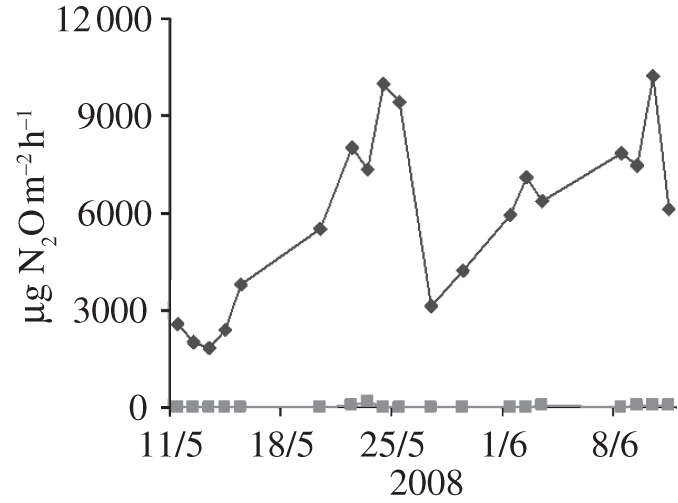
Measured emissions of N2O-N from soils in the oil palm canopy in the fertilized areas (diamonds) close to the trees and in areas without fertilizer application (squares) [25].
The measurements of N2O and CH4 emissions from the oil palm soils up-scaled to provide net emissions from the plantation per unit area are summarized in table 3, based on the planting density of 150 palm trees per hectare, a rate of nitrogen fertilizer application of 81 kg N per hectare applied around each tree, and also assuming the fertilizer influences an area of 2 m2 surrounding each tree and is present in the soil for 65 days following application. We recognize the substantial uncertainty in this simplistic up-scaling, which has been presented to show the likely magnitude of annual fluxes from the two land uses in this region.
Table 3.
A summary of measurements of N2O and CH4 emissions from the forest and oil palm plantation soils during the OP3 campaign [25].
| oil palm soils | ||
| N2O | µg N2O m−2 h−1 | kg N2O-N ha−1 yr−1 |
| average of median fluxes | ||
| fertilized area | 5850 (s.d. 2710) | 513 |
| unfertilized area | 33.7 (s.d. 36) | 3.0 |
| up-scaled to provide annual emissions | 4.4 | |
| CH4 | µg CH4 m−2 h−1 | kg CH4 ha−1 yr−1 |
| average of median fluxes | 4.8 (s.d. 13.8) | 0.4 |
| rainforest soils | ||
| N2O | µg N2O m−2 h−1 | kg N2O-N ha−1 yr−1 |
| average of median fluxes | ||
| primary forest | 21.9 (s.d. 14.9) | 3.1 |
| secondary forest | 31.8 (s.d. 39) | |
| disturbed forest | 52.9 (s.d. 54.3) | |
| CH4 | µg CH4 m−2 h−1 | |
| average of median fluxes | ||
| primary forest | 2.79 (s.d. 18.1) | −0.17 |
| secondary forest | −6.0 (s.d. 39.8) | |
| disturbed forest | −2.2 (s.d. 16.9) | |
The measured fluxes of N2O are substantially larger from the fertilized oil palm soils than those from the rainforest soils and represent 5.5 per cent of the applied nitrogen fertilizer. However, emissions from the rainforest soils are large relative to atmospheric inputs, and the overall availability of nitrogen in the rainforest seems likely to be strongly influenced by biological fixation [20]. As the quantity of nitrogen fixed annually is highly uncertain, it is not possible to estimate the fraction of the annual input to the rainforest soils that is emitted as N2O.
The rainforest and oil palm plantations have freely drained soils, with limited organic matter in a shallow layer, and in the absence of substantially waterlogged soils, fluxes of methane are small and show both emission and deposition (net oxidation of atmospheric methane) as widely observed in well-aerated soils [8]. The fluxes of methane are shown in table 3, with emissions of methane from the primary rainforest and the oil palm plantations, but with very small net fluxes and high variability in time and space. The secondary rainforest and disturbed forest soils showed small net methane uptake. Average fluxes from the data for all of the rainforest measurements showed a small net uptake at −0.5 ng CH4 m−2 s−1, while for the oil palm plantation soils, the average net flux of emission was at 1.3 ng CH4 m−2 s−1. Overall, the methane exchange is of interest in revealing the soil processes, but the very small size of the fluxes makes this exchange unimportant in the net greenhouse gas budget of the two land uses. Potential CH4 emissions from the plants were not quantified during the OP3 study.
(d). Ozone fluxes to the two canopies
Measurements of the ozone (O3) flux were made at the rainforest site by eddy covariance at two heights on the 100 m Bukit Atur tower, and also by gradient methods, during the OP3 campaign between 7 April and 24 July 2008 [26]. Over the oil palm canopy, measurements of the ozone flux were made by eddy covariance between 4 and 11 June 2008. Ambient concentrations of O3 at both sites were small relative to those commonly observed at mid-northern latitudes, and were in the range 4–20 ppbv. At the oil palm site, the very calm nights, coupled with the low measurement height, led to prolonged periods with no ozone at all. Ozone in the surface layer was removed by titration with soil NO emissions and dry deposition to foliage, and as the surface air is decoupled from the bulk of the atmosphere the resupply from above was prevented.
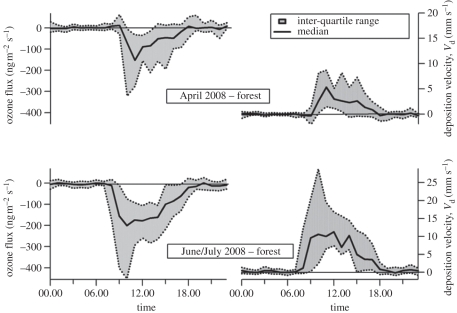
The data for the rainforest (figure 10) show negligible fluxes at night, mainly owing to the physical isolation of the forest canopy from the bulk of the boundary layer owing to thermal stratification of the air and lack of wind. The peak deposition values correspond to the period of maximum assimilation rates (figure 3), although the decline in deposition rates during the afternoon is more pronounced than the decline in CO2 flux. The O3 flux shows a pronounced deposition period following the breakdown of the nocturnal inversion as the O3 recharges the canopy air space that has been depleted overnight by NO titration and surface uptake, an inverse of the flux profile seen for CO2. There is some evidence that the non-stomatal sink provided by leaf surfaces decreases throughout the day as the surfaces become progressively wetter during the afternoon. The daytime deposition velocities, in the range 8–12 mm s−1, are consistent with values for other forest canopies [22,27,28].
Figure 10.
Averaged diurnal fluxes and deposition velocities of ozone over the Danum Valley rainforest during the 2008 OP3 experiment [26].
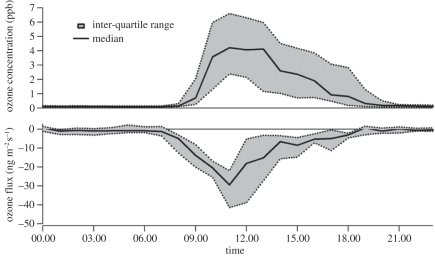
Fluxes of O3 over the oil palm canopy are generally smaller than over the rainforest, mainly as a consequence of the smaller ambient O3 concentrations close to the canopy, which were zero at night and in the range 2–8 ppbv during the day. The magnitude of the fluxes ranged from −10 to −40 ng m−2 s−1. The maximum value corresponded to the maximum CO2 assimilation shortly before midday, declining steadily through the afternoon period as shown in figure 11.
Figure 11.
Averaged diurnal fluxes and ambient concentrations of ozone over the oil palm plantation during the 2008 OP3 experiment [26].
The deposition velocities over oil palm were smaller than over the rainforest, by approximately a factor of 2. The difference is surprising, as in the CO2 and VOC fluxes the oil palm shows much larger fluxes, and overall exchange rates and atmospheric connectivity during daytime conditions are similar for the two surfaces. The dataset is quite short and a longer period of measurements would have helped to examine underlying processes, but the most likely cause of the difference is that the non-stomatal exchange of O3 for the oil palm canopy is substantially smaller than for the rainforest. The much reduced O3 concentration at the canopy top of the oil palm but also the forest (not shown) as compared with the GAW tower suggests that significant chemical sinks exist between the tower height and the canopy, which would have contributed more to the measurements at the higher height. By contrast, no significant flux divergence could be detected between the two eddy-flux measurement heights on the GAW tower (45 and 75 m) [26].
(e). The exchange of NO and NO2
Measurements of NO and NO2 exchange were made at the rainforest site, but not at the oil palm. The measurements of NO emission from soils below the rainforest [28] show substantial emissions (0.13 mg N m−2 h−1) of a similar magnitude to emissions from fertilized arable fields in Europe (e.g. [29]) and substantially larger than NO emissions measured over Amazonian rainforest soils [30]. The large NO emissions are however consistent with the large N2O emissions measured at the same location (table 3). The soil emissions of NO are subject to transformation to NO2 within the canopy space, a fraction of which undergoes stomatal uptake by the foliage [31]. Thus, the net emission from the canopy is generally much smaller than measured values at the soil–air interface. The emissions of NO from the rainforest canopy implied by the measured OH, NO, NO2, O3, VOCs and HO2 + RO2 by Pugh et al. [32] are smaller than those measured at the soil level by a factor of 26, a value that is substantially larger than the ‘canopy reduction factor’ of 50 per cent suggested by Yienger & Levy [33]. Additional measurements of the NO2 flux from the rainforest were made using eddy covariance methods by Dari-Salisburgo et al. [34], using a laser-induced fluorescence technique. The measurements show small and very variable net NO2 fluxes. The net daytime NO2 flux averaged over the entire measurement period was 0.95 ng N m−2 s−1, close to the value implied by the air chemistry [32] and a factor of 40 smaller than the measured soil surface flux. It is unclear whether the canopy capture factor of this site is particularly large (e.g. owing to the lower turbulence compared with the Amazonian forest [35]), or whether the soil chamber NO flux measurements were made at a site that is unrepresentative of the average forest emission.
4. Conclusions
The two canopies differ greatly in their species composition, height, ground cover and morphology. For this comparison we have assumed that prior to the change in land use rainforest present at the oil palm site prior to the change in land use was similar to the rainforest over which the measurements presented here have been made. No records of the species composition of the forest on this site prior to oil palm planting have been found. The contrast in canopy structure may be expected to generate different rates of exchange of energy and trace gases with the atmosphere. A summary of the main differences in measured rates of exchange over the two contrasting land uses is presented in table 4. The tropical climate of Sabah provides an environment in which surface–atmosphere exchange processes are dominated by sensible and latent heat exchange at the surface and the deep convection, showers and turbulence with which the surface energy exchanges are associated. This leads to calm conditions at night and a surface that is largely decoupled from the bulk of the troposphere. In these conditions, concentrations of reactive gases such as O3 are depleted within the canopy space and separated from the reservoir of O3 in the free troposphere. Other less reactive gases such as CO2, with sources in the soil and the canopy of vegetation, accumulate during the night, and concentrations may exceed 500 ppmv in these conditions. During the day, the exchange processes increase through the morning as the sensible and latent heat fluxes increase, with latent heat fluxes conveying more than 80 per cent of the turbulent exchange of heat from the surface into the atmosphere for both the rainforest and the oil palm plantation. The overall rates of exchange of momentum for the two surfaces are broadly similar despite the large difference in morphology and height.
Table 4.
A comparison of energy and trace gas fluxes over the rainforest and an oil palm plantation in Sabah, Borneo, from the OP3 experiment in 2008.
| rainforest | oil palm | |
|---|---|---|
| height (m) | 35 | 12 |
| leaf area index | 6 | 6 |
| mean daily rainfall (mm) | 13 | 2 |
| momentum flux (N m−2) (13.00 mean) | 0.15 | 0.15 |
| sensible heat flux (W m−2) (mean of daily maximum hourly flux) | 100 | 100 |
| latent heat flux (W m−2) (mean of daily maximum hourly flux) | 300 | 400 |
| Bowen ratio (09.00–11.00 mean) | 0.47 | 0.29 |
| CO2 net basal PP (mg C m−2 h−1) (mean of daily maximum hourly flux) | 700 | 1200 |
| assimilation rate, Amax (µmol m−2 s−1) | −48 | −70 |
| quantum efficiency, α | 0.013 | 0.035 |
| VOCs (mg C m−2 h−1) (mean of daily maximum hourly flux) | ||
| isoprene | 2.2 | 11 |
| monoterpenes | 0.2 | 0.1 |
| estragole | 0 | 1 |
| toluene | <0.1 | 0.6 |
| total | 2 | 7 |
| N2O (kg N ha−1 yr−1) | 3.1 | 4.4 |
| CH4 (kg C ha−1 yr−1) | −0.17 | 0.4 |
| O3 (ng m−2 s−1) | 200 | 30 |
| O3 deposition velocity (mm s−1) | 10 | 5 |
The oil palm plantation shows substantially greater net primary productivity than the rainforest, by about a factor of 2, and much larger emissions of VOCs. The measurements are over a relatively small fraction of the year, but given the lack of seasonality in the regional meteorology, the values may be representative of the annual net exchange for the two surfaces in this region.
In the case of isoprene, emissions from oil palm are larger than from the rainforest by a factor of 5, and there are emissions of oil palm-specific VOCs, including estragole, from the oil palm flowers. The emissions of VOCs from the oil palm canopy are of minor importance in the carbon budget of the canopy, representing less than 1 per cent of total carbon fluxes. The importance of VOC emissions is through plant defence and other interactions with insects, and on atmospheric composition through the role of VOCs in ozone and organic aerosol production. Thus, large-scale conversion of rainforest to oil palm has the potential to substantially increase ground-level ozone and particulate matter, with the potential for effects on human health, climate and ecosystems as discussed in the companion papers by Pyle et al. [3] and MacKenzie et al. [2].
Acknowledgements
This work was supported by NERC, through the OP3 consortium and by NCAS. We also acknowledge funding from the APPRAISE/ACES project. The authors thank Glen Reynolds and the Royal Society for the excellent support prior to and during the campaign and the Malaysian Meteorological Service for their support at the Bukit Atur rainforest site. The support from Wilmar International for research at the Sabahmas oil palm plantation is gratefully acknowledged. This paper constitutes Publication Number A/573 of the Royal Society South East Asia Rainforest Research Programme.
References
- 1.Hewitt C. N., et al. 2010. Overview: oxidant and particle photochemical processes above a South-East Asian tropical rainforest (the OP3 project): introduction, rationale, location characteristics and tools. Atmos. Chem. Phys. 10 169–199 10.5194/acp-10-169-2010 (doi:10.5194/acp-10-169-2010) [DOI] [Google Scholar]
- 2.MacKenzie A., et al. 2011. The atmospheric chemistry of trace gases and particulate matter emitted by different land uses in Borneo. Phil. Trans. R. Soc. B 366, 3177–3195 10.1098/rstb.2011.0053 (doi:10.1098/rstb.2011.0053) [DOI] [PMC free article] [PubMed] [Google Scholar]
- 3.Pyle J. A., et al. 2011. The impact of local surface changes in Borneo on atmospheric composition at wider spatial scales: coastal processes, land-use change and air quality. Phil. Trans. R. Soc. B 366, 3210–3224 10.1098/rstb.2011.0060 (doi:10.1098/rstb.2011.0060) [DOI] [PMC free article] [PubMed] [Google Scholar]
- 4.Monteith J. L., Szeicz G., Yabuki K. 1964. Crop photosynthesis and the flux of carbon dioxide below the canopy. J. Appl. Ecol. 1, 321–337 10.2307/2401316 (doi:10.2307/2401316) [DOI] [Google Scholar]
- 5.Baldocchi D., et al. 2001. Fluxnet: a new tool to study the temporal and spatial variability of ecosystem-scale carbon dioxide. Bull. Am. Meteorol. Soc. 82, 2415–2434 10.1175/1520-0477(2001) (doi:10.1175/1520-0477(2001)) [DOI] [Google Scholar]
- 6.Kruijt B., et al. 2004. The robustness of eddy correlation CO2 fluxes for Amazon rainforest conditions. Ecol. Appl. 14, 101–113 10.1890/02-6004 (doi:10.1890/02-6004) [DOI] [Google Scholar]
- 7.Fowler D., et al. 2009. Atmospheric composition change: ecosystems–atmosphere interactions. Atmos. Environ. 43, 5193–5267 10.1016/j.atmosenv.2009.07.068 (doi:10.1016/j.atmosenv.2009.07.068) [DOI] [Google Scholar]
- 8.Smith K. A., et al. 2000. Oxidation of atmospheric methane in northern European soil, comparison with other ecosystems, and uncertainties in the global terrestrial sink. Global Change Biol. 6, 791–803 10.1046/j.1365-2486.2000.00356.x (doi:10.1046/j.1365-2486.2000.00356.x) [DOI] [Google Scholar]
- 9.Keller M., Varner R., Dias J. D., Silva H., Crill P., de Oliveira R. C. 2005. Soil–atmosphere exchange of nitrous oxide, nitric oxide, methane, and carbon dioxide in logged and undisturbed forest in the Tapajos National Forest, Brazil. Earth Interact. 9, 1–28 10.1175/EI125.1 (doi:10.1175/EI125.1) [DOI] [Google Scholar]
- 10.Shuttleworth W. J. 1989. Micrometeorology of temperate and tropical forest. Phil. Trans. R. Soc. Lond. B 324, 299–334 10.1098/rstb.1989.0050 (doi:10.1098/rstb.1989.0050) [DOI] [Google Scholar]
- 11.Langford B., Misztal P. K., Nemitz E., Davison B., Helfter C., Pugh T. A. M., MacKenzie A. R., Lim S. F., Hewitt C. N. 2010. Fluxes and concentrations of volatile organic compounds from a South-East Asian tropical rainforest. Atmos. Chem. Phys. 10, 8391–8412 10.5194/acp-10-8391-2010 (doi:10.5194/acp-10-8391-2010) [DOI] [Google Scholar]
- 12.Misztal P. K., et al. 2010. Large estragole fluxes from oil palms in Borneo. Atmos. Chem. Phys. 10, 4343–4358 10.5194/acp-10-4343-2010 (doi:10.5194/acp-10-4343-2010) [DOI] [Google Scholar]
- 13.Whitehead J. D., et al. 2010. Aerosol fluxes and dynamics within and above a tropical rainforest in South-East Asia. Atmos. Chem. Phys. 10, 9369–9382 10.5194/acp-10-9369-2010 (doi:10.5194/acp-10-9369-2010) [DOI] [Google Scholar]
- 14.Hewitt C. N., et al. 2009. Nitrogen management is essential to prevent tropical oil palm plantations from causing ground-level ozone pollution. Proc. Natl Acad. Sci. USA 106, 18 447–18 451 10.1073/pnas.0907541106 (doi:10.1073/pnas.0907541106) [DOI] [PMC free article] [PubMed] [Google Scholar]
- 15.Tangki H., Chappell N. A. 2008. Biomass variation across selectively logged forest within a 225 km2 region of Borneo and its prediction by Landsat TM. Forest Ecol. Manage. 256, 1960–1970 10.1016/j.foreco.2008.07.018 (doi:10.1016/j.foreco.2008.07.018) [DOI] [Google Scholar]
- 16.Newbery D. M., Campbell E. J. F., Lee Y. F., Ridsdale C. E., Still M. J. 1992. Primary lowland dipterocarp forest at Danum valley, Sabah, Malaysia: structure, relative abundance and family composition. Phil. Trans. R. Soc. Lond. B 335, 341–356 10.1098/rstb.1992.0026 (doi:10.1098/rstb.1992.0026) [DOI] [Google Scholar]
- 17.Muller J. B. A., Percival C. J., Gallagher M. W., Fowler D., Coyle M., Nemitz E. 2010. Sources of uncertainty in eddy covariance ozone flux measurements made by dry chemiluminescence fast response analysers. Atmos. Meas. Tech. 3, 163–176 10.5194/amt-3-163-2010 (doi:10.5194/amt-3-163-2010) [DOI] [Google Scholar]
- 18.Helfter C., et al. In preparation Momentum and heat exchange above a South East Asian rainforest in complex terrain. [Google Scholar]
- 19.Aragao L., et al. 2009. Above- and below-ground net primary productivity across ten Amazonian forests on contrasting soils. Biogeosciences 6, 2759–2778 10.5194/bg-6-2759-2009 (doi:10.5194/bg-6-2759-2009) [DOI] [Google Scholar]
- 20.Vitousek P. M., et al. 2002. Towards an ecological understanding of biological nitrogen fixation. Biogeochemistry 57, 1–45 10.1023/A:1015798428743 (doi:10.1023/A:1015798428743) [DOI] [Google Scholar]
- 21.Matson P., McDowell W. H., Townsend A. R., Vitousek P. 1999. The globalization of N deposition: ecosystem consequences in tropical environments. Biogeochemistry, 46, 67–83 10.1023/A:1006152112852 (doi:10.1023/A:1006152112852) [DOI] [Google Scholar]
- 22.Tuovinen J.-P., et al. 2001. Comparisons of measured and modelled ozone deposition to forests in northern Europe. Water Air Soil Pollut. Focus 1, 263–274 10.1023/A:1013131927678 (doi:10.1023/A:1013131927678) [DOI] [Google Scholar]
- 23.Derwent R. G., Davies T. J. 1994. Modeling the impact of NOX or hydrocarbon control on photochemical ozone in Europe. Atmos. Environ. 28, 2039–2052 10.1016/1352-2310(94)90472-3 (doi:10.1016/1352-2310(94)90472-3) [DOI] [Google Scholar]
- 24.Misztal P. K., et al. 2011. Direct ecosystem fluxes of volatile organic compounds from oil palms in South-East Asia. Atmos. Chem. Phys. Discuss. 11, 12 671–12 724 [Google Scholar]
- 25.Skiba U., et al. In preparation Greenhouse gas (N2O, CH4 and CO2) exchange with contrasting land uses in SE Asia. Atmos. Chem. Phys. Discuss. [Google Scholar]
- 26.Muller J., et al. In preparation Ozone exchange with South East Asian rain forest. Atmos. Chem. Phys Discuss. [Google Scholar]
- 27.Altimir N., Kolari P., Tuovinen J. P., Vesala T., Back J., Suni T., Kulmala M., Hari P. 2006. Foliage surface ozone deposition: a role for surface moisture? Biogeosciences 3, 209–228 10.5194/bg-3-209-2006 (doi:10.5194/bg-3-209-2006) [DOI] [Google Scholar]
- 28.Dorsey J. R., Duyzer J. H., Gallagher M. W., Coe H., Pilegaard K., Weststrate J. H., Jensen N. O., Walton S. 2004. Oxidized nitrogen and ozone interaction with forest. I: Experimental observations and analysis of exchange with Douglas fir. Q. J. R. Meteorol. Soc. 130, 1941–1955 10.1256/qj.03.124 (doi:10.1256/qj.03.124) [DOI] [Google Scholar]
- 29.Skiba U., Fowler D., Smith K. A. 1997. Nitric oxide emissions from agricultural soils in temperate and tropical climates: sources, controls and mitigation options. Nutr. Cycl. Agroecosyst. 48, 139–153 10.1023/A:1009734514983 (doi:10.1023/A:1009734514983) [DOI] [Google Scholar]
- 30.Davidson E. A., Bustamante M. M., de Siqueira Pinto A. 2001. Emissions of nitrous oxide and nitric oxide from soils of native and exotic ecosystems of the Amazon and Cerrado regions of Brazil. Sci. World J. 1(Suppl. 2), 312–319 [DOI] [PMC free article] [PubMed] [Google Scholar]
- 31.Ganzeveld L. N., Lelieveld J., Dentener F. J., Krol M. C., Bouwman A. J., Roelofs J. 2002. Global soil-biogenic NOX emissions and the role of canopy processes. J. Geophys. Res. 107, 4298. 10.1029/2001jd001289 (doi:10.1029/2001jd001289) [DOI] [Google Scholar]
- 32.Pugh T. A. M., et al. 2010. Simulating atmospheric composition over a South-East Asian tropical rainforest: performance of a chemistry box model. Atmos. Chem. Phys. 10, 279–298 10.5194/acp-10-279-2010 (doi:10.5194/acp-10-279-2010) [DOI] [Google Scholar]
- 33.Yienger J., Levy H. 1995. Empirical model of global soil-biogenic NOX emissions. J. Geophys. Res. Atmos. 100, 11 447–11 464 10.1029/95JD00370 (doi:10.1029/95JD00370) [DOI] [Google Scholar]
- 34.Dari-Salisburgo C., Di Carlo P., Aruffo E., Langford B., Dorsey J., Giammaria F. 2010. NO2 flux evaluation using laser induced fluorescence measurements and eddy covariance technique, in the Borneo forest during OP3 campaign. Presented at European Geosciences Union General Assembly 2010, Vienna, 2nd–7th May 2010. Geophys. Res. Abstracts 12, EGU2010–15408. See http://meetingorganizer.copernicus.org/EGU2010/EGU2010-15408.pdf. [Google Scholar]
- 35.Ryder J., et al. In preparation Sources and sinks of biogenic volatile organic compounds inside a South-East Asian rainforest canopy. Atmos. Chem. Phys. Discuss. [Google Scholar]


