Abstract
The regulated catabolism of hyaluronan is critical to the function of many connective tissues. In cartilage hyaluronan catabolism occurs locally by resident chondrocytes. To determine whether the expression of lysosomal hyaluronidases contributes to this regulation, the promoter elements associated with HYAL-2 gene expression were characterized. Human articular chondrocytes were found to express all three lysosomal hyaluronidases, HYAL-1, HYAL-2 and HYAL-3. HYAL-2 was the predominant gene product. Using 5′ RACE analysis, multiple transcription initiation sites were identified including a novel initiation site located within intron 1 of the gene expressed by human articular chondrocytes. The presence of multiple transcriptional initiation sites is a typical feature of TATA-less promoter regions, such as those of HYAL-2. Approximately 4000 bp of 5′ flanking sequence of the HYAL-2 gene was characterized. Transient transfection of C-28/I2 cells with various 5′ deletion constructs indicated that the region between +959 to +1158 (within intron 1) contains the basal promoter for HYAL-2 in chondrocytes. In addition, the region +224 to +958 contained a negative modulator that could control the basal expression level of HYAL-2. Treatment of human articular chondrocytes or C-28/I2 cells with various catabolic cytokines did not alter HYAL-2 mRNA expression, luciferase promoter expression or hyaluronidase enzymatic activity. Thus in chondrocytes, HYAL-2 appears to be constitutively expressed and not inducibly regulated by catabolic agents. As such it appears that the expression of lysosomal hyaluronidase participates little to the overall regulation of hyaluronan catabolism.
Hyaluronan (HA)1 is a high molecular weight nonsulfated glycosaminoglycan composed of repeating disaccharide units of N-acetylglucosamine and glucuronic acid (1). HA is a ubiquitous component of the extracellular matrix and as such, is present in most body fluids and tissues (2). In cartilage HA serves as a tethering scaffold with more than 50 aggrecan proteoglycans and link proteins bound to a single filament of HA (3). Because cartilage is avascular and devoid of a lymphatic system, all HA catabolism occurs locally by the resident chondrocytes. As such cartilage serves as a useful model system to examine the regulation of local HA catabolism. Under steady state conditions, aggrecan and HA are catabolized in a coordinated manner (4,5). However, while aggrecan fragments are detected in the extracellular matrix and media, presumably due to extracellular processing by neutral pH proteinases, HA degradation products typically are not found. Our laboratory has determined that chondrocytes readily internalize HA via a CD44-mediated mechanism, delivering the HA into low pH intracellular organelles (6–9). Given that the lysosomotropic agent chloroquine blocks the degradation of HA into small fragments by chondrocytes (6) this suggests that HA is catabolized intracellularly via the action of lysosomal hyaluronidases.
The hyaluronidases are represented by a family of β-endoglucosidases that degrade HA by cleaving internal β-1, 4 linkages. In human, six hyaluronidase genes have been identified (10,11). These genes occur in clusters of three at two chromosomal locations. HYAL-1, HYAL-2 and HYAL-3 are located on chromosome 3p21.3 and SPAM-1, HYAL-4 and HYALP1 are located on chromosome 7q31.3. HYAL-1 is expressed in most tissues but is predominantly found in the plasma and urine (11). Similarly, HYAL-2 is found in most tissues, however, it is notably absent in the adult brain. Both HYAL-1 and HYAL-2 are believed to act in concert to degrade HA (11). Cartilage has been shown to express mRNA encoding HYAL-1, HYAL-2 and HYAL-3 (12). In this study we have confirmed these results and demonstrated that HYAL-2 is the predominant mRNA. The cDNA sequences for HYAL-2 have been reported for human (13), mouse (13) and Xenopus laevis (14). Both the human and mouse HYAL-2 amino acid sequences are highly conserved with an identity of 82% and no insertions or deletions (13). There are two isoforms of human HYAL-2 that share the same coding exons, namely exons 2, 3 and 4. They differ only in the 5′ untranslated region of the mRNA whereby one isoform contains exon 1 (GenBank Accession Number U09577) while the other contains intron 1 (GenBank Accession Number NM033158).
Despite the fact that the gene sequence for human HYAL-2 has been known for some time and that HYAL-2 has been implicated in a number of biological activities such as tumor growth and metastasis (15), embryonic development (16) and inflammation (17), little is known about its regulation. Cytokines such as IL-1 and TNF are potent stimulators of chondrocyte mediated cartilage degradation (7,12). However, studies on cytokines effects on the modulation of HYAL-2 expression are contradictory. When treated with cytokines such as IL-1 (α/β), TNF-α or IFN-γ, there was no change in the expression level of HYAL-2 message as observed in human periodontal ligament fibroblasts (18), human proximal tubular epithelial cells (19), human kidney and renal cells (20) and murine lung endothelial cells (21). On the other hand, an increased in HYAL-2 mRNA level was observed in human chondrocytes after IL-1β and TNF-α treatment (12) and in rat lung tissue by TGF-β(17). Further Nicoll et al (22) have shown that human dermal fibroblast treated with lactate and/or staurosporine expressed elevated HYAL-2 message level.
In this study, we have generated a number of 5’ and 3’ deletion constructs to delineate the promoter region and also to identify positive and negative cis-elements critical to the regulation of the hyaluronidase gene expression in human chondrocytes. In addition, we have determined that the expression of HYAL-2 in human chondrocytes or HYAL-2 promoter constructs is not altered by pre-treatment of cells with a variety of cytokines, growth factors or cellular mediators.
EXPERIMENTAL PROCEDURES
Materials
Dulbecco’s modified Eagle’s medium (DMEM) and Ham’s F-12 were from Cellgro (Herndon, VA). Fetal bovine serum (FBS) was from HyClone (South Logan, UT). FuGene 6 and Collegenase P were obtained from Roche (Indianapolis, IN). Pronase was from Calbiochem (San Diego, CA). IL-1α, IL-1β, IFN-γ and TNF-α were from R & D Systems Inc. (Minneapolis, MN). Trizol, TOPO TA Cloning Kit for Sequencing and Platinum Pfx DNA polymerase were purchased from Invitrogen Corporation (Carlsbad, CA). BD SMART RACE cDNA Amplification Kit was from BD Biosciences Clontech (Palo Alto, CA). Specific primers were custom made by Integrated DNA Technologies (Coralville, IA). GeneAmp RNA PCR kit was from Perkin-Elmer (Norwalk, CT). pGL-3 Basic, Renilla luciferase reporter plasmids, Dual Luciferase Reporter Assay System and human genomic DNA were purchased from Promega (Madison, WI). All other chemicals either molecular biology grade or reagent grade materials were purchased from Sigma (St. Louis, MO).
Cell Culture
Immortalized human chondrocytes, C-28/I2 (a gift from Dr. Mary Goldring, Harvard Institutes of Medicine) were grown in a DMEM/Ham’s F-12 (50/50) mix supplemented with 10 % FBS in a humidified 5 % CO2 incubator at 37 °C. Normal human talocrural ankle cartilage (obtained from the Gift of Hope Organ and Tissue Donor Network with consent and IRB Institutional approval) was isolated by sequential digestion of pronase and collegenase (7). The human chondrocytes were cultured in DMEM supplemented with 10 % FBS. To study the effects of cytokines on the mRNA expression level of HYAL-2 and hyaluronidase activity, human chondrocytes or C-28/I2 were treated with 0.5–10 ng/ml of IL-1β, 10 ng/ml IL-1α, 100 ng/ml TNF-α or 10−3 µg/ml IFN-γ for 48 h in either serum-free media or 10 % serum containing media. Total RNA was then isolated using Trizol Reagent following the manufacturer’s instructions. The serum-free media was collected, protease inhibitor cocktail added and the samples stored at −20°C prior to analysis for hyaluronidase.
Reverse Transcription-Polymerase Chain Reaction (RT-PCR)
Total cytoplasmic RNA was extracted from human monolayer cultures with Trizol reagent, purified, and then subjected to RT-PCR analysis as described previously (23). Briefly, 200 ng of total RNA was converted to cDNA using Molony murine leukemia virus reverse transcriptase in the presence of 0.15 µM of a specific HYAL-1, 2, or 3 downstream primers. The resulting cDNA samples were then amplified in the presence of 0.15 µM of a specific HYAL-1, 2, or 3 upstream primer in a PCR mixture consisting of 2 mM magnesium chloride, 200 µM of each deoxyribonucleotide, and 2.5 units of AmpliTaq DNA polymerase. The DNA was denatured by heating at 94°C for 2 min, followed by 30 cycles of 45 sec at 94°C, 45 sec annealing at 60 °C, and extension at 72°C for 45 sec. This reaction was followed by a final elongation step that lasted 5 min at 72°C. The amplified products were analyzed by electrophoresis on 1.5% agarose gels followed by staining with ethidium bromide. The stained products were scanned and quantified using a fluorimaging system (Fluor-S MultiImager, Bio-Rad, Hercules, CA). Two specific primers sets for HYAL-2 were utilized. To monitor all HYAL-2 transcripts; sense primer (5′ GGC ACA ATA TGA GTT TGA GTT CGC 3′) and the antisense primer (5′ TTG AGG TAC TGG CAG GTC TCC G 3′) were used. To determine HYAL-2 transcripts specifically containing exon 1; the sense primer (5′ GGC TCA CCC CAG GTA AGG AGG G 3′) was used in conjunction with the antisense primer (5′ CCA TGC ACA GAC CTT CCG GCA GAA T 3′). These primer sequences were used for HYAL-1: (Sense: 5′CCA GAA TGC CAG CCT GAT TGC C3′, Antisense: 5′GTC ATT TTG GGC ACG GAT GCC3′) and; HYAL-3: (Sense: 5′CAT TTT CTA CAA GAA CCA ACT CGG CC3′, Antisense:5′CCA ATG CAG TTG AGT GTT GCG G3′).
5′Rapid Amplification of cDNA Ends (5′RACE)
Total RNA was isolated from normal human talocrural chondrocytes using Trizol Reagent while human placental total RNA was obtained from BD Biosciences Clontech. An antisense HYAL-2 oligodeoxynucleotide (5′ CCA TGC ACA GAC CTT CCG GCA GAA T 3′) corresponding to position 2493–2517 downstream from exon 1 (11) was synthesized. First-strand cDNA synthesis and subsequent amplification of 5′cDNA ends were carried as detailed in the BD SMART RACE cDNA amplification kit manual. In brief, total RNA was reverse-transcribed using a modified lock-docking oligonucleotide (dT) primer and BD SMART II A oligonucleotide at 42 °C for 1.5 h to obtain the first-strand cDNA. 5′RACE was performed by incubating with an aliquot of first-strand cDNA, the antisense HYAL-2 and universal primer mix using the following PCR conditions. After an initial denaturation of 1 cycle at 94 °C for 2 min, the mixture was amplified at 94 °C, 45 sec; 68 °C, 45 sec and 72 °C, 3 min for 30 cycles. The resulting products were cloned into a sequencing vector, TOPO TA and sequenced (Research Resources Center DNA Sequencing, University of Illinois at Chicago) to determine the transcription start site(s).
Transient Transfection Assay
Transient transfection of C-28/I2 immortalized human chondrocytes with HYAL-2 promoter/firefly luciferase reporter plasmids was performed using FuGENE 6. Cells were seeded at 1.2 × 10⁵ per well in 24-well plates the day before and transfected with 0.2 µg of one promoter construct with 0.6 µl of FuGENE 6 in the presence of serum containing media for 48 h. The cells were then lysed and assayed for promoter activity using Dual-Luciferase Reporter Assay System. The enzymatic activity of luciferase was measured with a luminometer (Sirius, Berthold Detection System, Oak Ridge, TN). To normalize for transfection efficiency, the cells were co-transfected with Renilla luciferase reporter plasmid (2 ng). To study the effects of cytokines on the promoter activity of the various constructs, the cells were transfected for 24 h with the promoter constructs as outlined above. The next day the cells were washed and following overnight serum starvation, treated with various cytokines in serum-free media for another 24 h and then assayed for promoter activity.
Construction of promoter reporter
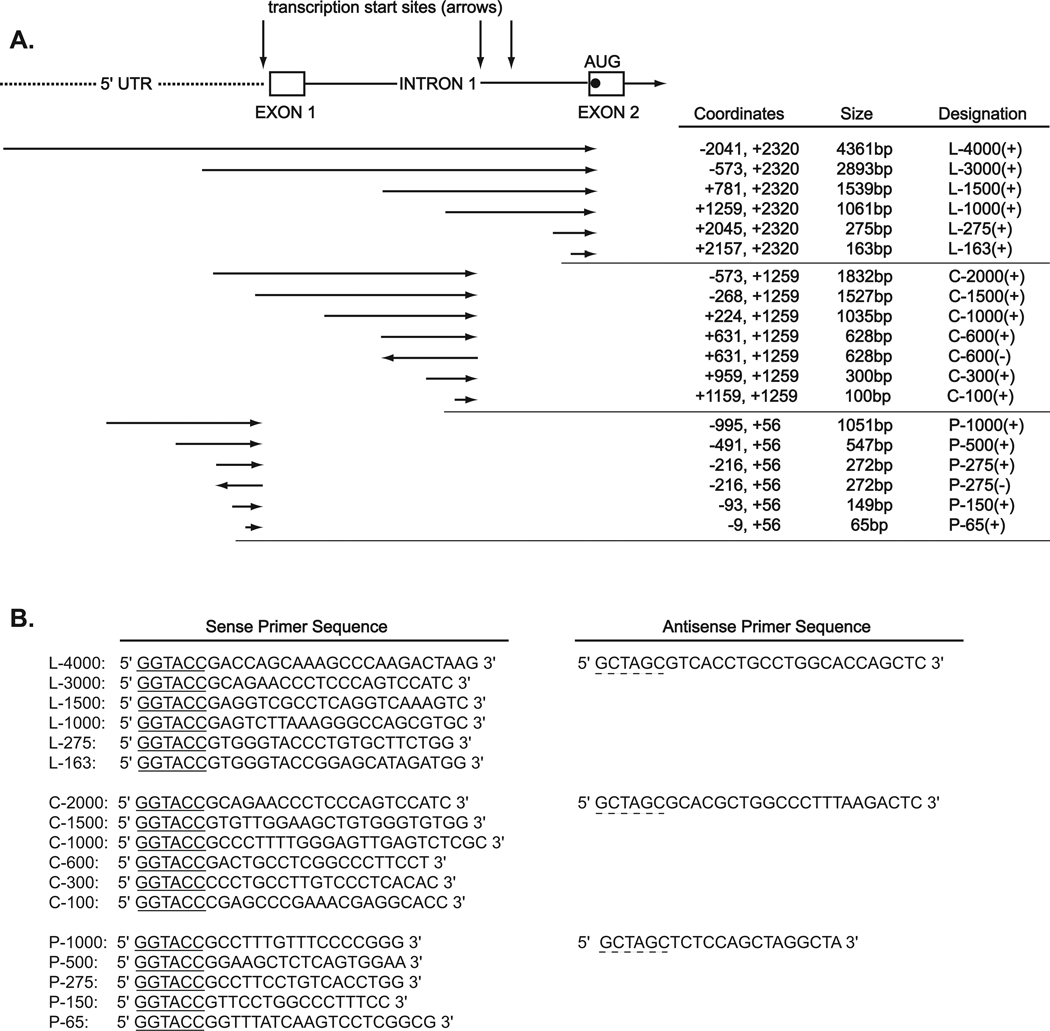
A human genome Blast homology search of the public database (24) was performed using human HYAL-2 cDNA sequence (Genbank Accession Number U09577). Three series of 5′ deletion constructs were generated and arbitrarily designated; L, C and P. High purity human genomic DNA was used as the template to generate the inserts. Inserts were PCR amplified using Platinum Pfx DNA polymerase with the appropriate primer sets shown in Fig 5. The amplified products were then cloned into the KpnI/NheI sites of the pGL3-Basic firefly luciferase reporter plasmid. The KpnI and Nhe I restriction enzymes sites were engineered into the primers and are underlined in the sequences shown in Fig. 5. The positions are numbered from the transcriptional start site (+1) of human placenta HYAL-2 (HP-HYAL-2, Fig. 3).
Fig 5. Diagrammatic representation of HYAL-2 promoter constructs.
Panel A includes a schematic diagram of the 5′ flanking region of the HYAL-2 gene, exon 1, intron 1 and part of exon 2 (contains the translation start site). Arrows show the relative position of transcription start sites for HYAL-2. Also included in panel A are the relative positions, cloning orientations and sizes of the HYAL-2 promoter constructs (drawn as horizontal arrows). The exact coordinates, sizes and designations are shown to the right. Panel B depicts the sense and antisense primer sequences used to generate the promoter constructs with underlined sequence delineating the engineered KpnI and NheI restriction sites.
Fig. 3. Transcription start sites and putative regulatory elements of the 5′ flanking region of the HYAL-2 gene.
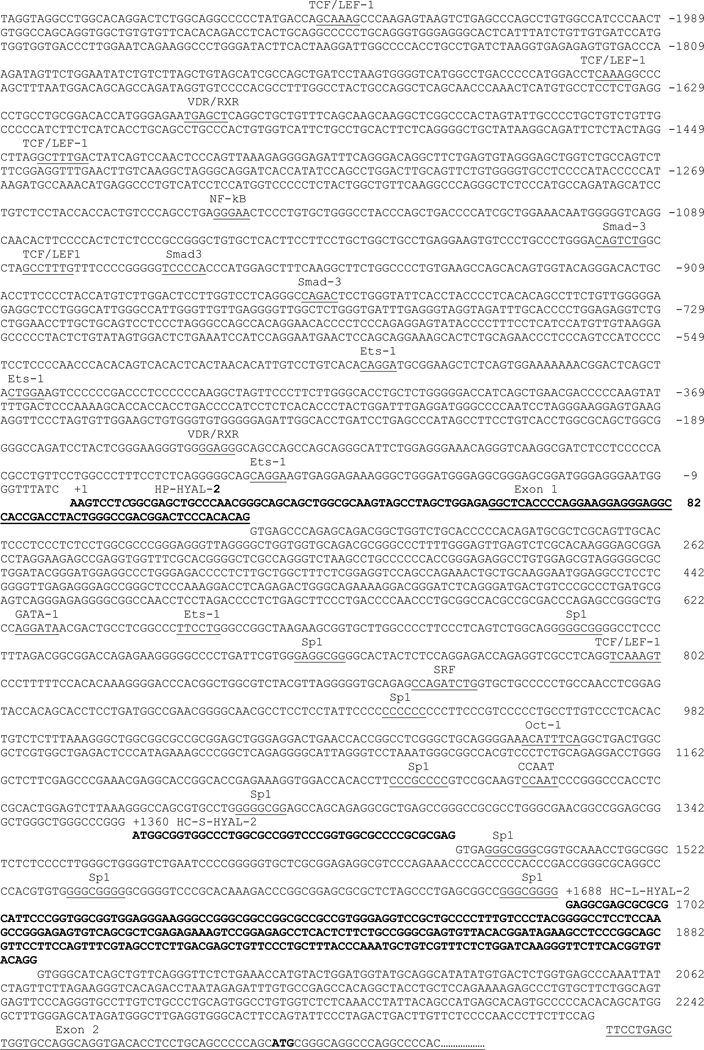
The 5′ RACE HYAL-2 products were cloned, sequenced and compared to the known sequence for the HYAL-2 gene in GenBank (Accession Number AC002455). The sequences identified by 5′ RACE—all originating from a primer anchored in exon 2, are depicted in bold; known exon sequences are underlined. The transcription start site used by human placental cells (HP-HYAL-2) that is 5′ upstream of exon 1, was designated (+1). The transcription start sites used by human chondrocytes were located in the intron 1 and are denoted HC-S-HYAL-S-2 (+1360) and HC-L-HYAL-2 (+1688). The MatInspector program (44) available online by Genomatix (http://www.genomatrix.de/products/productmap.html) was used to identify potential cis regulatory elements in the 5′ flanking sequence of the HYAL-2 gene (core sequence is underlined). All sites shown have greater than 85% consensus.
Assay for hyaluronidase activity
Hyaluronidase activity in the media of human chondrocytes that were treated in the absence or presence of 10 ng/ml of IL-1β for 48 h was assayed by HA-zymography as previously described (25). Briefly, the samples were loaded and run on a 10 % SDS polyacrylamide gel containing a final concentration of 0.17 mg/ml of HA, followed by 1 h incubation in 0.3% Triton X-100 and after then incubated overnight at 37 °C in 0.1 M sodium formate and 0.15 M NaCl, pH 3.7. After the overnight incubation, the gel was treated for 1 h with 1mg/ml pronase in 20 mM Tris HCl, pH 8.0 and stained with 0.5% Alcian Blue in 3 % acetic acid for 30 min. The gel was then destained with 40% ethanol in 3% acetic acid until background was sufficiently reduced to visualize the cleared bands. The signal intensity was scanned and quantified using the fluorimaging system.
Polyclonal rabbit anti-human HYAL-2 antibody
A peptide-specific rabbit anti-human HYAL-2 antibody was prepared (NeoMPS, San Diego, CA). Briefly, a specific, 11 amino acid synthetic peptide, unique to the human HYAL-2 sequence, (G D A G Y T T S T E T) was synthesized. The purified peptide was coupled through the terminal cysteine thiol to Keyhole Limpet Hemocyanin with the heterofunctional cross-linking agent male-imidobenzoyl-N-hydroxysuccinimide ester. The antigen was suspended in PBS, emulsified by mixing with an equal volume of Complete Freund’s Adjuvant and injected into the subcutaneous dorsal sites of rabbits for primary immunization. Subsequent immunizations were performed using Incomplete Freund’s Adjuvant. The animals were then bled, the serum collected and immunoaffinity purified. The anti-peptide antibody titer was determined by enzyme-linked immunosorbent assay.
Western Blot Analysis
For detection of HYAL-2 protein, conditioned media was removed and concentrated by lyophilization and cell layers extracted with 1 % Trition X-100 in 100 mM Tris, pH 7.4, 0.15 M NaCl for 1 h on ice. The isolates were then separated by 10 % SDS-PAGE and electroblotted onto nitrocellulose membranes. The nitrocellulose membranes were blocked with 5 % nonfat milk in PBS containing 0.05 % Tween 20 for 1 h, followed by incubating with a 1:120 dilution of rabbit anti-human HYAL-2 antisera. The blots were then incubated with Vectastain Elite ABC peroxidase kit reagents (Vector Laboratories, Burlingame, CA) and developed using the enzyme substrate diaminobenzidine tetrahydrochloride. As controls, the blots were probed without addition of primary antibody. The bands were scanned and quantified using the fluorimaging system.
RESULTS
Expression of hyaluronidases in human articular chondrocytes
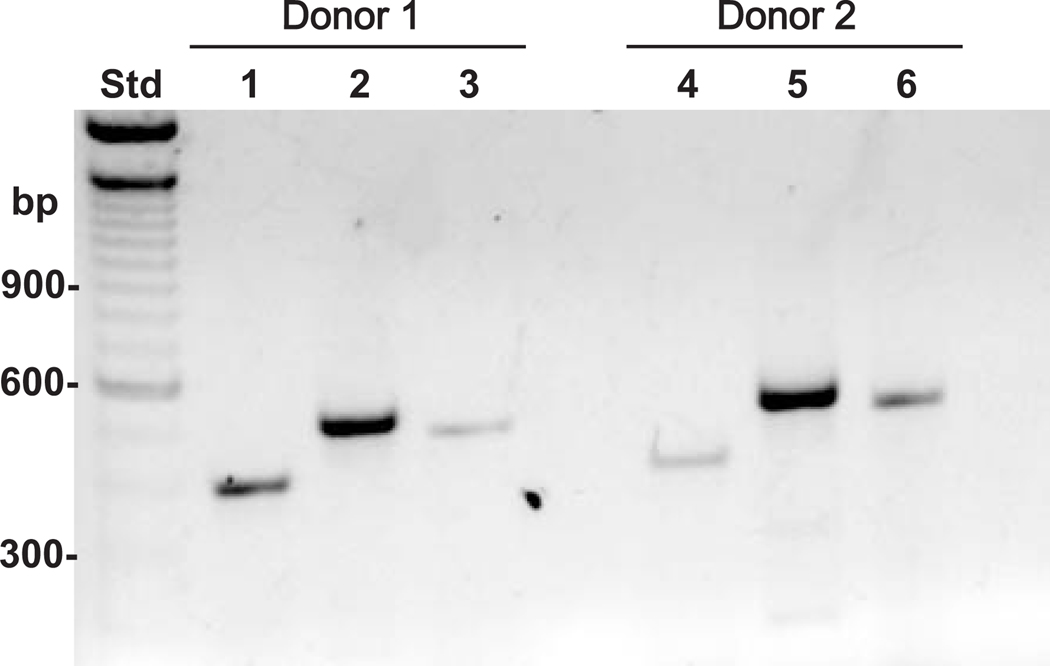
Shown in Fig. 1 is the hyaluronidase mRNA expression pattern of two representative samples of normal human ankle articular chondrocytes. Both of these high density cultures exhibited message for HYAL-1, HYAL-2 and HYAL-3 (Fig. 1, lanes 1–3 and 4–6, respectively) with HYAL-2 being the predominant species. These results confirm the earlier observations made by Flannery et al. (12). Since HYAL-2 was the major hyaluronidase gene product expressed by human chondrocytes, we focused our investigation into the transcriptional regulation of the HYAL-2 gene.
Fig. 1. RT-PCR analysis of hyaluronidase gene expression in human articular chondrocytes.
Total RNA was isolated from two separate high density primary cultures of human articular chondrocytes. Equivalent aliquots of RNA from each donor were analyzed by RT-PCR using specific primer sets for HYAL-1 (lanes 1 and 4), HYAL-2 (lanes 2 and 5) and HYAL-3 (lanes 3 and 6). The expression profile of the three hyaluronidases expressed by donor 1 are shown in lanes 1–3 and for donor 2 in lanes 4–6.
Determination of the transcription start site(s) using 5′ RACE
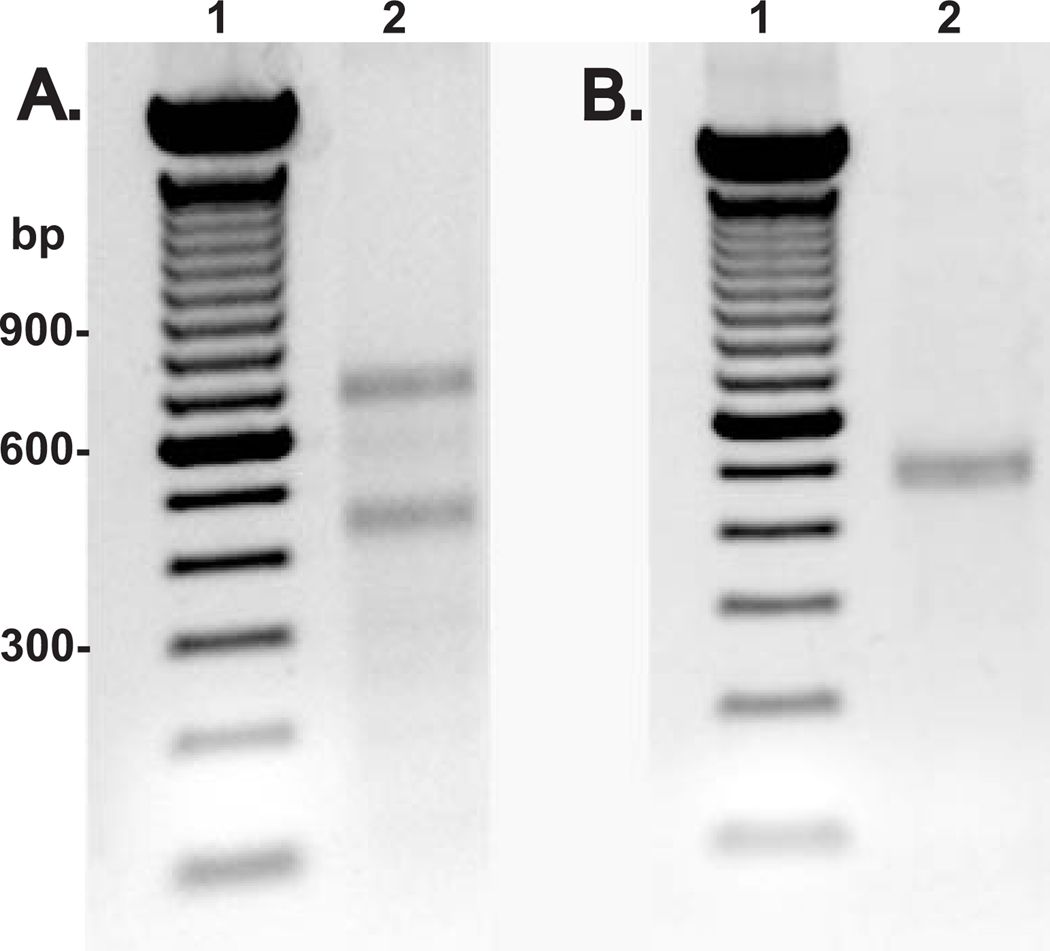
The genomic structure for human HYAL-2 consists of 4 exons separated by 3 introns. The translational start site (AUG) is located within exon 2, which is 2225 bp downstream from exon 1 (11). To identify the transcription initiation site(s) for HYAL-2, 5′ RACE was performed using a HYAL-2 specific primer anchored in exon 2 to amplify total RNA from human articular chondrocytes as well as human placenta. 5′ RACE amplification of human chondrocyte RNA resulted in two bands with estimated sizes of 450 bp and 650 bp of about equal intensity (Fig 2A, lane 2). Cloning and sequencing of these PCR products revealed 2 totally distinct DNA sequences (5′ RACE adapter sequence accounts for 53 bp of the sequence). Both sequences extend exon 2 upstream and have their 5′ start sites located in different regions of intron 1 of the HYAL-2 gene (Fig. 3). The shorter of the two sequences, HC-S-HYAL-2 (+1360, Fig 3), extends 44 base pairs into the distal portion of intron 1. The longer sequence, HC-L-HYAL-2 (+1688, Fig 3), extends 289 base pairs into intron 1. Both of the RNA transcripts are generated by splicing out the intervening intron sequences in accordance to the GT-AG rule. These spliced regions are shown in Fig 3 as the non-bolded sequence between +1360 and the start of exon 2 and, +1688 and exon 2.
Fig. 2. Determination of transcriptional start site(s) for HYAL-2.
Total RNA isolated from high density primary cultures of human articular chondrocytes (panel A) or human placental RNA (panel B) was subjected to 5′ RACE reaction using 5′ universal primer mix and 3′ HYAL-2 specific primers. Following amplification the 5′ RACE products were visualized electrophoresis by 1.5% agarose gels stained with ethidium bromide. Lanes 1 in panels A and B represent a 100 bp DNA ladder; lanes 2, the 5′ RACE HYAL-2 products.
However, in the case of 5′ RACE amplification of human placental RNA, only a single band was observed (Fig. 2B, lane 2). In addition to exon 2, it contains exon 1 and extends continuously into the 5′ untranslated region by 57 bp. We have designated this start site as +1 (HP-HYAL-2). This sequence is 57 base pairs longer than the previously published cDNA HYAL-2 sequence in the GenBank (Accession Number U09577). In this instance, the mature mRNA is synthesized by splicing out the complete intron 1 sequence. The sequences of the splice acceptor and donor sites again comply with the GT-AG rule for splicing.
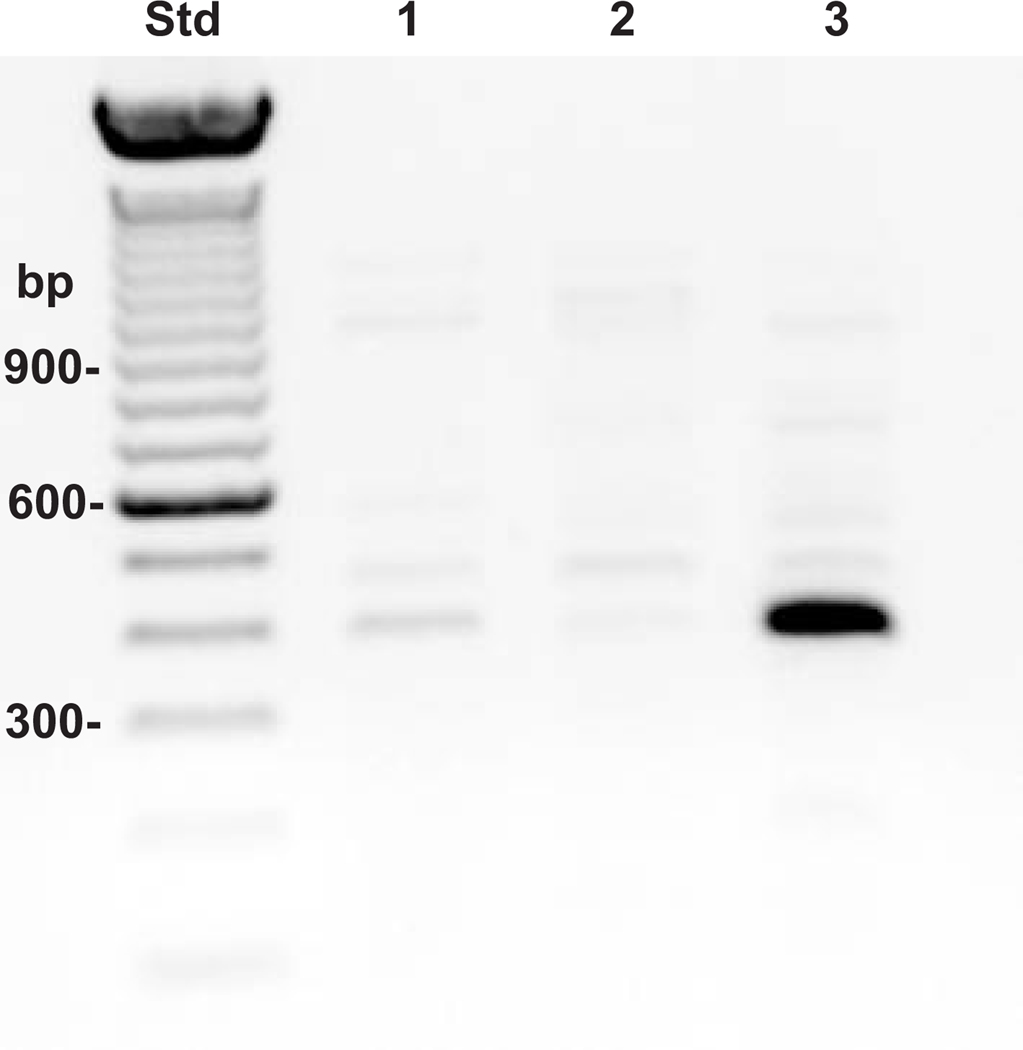
To assess the possibility that human chondrocytes also express an alternate transcript that utilizes exon 1, a sense oligonucleotide primer located within exon 1 was synthesized. As shown in Fig. 4 (lanes 1 and 2), even after 30 PCR cycles, only a very low level of expression was detected (400 bp product) when total RNA isolated from either primary cultures of normal human chondrocytes or C-28/I2 immortalized human chondrocytes was subjected to RT-PCR using exon 1 to exon 2 specific primers. On the other hand, under the same conditions, a strong 400 bp product was obtained with human placental RNA (Fig 4, lane 3).
Fig. 4. Expression of HYAL-2 mRNA transcripts containing exon 1.
Total RNA isolated from primary human articular chondrocytes (lane 1), C-28/I2 immortalized human chondrocytes (lane 2) and human placenta (lane 3) was subjected to RT-PCR using a specific 5′ primers located in exon 1 together with a 3′ primer located in exon 2 of the HYAL-2 mRNA. The products (expected size of 400 bp) were visualized following agarose gel electrophoresis and staining with ethidium bromide. Lane labeled “std” denotes molecular size DNA standards of 100 bp increments.
Promoter activity of human HYAL-2 gene
Based upon our findings regarding the locations of the transcriptional start sites, two series of 5′ human HYAL-2 promoter deletion constructs were generated by cloning amplified regions of the HYAL-2 gene into a pGL3-basic luciferase reporter plasmid (Fig. 5). These constructs were transfected into immortalized human chondrocytes, C-28/I2 and used to determine the sequence elements required for HYAL-2 promoter activity.
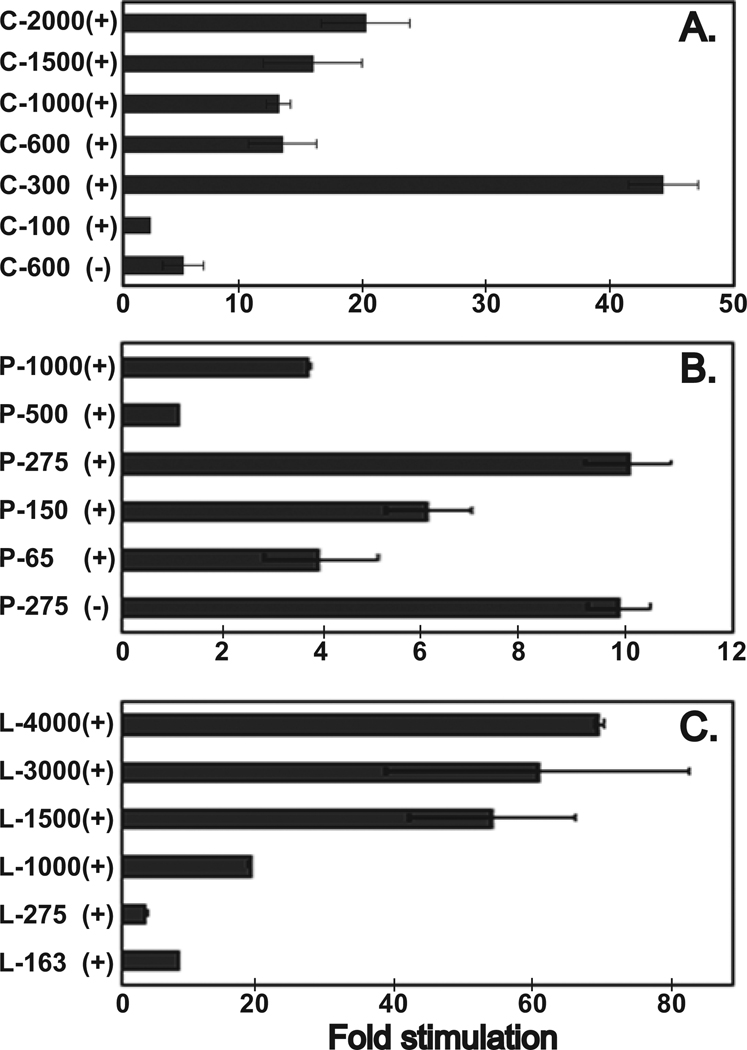
In the C series (Fig. 5), the promoter constructs were generated corresponding to the transcription start sites used by human chondrocytes. As shown in Fig. 6A, all the constructs in the forward orientation except C-100, showed significant promoter activities, >12-fold above the empty pGL3-basic vector alone. The promoter activity for the 5′ deletion constructs C-2000, C-1500, C-1000 and C-600 were relatively constant (15–20-fold). However, deletion of the region between +224 to +958 as found in the C-300 construct resulted in a significant increase in promoter activity (>40-fold) indicating the presence of a potential negative regulatory element in this region of the gene sequence. Deletion of an additional 200 bp from the 5′ end of the C-300 promoter construct (i.e., C-100) resulted in 21-fold reduction in the luciferase activity. Interestingly, as shown in Fig. 3, there is one predicted GATA binding site within this region. It has been shown that GATA protein binding to this site in TATA-less promoters can compete with basal transcription factor binding resulting in transcription inhibition in vitro (26). This suggests that the basal promoter activity is located within C-300 or between +959 to +1158 bp. When C-600 was cloned in the reverse orientation, a sharp decrease in activity from 15- to 5-fold was noted, indicating that this region contain and is essential for promoter activity. Sequence analysis of C-300 region shows it does not contain a TATA box but has a high GC content (65%) and contains potential binding site for transcription factor Sp1 (Fig 3). All these features are common in TATA-less promoters (27–30). Furthermore, the presence of two transcription start sites (see above) spreading over a fairly large region is yet another feature seen with TATA-less promoters (31). A CCAAT box was located 125 bp upstream of start site of HC-S-HYAL-2 (Fig 3) but the region around the transcription initiation site did not conform to the transcriptional Inr (initiator) consensus found in some TATA-less promoter (32).
Fig 6. Promoter activity within the 5′ flanking and intron 1 region of the HYAL-2 gene.
C-28/I2 cells were transfected with 0.2 µg of one of the pGL-3 Basic promoter constructs (shown in Fig. 5) or the empty pGL-3 Basic vector alone. Forty-eight hours post-transfection the cells were lysed and assayed for luciferase activity. The values represent the mean ± S.E. of a representative experiment performed in duplicate and are expressed as fold stimulation with respect to pGL3-Basic. The values were normalized to Renilla luciferase activity that was transfected concurrently (2 ng) in all the assays to correct for transfection efficiency. At least 3 sets of independent experiments were performed for each set of constructs. Panel A includes the C-series; panel B, the P-series and; panel C, the L-series. (+) denotes sequence cloned in the forward orientation, (−) denotes sequences cloned in the reverse orientation.
In the P series, promoter constructs were generated corresponding to the transcriptional start site observed in human placental mRNA. Overall, the observed promoter activities were lower than that seen in C series (Fig. 6B, note the scale on the x-axis). The P-500 construct showed only a 1-fold increase over that of the empty vector. However, deleting the sequence between −491 to −215 (P-275) resulted in a substantial 9-fold increase in luciferase activity indicating the possibility that another negative regulatory element may be present in this segment of the gene. Further 5′ deletion of P-275 resulted in a progressive decrease in promoter activity suggesting that P-275 represented the likely upstream basal promoter region. However, reversing the orientation of P-275 has no effect in inhibiting the promoter activity (Fig. 6B). Again inspection of the sequence showed that there were no TATA or CCAAT boxes in the vicinity. However, this region has a high GC content (65%) and the +1 transcription initiation site sequence (ppA+NGpp; p denotes pyrimidines) conforms to the Inr consensus sequence (ppA+1NT/App) at 6 out of the 7 nucleotides (27). Although nucleotide T/A (+3) is one critical factor in determining the strength of the Inr, in its absence it has been shown that the larger the number of the pyrimidines around the start site can impart low levels of Inr activity as observed with this putative promoter region represented by P-275 (27). In addition, the lower level of promoter activity of the P-series as a whole could be due to the fact the C-28/I2 cells, like primary human chondrocytes, may not utilize this promoter region for synthesis of HYAL-2 transcripts.
In an effort to locate additional positive and negative elements within the HYAL-2 gene, another series of longer 5′ deletion constructs, the L Series, were generated. The longest construct, L-4000 (approximately 4000 bp) spanned a major portion of 5′ untranslated region, all of exon 1, all of intron 1 and a part of exon 2, ending just before the AUG translational start site (Fig. 5). In this series, L-4000, L-3000, L-1500 and L-1000, all showed significant activities over the empty pGL3-Basic vector (Fig. 6C). Luciferase activities ranged from 19-fold for the L-1000 to a 70-fold increase associated with the L-4000. Truncation of the sequence from −2041 to +781 did not affect the promoter activity. However, 5′ truncation of an additional 478 bp, as found in L-1000, resulted in a ~3-fold reduction in promoter activity. This suggests that there is a strong, positive regulator of HYAL-2 expression within the +781 to +1258 region. These data support the high promoter activity observed for the C-300 since the C-300 sequence is contained within the L-1500. The promoter activity of the L-275 and L-163 constructs drops significantly. These sequences are either less functional as promoters or contain suppressor elements. This will be evaluated in future studies by 3′ truncations of P-1000 to P-4000 constructs.
Effects of cytokines on HYAL-2 RNA expression and promoter activity of HYAL-2 promoter constructs
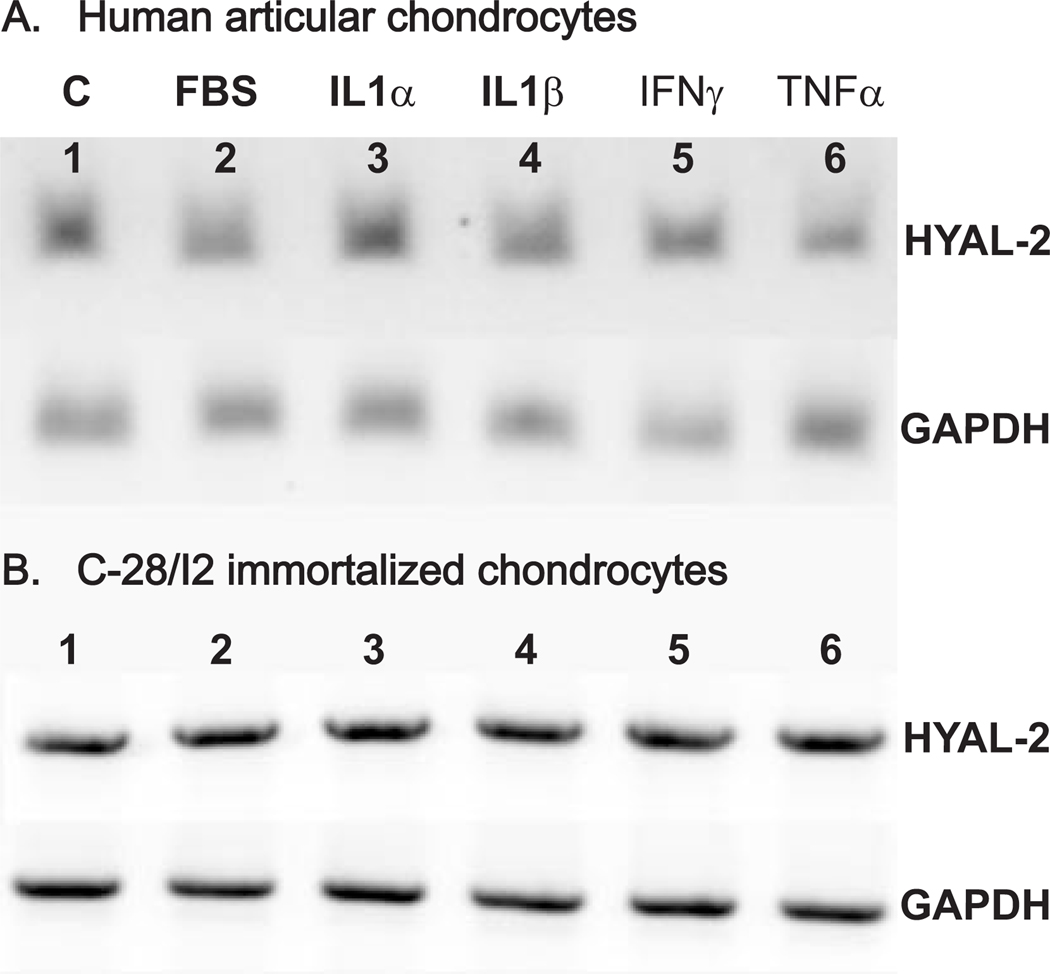
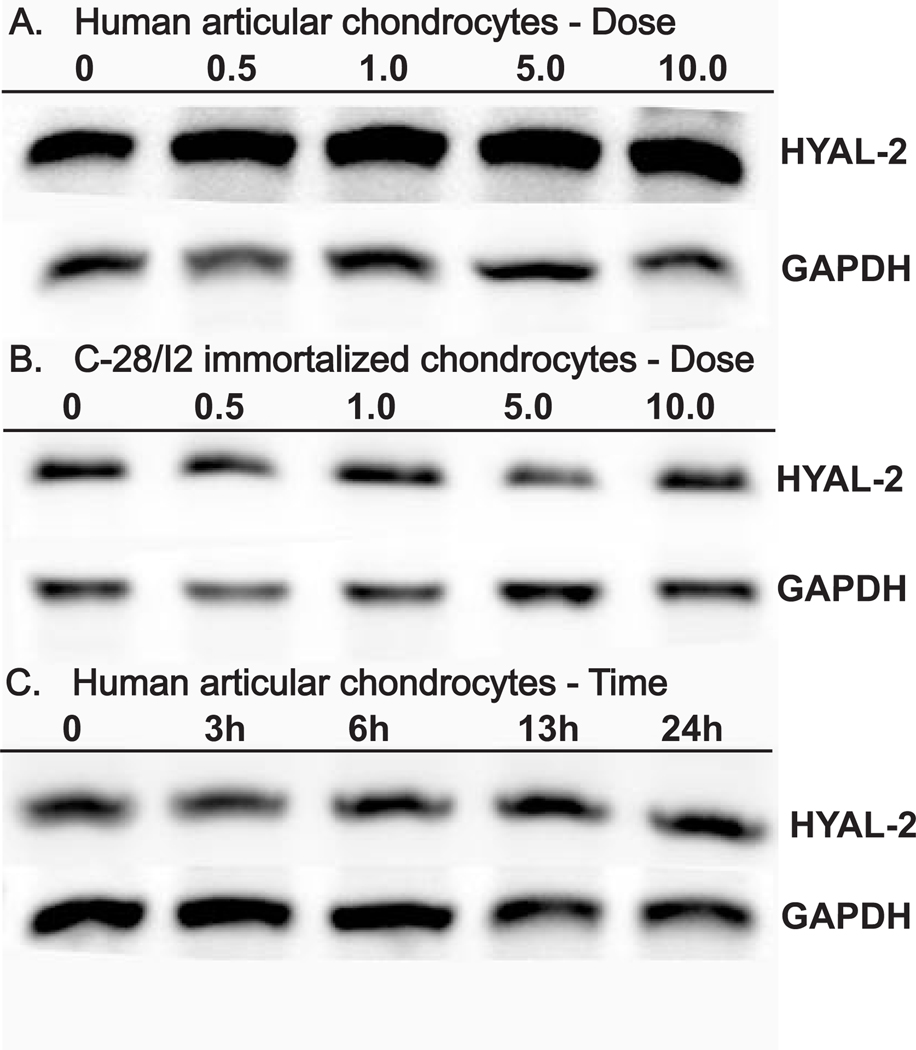
To evaluate the effects of various cellular mediators on HYAL-2 expression, primary human articular chondrocytes as well as C-28/I2 immortalized chondrocytes were treated with IL-1α, IL-1β, TNF-α, IFN-γ or FBS for 48 h following overnight serum starvation. RNA was isolated from these cultures and subjected to semi-quantitative RT-PCR. As shown in Fig. 7, as compared to control, untreated chondrocytes (panels A and B, lane 1) no differences of more than ± 1.5 fold could be detected after treatment with any of these cytokines in either primary or immortalized human chondrocytes. All of the concentrations of cytokines used above were within the dose range typically used for chondrocyte cultures. Nonetheless, to determine whether dose or time of exposure might have an influence on HYAL-2 expression, additional experiments were performed using IL-1β as a representative agent. As shown in Fig. 8, little change in HYAL-2 mRNA expression was observed between 0–10 ng/ml IL-1β in human articular chondrocytes (Fig. 8A) or C-28/I2 chondrocytes (Fig. 8B). HYAL-2 mRNA expression in human articular chondrocytes also exhibited little change following exposure to 10 ng/ml IL-1β for 3, 6, 15 or 24 hours (Fig. 8C). Thus, it is unlikely that the lack of change in HYAL-2 was due to cytokine dose or time-dependent factors. IL-1β also had no effect on the expression of HYAL-2 mRNA when human articular chondrocytes were grown in 3-dimensional alginate bead culture as compared to monolayer culture (data not shown).
Fig 7. Effects of cytokines and serum on HYAL-2 mRNA expression.
Human articular chondrocytes (Panel A) and C-28/I2 immortalized human chondrocytes (Panel B) were pre-incubated overnight in serum-free medium followed by subsequent 48 h treatment in the absence or presence of various cytokines or 10 % FBS. Total RNA was isolated and RT-PCR was performed to assess the level of HYAL-2 mRNA (upper set of bands) and GAPDH mRNA (lower set of bands) expression. The products were visualized following agarose gel electrophoresis and staining with ethidium bromide. Lanes 1: control; lanes 2: 10 % FBS; lanes 3: 10 ng/ml IL-1α; lanes 4: 10 ng/ml IL-1β; lanes 5: 10−3µg/ml IFN-γ and; lanes 6: 100ng/ml TNF-α.
Fig 8. Effects of IL-1β concentration and incubation time on HYAL-2 mRNA expression.
Human articular chondrocytes (Panel A) and C-28/I2 immortalized human chondrocytes (Panel B) were pre-incubated overnight in serum-free medium followed by subsequent 48 h treatment in the absence or presence of 0.5, 1.0, 5.0 or 10.0 ng/ml IL-1β. In the experiments depicted panel C, following an overnight preincubation in serum-free medium, human articular chondrocytes were treated in the absence or presence of 10.0 ng/ml IL-1β for 3, 6, 13 or 24 h. Total RNA was isolated and RT-PCR was performed to assess the level of HYAL-2 mRNA (upper set of bands) and GAPDH mRNA (lower set of bands) expression. The products were visualized following agarose gel electrophoresis and staining with ethidium bromide.
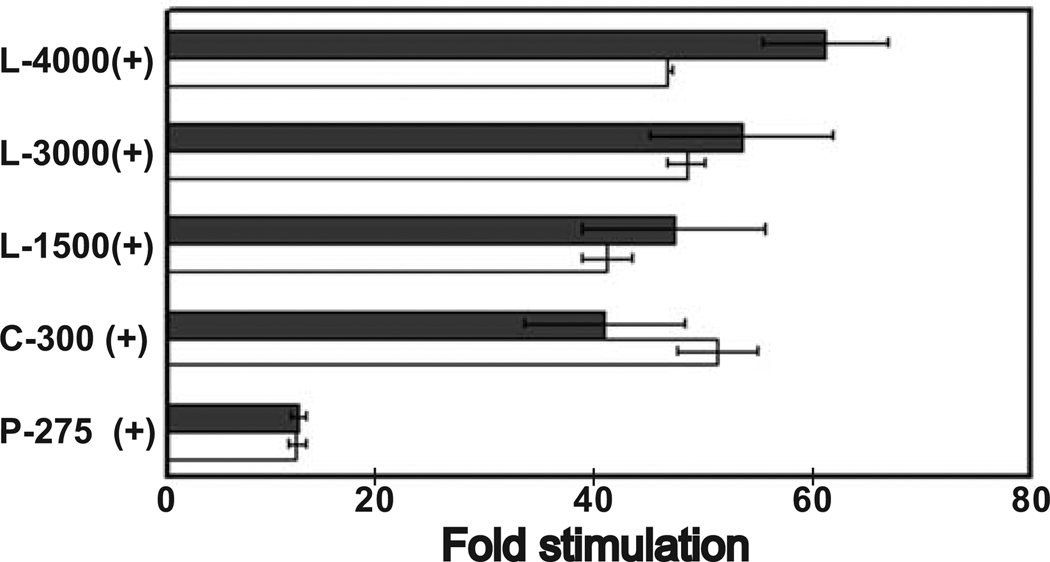
To explore further whether there was possibly an effect of some of these mediators on HYAL-2 transcription, experiments were conducted on C-28/I2 cells transfected with several of the luciferase - HYAL-2 promoter constructs namely; L-4000, L-3000 L-1500, C-300 and P-275. Compared to untreated C-28/I2 cells (Fig. 9, dark bars), there was no significant increase in luciferase activity in any of the HYAL-2 promoter constructs following 48 h of treatment of these cells with IL-1β (Fig 9, open bars). None of the constructs displayed significant changes in luciferase activity due to IL-1β treatment. A similar lack of change in luciferase activity was observed following treatment of transfected C-28/I2 cells with IFN-γ (data not shown), and with human embryonic kidney cells (HEK-293) under the same experimental treatment conditions (data not shown).
Fig 9. Effect of IL-1β on HYAL-2 promoter activity.
C-28/I2 cells were transfected with 0.2 µg promoter reporter constructs (L-4000, L-3000, L-1500, C-300, P-275 or empty pGL-3 Basic) for 24 h. Following an overnight pre-incubation in serum-free medium, the transfected cells were treated without or with 10 ng/ml IL-1β for an additional 24 h. The cells were then lysed and assayed for luciferase activity. The values represent the mean ± S.E. of a representative experiment (n=2) performed in duplicate and are expressed as fold stimulation with respect to pGL-3 Basic. The values are normalized to Renilla luciferase activity that was cotransfected (2ng) in the entire assay to correct for transfection efficiency. Solid bars represent control, untreated cells while open bars represent IL-1β treated cultures.
As another approach to further confirm these results, the effects of IL-1β on HYAL-2 were examined at the protein level. First, as shown in western blots using a peptide-specific polyclonal HYAL-2 antisera (Fig 10A), bands of ~50 kD are clearly defined both in cell layer extracts (lanes 1 and 2) as well as media concentrates (lanes 3 and 4). However, in samples treated with 10 ng/ml IL-1β for 48 h (lanes 2 and 4), there was no change in band intensity as compared to untreated controls (lanes 1 and 3). Potential changes in HYAL-2 protein were also examined by measurement of hyaluronidase activity using HA-zymography. As shown in Fig. 10B, light bands at ~50 kD in the HA-zymogram are representative of hyaluronidase activity. Compared to control, untreated human articular chondrocytes (lane 1) there was no change in signal intensity in the sample from chondrocytes treated for 48 h with IL-1β (lane 2). In total these results suggest that HYAL-2 expression, although an enzyme critical to the catabolism of HA, is not altered by the activity of catabolic cytokines or other cellular mediators.
Fig 10. Effect of IL-1β on HYAL-2 protein and hyaluronidase activity expressed by human articular chondrocytes.
Human articular chondrocytes were treated in the absence or presence of 10 ng/ml of IL-1β for 48 h in serum-free media. The media and cell lysates were collected and assayed for HYAL-2 protein expression by western blotting (Panel A) or analysis of media samples for hyaluronidase activity by HA-zymography (Panel B). Lanes 1 and 3 represent control, untreated chondrocytes; lanes 2 and 4, IL-1β treated chondrocytes. Lane labeled “std” denotes molecular weight protein standards.
DISCUSSION
In avascular tissues such as cartilage, HA catabolism is thought to occur locally by the action of resident chondrocytes (33). However, even in vascularized tissues such as the epidermis, a large percentage of HA catabolism still occurs locally (34). In cartilage, HA turnover closely parallels the catabolism of the major cartilage proteoglycan, aggrecan (4, 5). During episodes of physiological repair as well as in disease states such as osteoarthritis, the catabolism of HA and aggrecan are dramatically increased (33). In the case of the aggrecan, the resident chondrocytes initiate this enhanced catabolism by increasing production and activation of neutral pH-optimal extracellular proteinases—activities that are not matched by their respective natural inhibitors (e.g., TIMPs). However, an equally important, yet unanswered question is how the complementary HA catabolism is regulated by these same cells. When enhanced catabolism of HA is needed in a tissue such as cartilage, does this occur by the activation of hyaluronidase biosynthesis? Are these enzymes inducible and if so, how is this induction regulated? In this study we have demonstrated that the principal hyaluronidase expressed by chondrocytes is the lysosomal hyaluronidase, HYAL-2, along with lower levels of expression of HYAL-1 and HYAL-3. A similar hyaluronidase profile as shown in Fig. 1 was obtained following RT-PCR analysis of RNA isolated directly from cartilage tissue (data not shown). This suggests that HA catabolism must occur within a low pH environment. Experimentally, catabolic cytokines such as IL-1α, IL-1β, TNFα and IFN-γ are used to mimic the induction of enhanced catabolism of HA (7, 35, 36). In this study we demonstrated that at cytokine concentrations known to dramatically enhance HA catabolism, there was little-to-no change in the expression of HYAL-2 mRNA in either primary cultures of human articular chondrocytes or immortalized human chondrocytes (Figs. 7, 8). A similar lack of cytokine-induced change in the mRNA expression of the other hyaluronidase, HYAL-1 was also noted (data not shown). Nonetheless, to further address whether there is another, inducible hyaluronidase besides HYAL-2, an analysis was made using HA zymography (Fig. 10B). Only one major band exhibiting hyaluronidase activity was noted running with a molecular mass of 50 kD. Although we expect that this band represents in part, HYAL-2, the other hyaluronidases; HYAL-1, and HYAL-3 would also migrate to this same position or slightly higher. More importantly, these data demonstrate that regardless of which paralogous hyaluronidase gene is being expressed, there was no change in the level of hyaluronidase activity following treatment of chondrocytes with one of the more potent catabolic cytokines, IL-1β. Altogether, these findings would suggest that chondrocyte regulation of HA catabolism does not involve changes in the expression of hyaluronidase mRNA, hyaluronidase protein or modulation of enzyme activity.
These conclusions are supported by the other findings of this study. For example, it was demonstrated that the 5′ flanking region of the HYAL-2 gene has multiple transcription start sites, does not contain a canonical TATA box yet, is GC rich and contains several putative Sp1 sites. All of these features are characteristic of constitutively active housekeeping genes. However, several groups have demonstrated that dramatic increases in hyaluronidase do occur and are of physiological significance especially during embryonic development (16,37–39) and malignant tumor invasion (15,40–42). Such changes would appear incompatible with the notion of hyaluronidase as a housekeeping gene. One possibility to explain this dichotomy may be the selective utilization of transcription start sites by cells at different stages of differentiation. Transcription of HYAL-2 mRNA by placental cells was initiated at a site 57 bp upstream of exon 1 whereas for chondrocytes, HYAL-2 transcription was initiated within intron 1 and as such, resulted in mRNA transcripts devoid of exon 1. Basal promoter activity can be observed upstream of both transcription start sites however, in C-28I/2 cells, those start sites within the 5′ flanking region of intron 1 were the most active. In addition, whereas reversing the orientation of the intron 1 flanking promoter construct (C-600, Fig. 6A) resulted in a 3-fold decrease in basal promoter activity, reversing the orientation of the exon 1 flanking promoter construct (P-275, Fig. 6B) had no effect on luciferase activity. However again, these experiments were performed using immortalized adult chondrocytes and thus expression may be influenced to a greater degree by the basal promoter within this region. That the region between approximately +959 to +1158 represented a basal promoter was also evidenced with the longer, L-series constructs that spanned exon 1 and intron 1. Strong promoter activity was observed until the truncations were shorter than +1259 (L-1000, L-275 and L-163, Fig. 6C) after which the activity dropped to one-third of that observed for the L-4000, L-3000 and L-1500. It can also be seen from the data presented in Fig. 6C, that there was little change in luciferase activity between L-4000, L-3000 and L-1500. While all three of these constructs include the intron 1 flanking region (e.g., C-300 sequence), only the L-4000 and L-3000 include the 5′ region flanking exon 1 (e.g., P-275). This suggests that the 5′ flanking region upstream of exon 1 contributes little to the overall basal promoter activity of HYAL-2 in adult chondrocytes. It is not known as of yet whether the utilization of one transcription start in lieu of another has any functional significance. However, it is interesting to speculate that the promoter region upstream of exon 1 is utilized during development and malignant transformation whereas the sites within intron 1 are utilized by well-differentiated cell types. For example, numerous predicted TCF/LEF-1 sites (Fig. 3) are present in the 5′ flanking region upstream of exon 1 which may participate in regulation by Wnt / β-catenin signaling during embryonic development (43). Multiple predicted cis-elements for estrogen receptor binding, NF-kB and vitamin D (VDR/RXR) as well as two Smad-3 binding sites also occur within the 5′ flanking region of exon 1. In our preliminary studies, human articular chondrocytes treated with TGF-β also failed to exhibit a change in HYAL-2 mRNA levels (data not shown). Thus, even though multiple copies of these cis-elements are predicted in the region upstream of exon 1, they do not appear to influence expression levels in adult human chondrocytes. Future studies will examine whether there is a more robust responsiveness to cytokines, retinoids or TGF-β in embryonic or highly malignant cell types.
If altering the levels of hyaluronidase is not responsible for controlling HA catabolism by the cells of cartilage, the question remains as to how HA catabolism is regulated. Our work has demonstrated that CD44 receptor-mediated uptake of HA leading to its degradation intracellularly is a major pathway for the turnover of HA by chondrocytes (6,7,23,35). We demonstrated that internalized HA was sorted to the lysosome and its subsequent degradation was inhibited by the lysosomotropic agent chloroquine. Additionally, we have shown that treatment of articular chondrocytes with IL-1 enhances the expression of CD44 by 6–8 fold resulting in enhanced accumulation of intracellular HA (7,35). These data also would suggest that unlike aggrecan, HA is not being degraded extracellularly. If extracellular processing of HA did occur, and was mediated by an enzymatic activity, this would require an enhancement of enzymatic activity (i.e., hyaluronidase) during episodes of increased HA catabolism. Thus, given that CD44 expression is clearly modulated following the exposure of chondrocytes to catabolic cytokines while hyaluronidase remains unchanged, it is likely that the regulation of CD44-mediated endocytosis of HA is the primary mechanism used by chondrocytes to regulate HA catabolism.
Footnotes
The authors thank the donor families and the Gift of Hope Organ and Tissue Donor Network. The authors thank Dr. Cheryl B. Knudson for helpful discussions, support and critical review of this manuscript and Dr. Mary Goldring of Harvard Institutes of Medicine for the C-28/I2 cells. Supported in part by NIH grants RO1-AR43384, T32-AR07590 and P50-AR39239 (SCOR).
The abbreviations used are: DMEM, Dulbecco’s modified Eagles’s medium; FBS, fetal bovine serum; HA, hyaluronan; 5′ RACE, 5′ Rapid Amplification of cDNA Ends; IL-1α, interleukin-1α; IL-1β, interleukin-1β; TNF-α, tumor necrosis factor-α; IFN-γ, interferon-γ; HYAL-1, Hyaluronidase-1; HYAL-2, Hyaluronidase-2; HYAL-3, Hyaluronidase-3; SPAM-1, Sperm Adhesion Molecule; cDNA, complementary deoxyribonucleic acid; bp, base pair; RT-PCR, reverse transcriptase-polymerase chain reaction.
REFERENCES
- 1.Knudson W, Knudson CB. Curr Opin Orthop. 2004;15:369–375. [Google Scholar]
- 2.Laurent TC, Fraser RE. FASEB J. 1992;6:2397–2404. [PubMed] [Google Scholar]
- 3.Buckwalter JA, Rosenberg LC. J. Biol. Chem. 1982;257:9830–9839. [PubMed] [Google Scholar]
- 4.Morales TI, Hascall VC. J. Biol. Chem. 1988;263:3632–3638. [PubMed] [Google Scholar]
- 5.Ng KC, Handley CJ, Preston BN, Robinson HC. Arch. Biochem. Biophys. 1992;298:70–79. doi: 10.1016/0003-9861(92)90095-e. [DOI] [PubMed] [Google Scholar]
- 6.Hua Q, Knudson CB, Knudson W. J. Cell Sci. 1993;106:365–375. doi: 10.1242/jcs.106.1.365. [DOI] [PubMed] [Google Scholar]
- 7.Chow G, Knudson CB, Homandberg G, Knudson W. J. Biol. Chem. 1995;270:27734–27741. doi: 10.1074/jbc.270.46.27734. [DOI] [PubMed] [Google Scholar]
- 8.Knudson W, Chow G, Knudson CB. Matrix Biol. 2002;21:15–23. doi: 10.1016/s0945-053x(01)00186-x. [DOI] [PubMed] [Google Scholar]
- 9.Embry J, Knudson W. Arthritis Rheum. 2003;48:3431–3441. doi: 10.1002/art.11323. [DOI] [PubMed] [Google Scholar]
- 10.Csoka AB, Scherer SW, Stern R. Genomics. 1999;60:356–361. doi: 10.1006/geno.1999.5876. [DOI] [PubMed] [Google Scholar]
- 11.Csoka AB, Frost GI, Stern R. Matrix Biol. 2001;20:499–508. doi: 10.1016/s0945-053x(01)00172-x. [DOI] [PubMed] [Google Scholar]
- 12.Flannery CR, Little CB, Hughes CE, Caterson B. Biochem. Biophys. Res. Commun. 1998;251:824–829. doi: 10.1006/bbrc.1998.9561. [DOI] [PubMed] [Google Scholar]
- 13.Lepperdinger G, Strobl B, Kreil G. J Biol Chem. 1998;273:22466–22470. doi: 10.1074/jbc.273.35.22466. [DOI] [PubMed] [Google Scholar]
- 14.Mullegger J, Lepperdinger G. Mech Dev. 2002;111:25–35. doi: 10.1016/s0925-4773(01)00593-7. [DOI] [PubMed] [Google Scholar]
- 15.Novak U, Stylli SS, Kaye AH, Lepperdinger G. Cancer Res. 1999;59:6246–6250. [PubMed] [Google Scholar]
- 16.Lepperdinger G, Mullegger J, Kreil G. Matrix Biol. 2001;20:509–514. doi: 10.1016/s0945-053x(01)00170-6. [DOI] [PubMed] [Google Scholar]
- 17.Li Y, Rahmanian M, Widstrom C, Lepperdinger G, Frost GI, Heldin P. Am J Respir Cell Mol Biol. 2000;23:411–418. doi: 10.1165/ajrcmb.23.3.4102. [DOI] [PubMed] [Google Scholar]
- 18.Ohno S, Ijuin C, Doi T, Yoneno K, Tanne K. J Periodontol. 2002;73:1331–1337. doi: 10.1902/jop.2002.73.11.1331. [DOI] [PubMed] [Google Scholar]
- 19.Selbi W, de la Motte C, Hascall V, Phillips A. J Am Soc Nephrol. 2004;15:1199–1211. doi: 10.1097/01.asn.0000125619.27422.8e. [DOI] [PubMed] [Google Scholar]
- 20.Sun L, Feusi E, Sibalic A, Beck-Schimmer B, Wuthrich RP. Kidney Blood Press Res. 1998;21:413–418. doi: 10.1159/000025893. [DOI] [PubMed] [Google Scholar]
- 21.Mohamadzadeh M, DeGrendele H, Arizpe H, Estess P, Siegelman M. J Clin Invest. 1998;101:97–108. doi: 10.1172/JCI1604. [DOI] [PMC free article] [PubMed] [Google Scholar]
- 22.Nicoll SB, Barak O, Csoka AB, Bhatnagar RS, Stern R. Biochem Biophys Res Commun. 2002;292:819–825. doi: 10.1006/bbrc.2002.6697. [DOI] [PubMed] [Google Scholar]
- 23.Jiang H, Peterson RS, Wang W, Bartnik E, Knudson CB, Knudson W. J. Biol. Chem. 2002;277:10531–10538. doi: 10.1074/jbc.M108654200. [DOI] [PubMed] [Google Scholar]
- 24.Altschul SF, Madden TL, Schaffer AA, Zhang J, Zhang Z, Miller W, Lipman DJ. Nucleic Acids Res. 1997;25:3389–3402. doi: 10.1093/nar/25.17.3389. [DOI] [PMC free article] [PubMed] [Google Scholar]
- 25.Miura RO, Yamagata S, Miura Y, Harada T, Yamagata T. Anal Biochem. 1995;225:333–340. doi: 10.1006/abio.1995.1163. [DOI] [PubMed] [Google Scholar]
- 26.Aird WC, Parvin JD, Sharp PA, Rosenberg RD. J Biol Chem. 1994;269:883–889. [PubMed] [Google Scholar]
- 27.Javahery R, Khachi A, Lo K, Zenzie-Gregory B, Smale ST. Mol Cell Biol. 1994;14:116–127. doi: 10.1128/mcb.14.1.116. [DOI] [PMC free article] [PubMed] [Google Scholar]
- 28.Sehgal A, Patil N, Chao M. Mol Cell Biol. 1988;8:3160–3167. doi: 10.1128/mcb.8.8.3160. [DOI] [PMC free article] [PubMed] [Google Scholar]
- 29.Hapgood JP, Riedemann J, Scherer SD. Cell Biol Int. 2001;25:17–31. doi: 10.1006/cbir.2000.0674. [DOI] [PubMed] [Google Scholar]
- 30.Dynan WS, Tjian R. Cell. 1983;35:79–87. doi: 10.1016/0092-8674(83)90210-6. [DOI] [PubMed] [Google Scholar]
- 31.Smale ST. In: Transcription: mechanisms and regulation. Conaway RC, Conway JW, editors. New York: Raven Press; 1994. pp. 63–81. [Google Scholar]
- 32.Smale ST, Baltimote D. Cell. 1989;57:103–113. doi: 10.1016/0092-8674(89)90176-1. [DOI] [PubMed] [Google Scholar]
- 33.Knudson CB, Knudson W, Smith RL. Clin Orthop. 2004:S152–S162. [PubMed] [Google Scholar]
- 34.Tammi RH, Tammi MI. In: Chemistry and biology of hyaluronan. Garg HG, Hales CA, editors. Amsterdam: Elsevier; 2004. pp. 395–413. [Google Scholar]
- 35.Nishida Y, D'Souza AL, Thonar JMA, Knudson W. Arthritis Rheum. 2000;43:1315–1326. doi: 10.1002/1529-0131(200006)43:6<1315::AID-ANR14>3.0.CO;2-#. [DOI] [PubMed] [Google Scholar]
- 36.Henrotin YE, Zheng SX, Labasse AH, Deby GP, Crielaard JM, Reginster JY. Osteoarthritis Cartilage. 2000;8:474–482. doi: 10.1053/joca.1999.0323. [DOI] [PubMed] [Google Scholar]
- 37.Orkin RW, Toole BP. Developmental Biology. 1978;66:308–320. doi: 10.1016/0012-1606(78)90240-3. [DOI] [PubMed] [Google Scholar]
- 38.Toole BP, Gross J. Developmental Biology. 1971;25:57–77. doi: 10.1016/0012-1606(71)90019-4. [DOI] [PubMed] [Google Scholar]
- 39.Toole BP. Developmental Biology. 1972;29:321–329. doi: 10.1016/0012-1606(72)90071-1. [DOI] [PubMed] [Google Scholar]
- 40.Bourguignon LY, Singleton PA, Diedrich F, Stern R, Gilad E. J Biol Chem. 2004;279:26991–27007. doi: 10.1074/jbc.M311838200. [DOI] [PubMed] [Google Scholar]
- 41.Boudreau N, Turley E, Rabinovitch M. Dev Biol. 1991;143:235–247. doi: 10.1016/0012-1606(91)90074-d. [DOI] [PubMed] [Google Scholar]
- 42.Haglund K, Di Fiore PP, Dikic I. Trends Biochem Sci. 2003;28:598–603. doi: 10.1016/j.tibs.2003.09.005. [DOI] [PubMed] [Google Scholar]
- 43.van Noort M, Clevers H. Dev Biol. 2002;244:1–8. doi: 10.1006/dbio.2001.0566. [DOI] [PubMed] [Google Scholar]
- 44.Quandt L, Frech K, Karas H, Wingender E, Werner T. Nucleic Acids Res. 1995;23:4878–4884. doi: 10.1093/nar/23.23.4878. [DOI] [PMC free article] [PubMed] [Google Scholar]


