Abstract
Objectives:
We tested the hypothesis that age is a prognostic factor with respect to long-term accumulation of disability in multiple sclerosis (MS).
Methods:
Kaplan-Meier analysis and binary logistic regression models determined the effect of age at disease onset, age at onset of progression, and current age on attainment of severe disability levels (Disability Status Scale [DSS] 6–8–10) from the London, Ontario, database (n = 1,023).
Results:
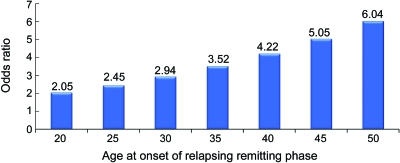
Older age at relapsing-remitting (RR) phase onset was associated with higher risk of reaching advanced DSS scores. This was independent of disease duration and early relapse frequency but secondary to increased risk of conversion to secondary progressive (SP) MS. Onset at age 40 (odds ratio [OR] = 4.22) and at age 50 (OR = 6.04) doubled and tripled risks of developing SP, compared to age 20 (OR = 2.05). Younger age at conversion to SPMS was associated with shorter times to high DSS scores from disease onset. The progressive course, unaffected by age at RR onset, was only modestly affected by age at SP onset. Among primary progressive and RR/SP patients, median ages at attainment of DSS scores were strikingly similar: DSS = 6, 49 vs 48 years; DSS = 8, 58 vs 58 years; and DSS = 10, 78 years for both (p = NS for all comparisons).
Conclusions:
Development of SP is the dominant determinant of long-term prognosis, independent of disease duration and early relapse frequency. Age independently affects disability development primarily by changing probability and latency of SP onset, with little effect on the progressive course.
Clinical features of multiple sclerosis (MS) are heterogeneous, with severity ranging from benign1,2 to malignant.3 In relapsing-remitting (RR) MS, there are modest predictive effects of early relapses,4–7 but not total attacks7; rather, conversion to secondary progressive (SP) MS is the key determinant of long-term prognosis.7 The development of severe disability also occurs with primary progressive (PP) forms,8 and in both SP and PP evolves largely independently of preceding factors,5,7,8 and may result from the same mechanisms leading to its onset.7
Age may also affect prognosis in MS. Being older at disease onset is associated with shorter times to disability levels.5,9–16 Although with progressive forms the mean age at onset of progression does not differ,8,17–19 the ages at which various disability landmarks are attained are similar among all MS subtypes.6,20 In light of these observations, it is possible that MS could be a single-stage disorder driven by neurodegenerative age-related mechanisms.20
Against this background we set out to further clarify relationships between age and disease evolution before and after the onset of the progressive phase, the key event heralding eventual severe disability.
METHODS
The characteristics of the London, Ontario, MS Clinic have been extensively described.7,8,17 Patients were evaluated annually or semiannually. At each visit new information was collected and data previously recorded were confirmed. Disability was assessed using the Disability Status Scale (DSS).21 The observation period spanned from 1972 to 2000 and resulted in ascertainment of some 28,000 patient-years. No patient received disease-modifying therapies (DMTs). The database was recently (2009) subjected to a rigorous data quality process.
Population and outcomes.
The London, Ontario, database comprises 1,023 patients with mean disease duration of 24.2 years. Within the total population, 2 subpopulations were identified: 1) the subgroup from Middlesex County (MC), which represented 90% of MC patients with MS22; 2) a subgroup of patients seen from disease onset (SO), the vast majority within 12 months from the diagnosis.23 Survival between the 2 subgroups and the total population is remarkably similar (unpublished data) indicating minimal ascertainment and referral bias. The disease spectrum included 1) RRMS; 2) SPMS, following an initial relapsing-remitting phase; 3) PPMS, having progressive onset.17 Progressive relapsing (PR) cases were included in the PP group as the 2 groups have the same long-term outcome.24 Progressive disease, both in PP and SP cases, was defined by at least 1 year of continuous deterioration, regardless of the rate of worsening. Transitory plateaus and minor temporary improvements in the progressive course were recorded in the long term, although steady progression was the rule. Clinical onset was derived from the date (year) of first symptom; for patients not seen at onset, DSS scores21 were determined retrospectively from outside records. Documentation collected for the onset of the SP phase and for the hard disability endpoints of requiring aid for walking (DSS 6) and restriction to bed with preserved use of arms (DSS 8), which were the focus of this study, and death from MS (DSS 10) were repeatedly checked during the observation period, thus resolving ambiguities. If DSS scores had not been recorded, they were derived from the description of neurologic findings, only when unambiguous, which was nearly universally the case for cane and bedridden status.
Statistical methods.
We investigated the relationships among disability accumulation and the following variables: 1) age at disease onset, 2) age at onset of progression, 3) current age (age at last assessment), and 4) type of disease course.
Binary logistic regression analysis was utilized to assess 1) the risk of experiencing a PP course according to increasing age at disease onset; 2) the risk of entering the SP phase and to attain DSS levels according to increasing age at disease onset, increasing current age (“growing older”), and increasing disease duration; and 3) the risk of attaining DSS levels according to increasing age at onset of progression. Within each disease course category, patients were grouped according to age at disease onset and age at onset of progression. Grouping aimed for similar numbers in each category; additional stratifications served as internal controls.
Kaplan-Meier analysis estimated times to conversion to SP from disease onset, age at onset of progression, the times to attain DSS 6–8–10 from disease onset and from onset of SP, and age at disability levels in each group. Log-rank test investigated differences observed. Information on DSS assessment was not always available, resulting in different numbers of patients contributing at each DSS level when estimating the time to disability survival curves. Patients who had not yet reached specified DSS levels, but who had been followed for a known period were right censored. Cox regression multiple analysis investigated the concomitant predictive effect of age and number of relapses. It was also used for internal validation of results from binary logistic regression analysis. The χ2 test and the Wilcoxon signed-rank test were used for the comparisons of categorical data and quantitative data, respectively. Spearman rank correlation test assessed the effect of age on number of relapses experienced.
A statistical analysis plan was set up and mutually agreed upon among the authors.25 All statistical analyses were performed using SPSS software (version 15) by one author (A.S.) and subsequently independently recalculated at the Sylvia Lawry Centre where R software26 was used.
Standard protocol approvals, registrations, and patient consents.
Written informed consent was obtained from all patients (or guardians of patients) participating in the study (consent for research).
Approval was received from an ethical standards committee on human experimentation for experiments using human subjects including at London, Ontario.
RESULTS
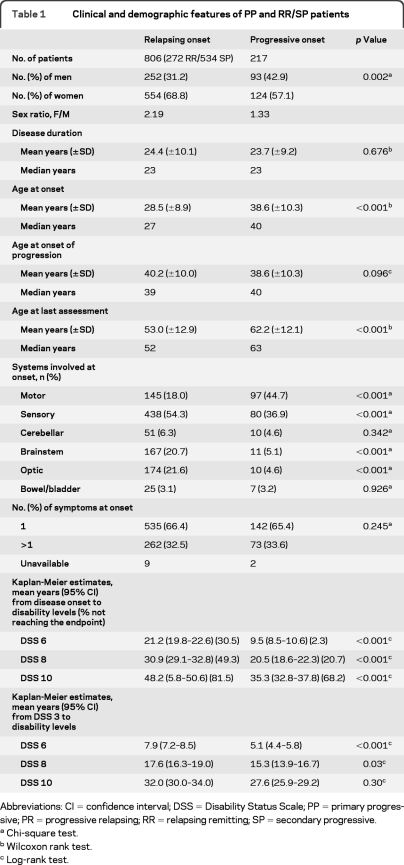
Within the total population, 806 patients had relapsing onset (78.8%) and 217 (21.2%) had PPMS (table 1). By the end of the observation period, among RR patients, 272 (33.7%) remained in the RR phase and 534 (66.3%) had entered the SP phase. The PP group, compared to the RR/SP group, had fewer women (57.1% vs 68.8%; p = 0.001), was a decade older at disease onset (mean age 38.6 vs 28.5 years; p < 0.001), and presented more frequently with motor disturbances (44.7% vs 17.9%; p < 0.001).
Table 1.
Clinical and demographic features of PP and RR/SP patients
Abbreviations: CI = confidence interval; DSS = Disability Status Scale; PP = primary progressive; PR = progressive relapsing; RR = relapsing remitting; SP = secondary progressive.
Chi-square test.
Wilcoxon rank test.
Log-rank test.
The number of patients reaching disability endpoints increased with disease duration and in greater proportion within the PP group compared to the RR onset group. Ten years after clinical onset, 63.9% of PP patients as compared to 26.1% of RR/SP patients had already reached DSS 6; 21.1% compared to 8.8% had reached DSS 8. Twenty years after onset, these percentages of PP compared to RR/SP patients increased to 91.8% and 53.1% reaching DSS 6 and 56.2% and 27.3% reaching DSS 8. By the end of the observation period, 79% of PP patients had reached DSS 8; 48% of relapsing onset patients were between DSS 8 and 10.
PP patients took shorter estimated times to disability endpoints from clinical onset (table 1). However, the 2 groups matched more closely, with less than 3 years difference on average for reaching DSS 6–8, when survival was compared from DSS 3, thereby encompassing the SP phase7 for most (but by no means all) RR patients.
Age and disability accumulation.
Age at disease onset.
The risk of having a PP disease course increased with age at onset (HR 1.10 per additional year at onset; p < 0.001). However, age at disease onset within the PP group had no influence on disease evolution.17 In contrast, age at onset of RR phase affected long-term disease evolution by changing the probability and latency of the progressive course. Being older proportionally increased the probability of entering the SP phase (OR = 1.04; p < 0.001) and of reaching DSS 6 (OR 1.04; p < 0.001), DSS 8 (OR 1.02; p = 0.02), and DSS 10 (OR 1.03; p = 0.004). Onset at age 40 (OR = 4.22) and at age 50 (OR = 6.04) doubled and tripled the risk of converting to SPMS, compared to onset at the age of 20 (OR = 2.05) (figure 1). These effects appeared independent, as they remained unchanged when adjusted for the concomitant effect of disease duration.
Figure 1. Risk of converting to secondary progressive multiple sclerosis (SPMS) according to age at onset of relapsing-remitting (RR) phase.
Binary logistic regression analysis. Odds ratios expressing the risk of converting to SPMS according to increasing age at onset of RR phase. The probability of entering the SP phase increases proportionally with the age at onset.
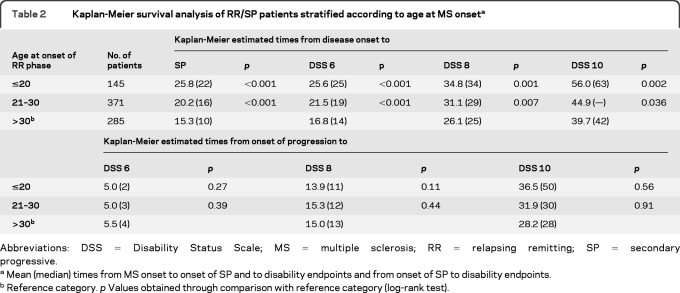
When grouped, younger RR patients at first relapse took longer to convert to SPMS and to accumulate severe disability (table 2) from disease onset. This effect was limited to the evolution of the RR phase and was no longer evident once the progressive phase supervened. Times to attain disability endpoints from onset of secondary progression were remarkably similar among groups (table 2).
Table 2.
Kaplan-Meier survival analysis of RR/SP patients stratified according to age at MS onseta
Abbreviations: DSS = Disability Status Scale; MS = multiple sclerosis; RR = relapsing remitting; SP = secondary progressive.
Mean (median) times from MS onset to onset of SP and to disability endpoints and from onset of SP to disability endpoints.
Reference category. p Values obtained through comparison with reference category (log-rank test).
Multiple analysis.
The number of relapses in the first 2 years (early relapses)7 and age at onset exerted their predictive effects primarily by increasing the probability of converting to SPMS and by shortening the latency to onset of the progressive phase. Therefore, we tested whether age at onset of the RR phase conditioned early relapse frequency. Surprisingly, age at first symptom did not significantly affect the number of early relapses (r = −0.05, p = 0.13). In contrast, being older at onset correlated with fewer relapses experienced from the third year up to onset of the SP phase (r = −0.26, p < 0.001). In addition, multiple Cox regression analysis demonstrated that the predictive effects of year 1–2 relapse frequency and of age at first relapse are independent. Those younger at onset of the RR phase had a lower hazard of entering the progressive phase and of reaching DSS levels, independent of the number of early relapses.
Age at onset of progression.
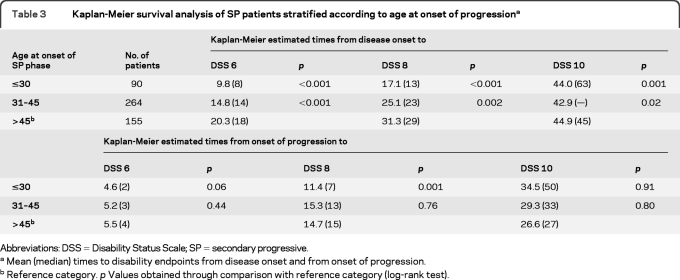
Type of disease course did not influence the age at which progression developed. Survival analysis from birth to onset of progression demonstrated that the mean age when entering the progressive phase was similar in those with an initial RR course (i.e., SPMS) or not (PPMS) (40.2 vs 38.6 years; p = 0.096) (table 1). Age at onset of SP inversely correlated with the probability of reaching DSS levels. Being older at conversion to SPMS decreased the risk of attaining DSS 6 (OR 0.96; p = 0.03) and DSS 8 (OR 0.96; p < 0.001). Groups younger at SP entry took shorter times to DSS levels from disease onset (table 3). However, times to attain disability levels from onset of progression were largely uninfluenced by the age at which SP developed. Only those aged ≤30 at conversion to SP attained DSS 8 from progression in a shorter time (table 3).
Table 3.
Kaplan-Meier survival analysis of SP patients stratified according to age at onset of progressiona
Abbreviations:DSS = Disability Status Scale; SP = secondary progressive.
Mean (median) times to disability endpoints from disease onset and from onset of progression.
Reference category. p Values obtained through comparison with reference category (log-rank test).
Current age.
We next investigated the relationship between patients' current age (age at last visit) and disability accumulation. In the total population, aging increased the probability of reaching DSS 3 (OR 1.08; p < 0.001), DSS 6 (OR 1.07; p < 0.001), DSS 8 (OR 1.04; p < 0.001), and marginally DSS 10 (OR 1.01; p = 0.05). The regression model, adjusted for the concomitant effect of current age and disease duration, left the effect of growing older unchanged while the effect of disease duration became insignificant for all endpoints (DSS 3 OR = 1.02, p = 0.19; DSS 6 OR = 1.01, p = 0.59; DSS 8 OR = 1.01, p = 0.53) except for DSS 10 (OR = 0.97, p = 0.002). These results strongly indicate that disability accumulates while growing older independently of the duration of disease.
However, there were differences in the effects of current age between the relapsing and the progressive onset groups. In RR onset patients, ageing increased the probability of entering the SP phase (OR 1.06; p < 0.001) and of attaining DSS 3 (OR 1.08; p < 0.001), DSS 6 (OR 1.06; p < 0.001), and DSS 8 (OR 1.04; p < 0.001), all independently of disease duration. In striking contrast, current age did not exert any effect on the likelihood of reaching disability endpoints in PP patients (DSS 3 OR = 0.93, p = 0.48; DSS 6 OR = 1.01, p = 0.70; DSS 8 OR = 1.02, p = 0.27; DSS 10 OR = 0.98, p = 0.12).
Age at disability landmarks.
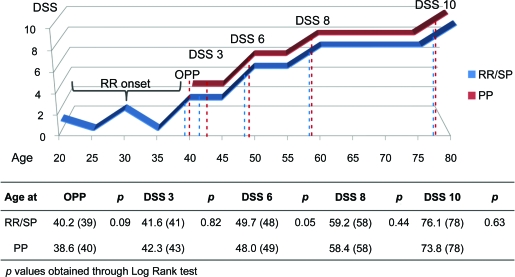
Survival analysis from birth estimated for the total population of 1,023 patients a mean age of 41.6 years (95% confidence interval [CI] 40.8–42.4) at DSS 3, 49.0 years (95% CI 48.0–50.0) at DSS 6, 58.7 years (95% CI 57.5–59.9), at DSS 8, and 75.3 years (95% CI 73.4–77.1) at DSS 10. The percentage of patients reaching DSS levels necessarily increased proportionally with age; the rate at which disability accumulated while growing older was very similar between PP and SP patient groups. By age 55, 70.9% of PP patients and 74.7% of SP patients had reached DSS 6; by age 65, these percentages increased to 89.4% and 85.9%.
The type of initial disease course did not exert an effect on the age at which disability levels were reached. Relapsing onset and progressive onset patients attained DSS 3, 6, 8, and 10 at remarkably similar ages (figure 2).
Figure 2. Ages at attainment of disability endpoints according to type of disease course.
Kaplan-Meier survival analysis from birth. Mean (median) age at onset of progression (OPP) and at disability levels in relapsing-remitting (RR)/secondary progressive (SP) and primary progressive (PP) patients. p Values obtained with log-rank test. DSS = Disability Status Scale.
DISCUSSION
This study provides a complete account of mean/median ages at all milestone disability levels in a large well-ascertained population with a long-term follow-up. Our study redefines age as an independent and important factor contributing to disease evolution.
Age at onset of the RR phase and advancing years (current age) affect disability accumulation, independent of disease duration, largely by increasing the probability of experiencing a progressive course and by shortening the latency to progression. This is further confirmed by the lack of effect of current age on disability accumulation during the PP phase, indicating that the effect of growing older on long-term outcome in RR patients is secondary to the increased probability of converting to SPMS, while having relatively little if any effect on the evolution of the progressive phase. Similarly, older age at onset of the RR phase, independently of the number of early relapses, associated with an increased probability and a shorter latency to the progressive course and therefore significantly affected the long-term disease evolution.
The evolution of the SP phase was confirmed to be largely independent of factors preceding its onset.5,7,8 Times to DSS levels from onset of SP were similar among patients grouped according to age at disease onset, indicating that the slope of the secondary progressive phase was not much affected by age at which the RR phase started. However, the anamnestic nature of SP does not extend to the age at its onset. Patients with a worse outcome had a shorter RR phase7 and therefore entered the SP phase at younger age. Groups younger when converting to SPMS were at higher risk of developing severe disability and took significantly shorter times to attain endpoints from disease onset (table 3) but the size of this effect is seen in the small difference in ORs for DSS 6 (OR 0.96; p = 0.03) and DSS 8 (OR 0.97; p = 0.003). These results emphasize the key role played by the onset of the progressive phase on long-term evolution and confirm that outcome is mainly determined before becoming progressive.
However, the rate of disability accumulation during progression not only was unaffected by age at onset of RR phase but was also not influenced by age at onset of progression or by aging. PP and SP started at similar ages and their similar evolution led all patients to accumulate disability at similar ages (figure 2). Accordingly, though in mild contrast with a previous report20 (which, it must be said, had a frequency of right-censored patients exceeding 50%), Kaplan-Meier estimated times from birth to disability landmarks were not affected by type of initial disease course (figure 2).
These findings imply that the progressive phase may be the core phenotype of MS, and its probability, latency, and slope should be the essential targets of treatment and investigation. Prognosis is confirmed to be largely determined before the onset of progression and age appears to have a strong effect on the evolution of the RR phase. Elucidation of mechanisms is beyond the capacity and scope of the present study, but there are immediate implications for prognosis in all types of MS and for clinical trials design and treatment strategy. Broad age ranges (e.g., 18–55 years) being commonly recruited in clinical trials may add unanticipated variation that may weaken randomization schemes. Stratification by age, heretofore underutilized, may be advantageous, especially if the primary outcome is onset of SP. Early disease stages, especially during young ages, represent a window of opportunity for future treatments that should be focused on preventing or delaying the onset of the secondary progression, the major determinant of permanent disability development.
GLOSSARY
- CI
confidence interval
- DMT
disease-modifying therapy
- DSS
Disability Status Scale
- MC
Middlesex County
- MS
multiple sclerosis
- OR
odds ratio
- PP
primary progressive
- PR
progressive relapsing
- RR
relapsing-remitting
- SO
patients seen from disease onset
- SP
secondary progressive
AUTHOR CONTRIBUTIONS
Dr. Scalfari: drafting/revising the manuscript, study concept or design, analysis or interpretation of data, statistical analysis, study supervision, obtaining funding. A. Neuhaus: drafting/revising the manuscript, study concept or design, analysis or interpretation of data, statistical analysis. Dr. Daumer: drafting/revising the manuscript, study concept or design, analysis or interpretation of data, statistical analysis. Prof. Ebers: drafting/revising the manuscript, study concept or design, analysis or interpretation of data, acquisition of data, statistical analysis, study supervision, obtaining funding. Dr. Muraro: drafting/revising the manuscript, study concept or design, analysis or interpretation of data, study supervision, obtaining funding.
DISCLOSURE
Dr. Scalfari reports no disclosures. A. Neuhaus receives research support from the German Ministry for Education and Research (BMBF). Dr. Daumer serves on the scientific advisory board for EPOSA study; has received funding for travel from ECTRIMS; serves on the editorial board of MedNous; is author on patents re: Apparatus for measuring activity (Trium Analysis Online GmbH), Method and device for detecting a movement pattern (Trium Analysis Online GmbH), Device and method to measure the activity of a person, Device and method to determine the fetal heart rate from ultrasound signals, Method and device for detecting drifts, jumps and/or outliers of measurement values, Device and method to determine the global alarm state of a patient monitoring system, Method of communication of units in a patient monitoring system, Method and device for detecting drifts, jumps and/or outliers of measurement values, and System and method for patient monitoring; serves as Managing Director of and holds stock/stock options in Trium Analysis Online GmbH (50% effort); serves as a consultant for University of Oxford, Imperial College London, University of Southampton, Charite, Berlin, University of Vienna, Greencoat Ltd, Biopartners, Biogen Idec, Bayer Schering Pharma, Roche, and Novartis; and receives/has received research support from the EU-FP7, BMBF, BWiMi, and Hertie Foundation. Prof. Ebers serves on the editorial boards of the International Multiple Sclerosis Journal and Multiple Sclerosis and as Section Editor for BMC Medical Genetics; has received funding for travel or speaker honoraria from Bayer Schering Pharma, sanofi-aventis, Roche, and UCB; has served as a consultant to Biopartners, Bayer Schering Pharma, Howrey LLP, Heron Health, and Eli Lilly and Company; and receives research support from Bayer Schering Pharma, the Multiple Sclerosis Society of the United Kingdom, and the Multiple Sclerosis Society of Canada Scientific Research Foundation. Dr. Muraro receives/has received research support from the Medical Research Council UK, UK Multiple Sclerosis Society/UK Stem Cell Foundation, and Italian Multiple Sclerosis Foundation (FISM).
REFERENCES
- 1. Hawkins SA, McDonnell GV. Benign multiple sclerosis? Clinical course, long term follow up, and assessment of prognostic factors. J Neurol Neurosurg Psychiatry 1999;67:148–152 [DOI] [PMC free article] [PubMed] [Google Scholar]
- 2. Ramsaransing GS, De Keyser J. Benign course in multiple sclerosis: a review. Acta Neurol Scand 2006;113:359–369 [DOI] [PubMed] [Google Scholar]
- 3. Lublin FD, Reingold SC. Defining the clinical course of multiple sclerosis: results of an international survey: National Multiple Sclerosis Society (USA) Advisory Committee on Clinical Trials of New Agents in Mu ltiple Sclerosis Neurology 1996;46:907–911 [DOI] [PubMed] [Google Scholar]
- 4. Confavreux C, Vukusic S, Moreau T, Adeleine P. Relapses and progression of disability in multiple sclerosis. N Engl J Med 2000;343:1430–1438 [DOI] [PubMed] [Google Scholar]
- 5. Confavreux C, Vukusic S, Adeleine P. Early clinical predictors and progression of irreversible disability in multiple sclerosis: an amnesic process. Brain 2003;126:770–782 [DOI] [PubMed] [Google Scholar]
- 6. Leray E, Yaouanq J, Le Page E, et al. Evidence for a two-stage disability progression in multiple sclerosis. Brain 2010;133:1900–1913 [DOI] [PMC free article] [PubMed] [Google Scholar]
- 7. Scalfari A, Neuhaus A, Degenhardt A, et al. The natural history of multiple sclerosis: a geographically based study 10: relapses and long-term disability. Brain 2010;133:1914–1929 [DOI] [PMC free article] [PubMed] [Google Scholar]
- 8. Kremenchutzky M, Rice GP, Baskerville J, Wingerchuk DM, Ebers GC. The natural history of multiple sclerosis: a geographically based study 9: observations on the progressive phase of the disease. Brain 2006;129:584–594 [DOI] [PubMed] [Google Scholar]
- 9. Weinshenker BG, Rice GP, Noseworthy JH, Carriere W, Baskerville J, Ebers GC. The natural history of multiple sclerosis: a geographically based study: 3: multivariate analysis of predictive factors and models of outcome. Brain 1991;114:1045–1056 [DOI] [PubMed] [Google Scholar]
- 10. Runmarker B, Andersen O. Prognostic factors in a multiple sclerosis incidence cohort with twenty-five years of follow-up. Brain 1993;116:117–134 [DOI] [PubMed] [Google Scholar]
- 11. Kantarci O, Siva A, Eraksoy M, et al. Survival and predictors of disability in Turkish MS patients: Turkish Multiple Sclerosis Study Group (TUMSSG). Neurology 1998;51:765–772 [DOI] [PubMed] [Google Scholar]
- 12. Poser S, Raun NE, Poser W. Age at onset, initial symptomatology and the course of multiple sclerosis. Acta Neurol Scand 1982;66:355–362 [DOI] [PubMed] [Google Scholar]
- 13. Riise T, Gronning M, Fernandez O, et al. Early prognostic factors for disability in multiple sclerosis, a European multicenter study. Acta Neurol Scand 1992;85:212–218 [DOI] [PubMed] [Google Scholar]
- 14. Phadke JG. Clinical aspects of multiple sclerosis in north-east Scotland with particular reference to its course and prognosis. Brain 1990;113:1597–1628 [DOI] [PubMed] [Google Scholar]
- 15. Fog T, Linnemann F. The course of multiple sclerosis in 73 cases with computer-designed curves. Acta Neurol Scand Suppl 1970;47:3–175 [PubMed] [Google Scholar]
- 16. Confavreux C, Aimard G, Devic M. Course and prognosis of multiple sclerosis assessed by the computerized data processing of 349 patients. Brain 1980;103:281–300 [DOI] [PubMed] [Google Scholar]
- 17. Cottrell DA, Kremenchutzky M, Rice GP, et al. The natural history of multiple sclerosis: a geographically based study: 5: the clinical features and natural history of primary progressive multiple sclerosis. Brain 1999;122:625–639 [DOI] [PubMed] [Google Scholar]
- 18. Koch M, Mostert J, Heersema D, De Keyser J. Progression in multiple sclerosis: further evidence of an age dependent process. J Neurol Sci 2007;255:35–41 [DOI] [PubMed] [Google Scholar]
- 19. Confavreux C, Vukusic S. Natural history of multiple sclerosis: a unifying concept. Brain 2006;129:606–616 [DOI] [PubMed] [Google Scholar]
- 20. Confavreux C, Vukusic S. Age at disability milestones in multiple sclerosis. Brain 2006;129:595–605 [DOI] [PubMed] [Google Scholar]
- 21. Kurtzke JF. A new scale for evaluating disability in multiple sclerosis. Neurology 1955;5:580–583 [DOI] [PubMed] [Google Scholar]
- 22. Hader WJ, Elliot M, Ebers GC. Epidemiology of multiple sclerosis in London and Middlesex County, Ontario, Canada. Neurology 1988;38:617–621 [DOI] [PubMed] [Google Scholar]
- 23. Weinshenker BG, Bass B, Rice GP, et al. The natural history of multiple sclerosis: a geographically based study: I: clinical course and disability. Brain 1989;112:133–146 [DOI] [PubMed] [Google Scholar]
- 24. Kremenchutzky M, Cottrell D, Rice G, et al. The natural history of multiple sclerosis: a geographically based study: 7: progressive-relapsing and relapsing-progressive multiple sclerosis: a re-evaluation. Brain 1999;122:1941–1950 [DOI] [PubMed] [Google Scholar]
- 25. Daumer M, Held U, Ickstadt K, Heinz M, Schach S, Ebers G. Reducing the probability of false positive research findings by pre-publication validation: experience with a large multiple sclerosis database. BMC Med Res Methodol 2008;8:18. [DOI] [PMC free article] [PubMed] [Google Scholar]
- 26. R Foundation for Statistical Computing. R: A Language and Environment for Statistical Computing. Vienna: R Foundation for Statistical Computing; 2008 [Google Scholar]


