Abstract
Feeding bile acids (BAs) to rodents has been used to study BA signaling and toxicity in vivo. However, little is known about the effect of feeding BAs on the concentrations of BAs in serum and liver as well as the dose of the fed BAs that causes liver toxicity. The present study was designed to investigate the relative hepatotoxicity of individual BAs by feeding mice cholic acid (CA), chenodeoxycholic acid (CDCA), deoxycholic acid (DCA), lithocholic acid (LCA), or ursodeoxycholic acid (UDCA) at concentrations of 0.01, 0.03, 0.1, 0.3, 1.0, or 3% in their diet for 7 days. The data demonstrate that (1) the ability of the fed BAs to produce hepatotoxicity is UDCA<CA<CDCA<DCA<LCA; (2) the lowest concentration of each BA in the feed that causes hepatotoxicity in mice is CA and CDCA at 0.3%, DCA at 0.1%, and LCA at 0.03%; (3) BA feeding results in a dose-dependent increase in the total serum BA concentrations but had little effect on liver total BA concentrations; (4) hepatotoxicity of the fed BAs does not simply depend on the concentration or hydrophobicity of total BAs in the liver; and (5) liver BA-conjugation enzymes are saturated by feeding UDCA at concentrations higher than 0.3%. In conclusion, the findings of the present study provide guidance for choosing the feeding concentrations of BAs in mice and will aid in interpreting BA hepatotoxicity as well as BA-mediated gene regulation.
Keywords: bile acid, dose-response, hepatotoxicity
Bile acids (BAs) are synthesized from cholesterol in the liver and further metabolized by bacteria in the intestine. In humans, the primary BAs are cholic acid (CA) and chenodeoxycholic acid (CDCA). However, in mice, CA, CDCA, α-muricholic acid (αMCA), and β-muricholic acid (βMCA) are the primary BAs (Chiang, 2002; Hofmann and Hagey, 2008). In liver, BAs can undergo conjugation with taurine, glycine, sulfate, and glucuronic acid as well as P450-mediated oxidations (Deo and Bandiera, 2008). In intestine, bacterial enzymes are capable of deconjugation, dehydroxylation, epimerization, and oxidation of BAs. The two major secondary BAs, namely deoxycholic acid (DCA) and lithocholic acid (LCA), are formed by 7-dehydroxylation of CA and CDCA, respectively, by intestinal bacteria. Ursodeoxycholic acid (UDCA) is a primary BA in some mammals (e.g., bear, beaver, and nutria) and has been used to treat cholesterol gallstones, primary biliary cirrhosis, and cholestasis of pregnancy (Glantz et al., 2005; Hofmann and Hagey, 2008).
BAs are involved in several important functions in liver and intestine. BAs facilitate the elimination of cholesterol from liver into bile and promote the absorption of lipids and lipid-soluble vitamins from the intestine. Within the last decade, BAs have been found to be important signaling molecules in regulating the homeostasis of BAs, cholesterol, glucose, and energy via activation of a number of receptors. However, individual BAs differ markedly in their potency to produce these various effects. For example, the potency of BAs to activate farnesoid X receptor is CDCA>DCA>LCA>CA (Parks et al., 1999), to activate pregnane X receptor is DCA>LCA>CDCA (Xie et al., 2001), to activate liver X receptor alpha is CA>LCA>DCA>CDCA (Song et al., 2000), to activate vitamin D receptor is LCA>CDCA>DCA>CA (Makishima et al., 2002), and to activate G protein coupled bile acid receptor 1 is LCA>DCA>CDCA>CA (Sato et al., 2008).
BAs have been reported to induce cell injury through many mechanisms, such as damage to the plasma membrane, oxidative stress, apoptosis, and inflammation (Allen et al., 2011; Perez and Briz, 2009). Generally, the hepatotoxicity of BAs is considered to be associated with their degree of hydrophobicity (Billington et al., 1980; Palmer, 1972). In regard to the magnitude of hydrophobicity of BAs, the order is UDCA<CA<CDCA<DCA<LCA (Heuman, 1989; Thomas et al., 2008). Thus, the order of BA toxicity should also be UDCA<CA<CDCA<DCA<LCA. However, feeding DCA caused more hepatotoxicity in rats than feeding the same dose of LCA (Delzenne et al., 1992; Tsuda et al., 1984), suggesting that the hepatotoxicity caused by feeding BAs does not necessarily depend on the degree of hydrophobicity of the fed BAs. This is possibly because the fed BAs are metabolized by the liver and intestinal bacteria (Wang et al., 2003; Zhang and Klaassen, 2010).
Recently, feeding various BAs to rodents has been used to study BA signaling and toxicity. However, little is known regarding how to choose appropriate concentrations of BAs in the feed that do not produce hepatotoxicity. In the present study, male C57BL/6 mice were subjected to a diet containing either a primary BA (CA or CDCA), a secondary BA (DCA or LCA), or a therapeutic BA (UDCA) at concentrations of 0.01, 0.03, 0.1, 0.3, 1.0, or 3% (wt/wt). The purpose of this study is to investigate systematically the dose-dependent effects of feeding BAs on liver injury as well as the concentrations of BAs in serum and liver.
MATERIALS AND METHODS
Chemicals.
CA, CDCA, DCA, LCA, and UDCA were purchased from Sigma-Aldrich Chemical Co. (St Louis, MO).
BA-supplemented diets.
Pelleted mouse feed (Teklad Rodent Diet #8604; Harlan Teklad, Madison, WI) was ground into a fine powder. CA, CDCA, and DCA were granular and thus were ground into a fine powder using a mortar and pestle. Each BA was thoroughly mixed with the ground feed using a Hobart food mixer (Hobart Corporation, Troy, OH) to obtain the desired concentrations in the feed.
Animal experiments.
Male C57BL/6 mice (22 ± 2 g) at 8 weeks of age were purchased from Charles River Laboratories, Inc. (Wilmington, MA). Mice were randomly grouped into control and BA-treated groups with five mice per group. The mice were housed in an American Animal Associations Laboratory Animal Care accredited facility. Mice were housed with a 12:12-h light:dark cycle and provided chow and water ad libitum. Each mouse was housed in a single cage and acclimated to the housing facility as well as ground control rodent diet in a bowl for 1 week. The diet was then changed to those supplemented with various percentages of BAs, including CA, CDCA, and DCA at final concentrations of 0.03, 0.1, 0.3, or 1% (wt/wt), LCA at 0.01, 0.03, 0.1, 0.3, or 1% (wt/wt), or UDCA at 0.1, 0.3, 1.0, or 3% (wt/wt) in the diet. The BA-supplemented diets (40 g) were added to a bowl in each mouse cage daily, and the remaining feed from the previous day was discarded. Cages were replaced daily to minimize contamination of feed with urine and feces. After 7 days on these diets, serum samples were collected and stored at 4°C for biochemical analysis. Livers were removed, frozen in liquid nitrogen, and stored at −80°C.
Biochemical analysis.
Serum alanine aminotransferase (ALT) activities were quantified by an enzymatic colorimetric assay using a commercial assay kit (Stanbio, Boerne, TX).
BA extraction and quantification.
Serum BA extraction and quantification were described previously (Alnouti et al., 2008). Liver BA concentrations were quantified by a recent method using liquid chromatography-tandem mass spectrometry (Zhang and Klaassen, 2010).
Statistics.
Differences between multiple groups were analyzed by one-way ANOVA followed by Duncan’s post hoc test. Statistical significance was considered at p < 0.05.
RESULTS
Survival, Body Weight, and Liver Weight
The survival of mice fed various BAs at multiple concentrations in their diets for 1 week is shown in Table 1. In mice fed BAs for 1 week, 1% CDCA, DCA, and LCA were lethal, whereas 1% CA was not lethal. In contrast, mice survived from all concentrations of UDCA, including the high concentration of 3%.
TABLE 1.
Survival of Mice Fed Bile Acids at Various Concentrations in the Feed for 1 Week
| Concentrations (wt/wt%) | CA | CDCA | DCA | LCA | UDCA |
| 0.01 | — | — | — | 5/5 | — |
| 0.03 | 5/5 | 5/5 | 5/5 | 5/5 | — |
| 0.1 | 5/5 | 5/5 | 5/5 | 5/5 | 5/5 |
| 0.3 | 5/5 | 5/5 | 5/5 | 5/5 | 5/5 |
| 1.0 | 5/5 | 0/5 | 0/5 | 0/5 | 5/5 |
| 3.0 | — | — | — | — | 5/5 |
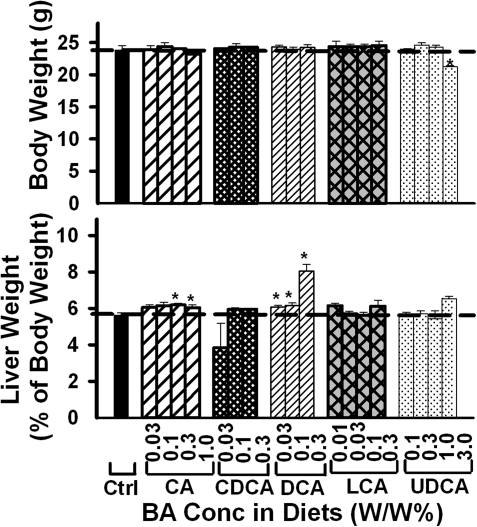
Generally, feeding BAs had little effect on body weight of mice (Fig. 1), except 3% UDCA in the diet decreased body weight about 10%. The relative liver/body weight of mice was increased by feeding 0.3 and 1% CA (about 8%) as well as feeding 0.03, 0.1, and 0.3% DCA (8, 9, and 32%, respectively). In contrast, feeding CDCA, LCA, and UDCA did not alter the relative liver/body weight of mice.
FIG. 1.
Body weight and relative liver weight of mice fed five BAs (CA, CDCA, DCA, LCA, or UDCA) at concentrations of 0.01, 0.03, 0.1, 0.3 1.0, or 3% in the diets for 1 week. Data are presented as mean ± SEM (n = 5). Asterisks represent statistically significant differences (p < 0.05) between control and treatment groups.
Serum ALT
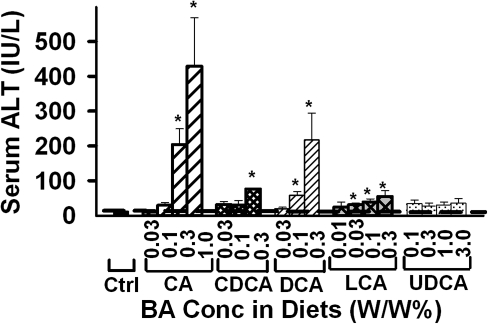
Serum ALT activity was quantified to determine the hepatotoxicity of the various BAs fed to mice (Fig. 2). Feeding CA, CDCA, DCA, and LCA resulted in a dose-dependent increase in serum ALT activity in mice. The lowest concentration needed to significantly increase serum ALT activity was: 0.3% for CA, 0.3% for CDCA, 0.1% for DCA, and 0.03% for LCA. Interestingly, feeding any concentration of UDCA did not increase serum ALT activity in mice.
FIG. 2.
Serum ALT activity in mice fed various BA-supplemented diets for 1 week. Data are presented as mean ± SEM (n = 5). Asterisks represent statistically significant differences (p < 0.05) between control and treatment groups.
Total BA Concentrations in Serum and Liver
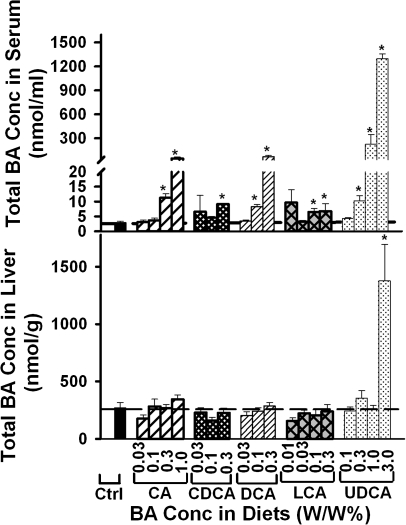
Serum and liver total BA concentrations were quantified to determine the concentration of BAs in serum and liver that resulted in hepatotoxicity (Fig. 3). Dose-dependent increases in the concentrations of total BAs in serum were observed when feeding CA, DCA, or UDCA but not CDCA or LCA. Significant increases in the concentrations of total BAs in serum were observed when feeding CA, CDCA, or DCA at 0.3% or above or feeding DCA or LCA at 0.1% or above. In contrast, feeding CA, CDCA, DCA, or LCA at any of the concentrations did not increase the total BA concentrations in liver. Whereas feeding 3% UDCA quadrupled the total BA concentrations in liver, feeding UDCA at 1% or below had little effect on the total BA concentrations in liver.
FIG. 3.
Total BA concentrations in the serum and livers of mice fed five BAs (CA, CDCA, DCA, LCA, or UDCA) at concentrations of 0.01, 0.03, 0.1, 0.3 1.0, or 3% in the diets for 1 week. Data are presented as mean ± SEM (n = 5). Asterisks represent statistically significant differences (p < 0.05) between control and treatment groups.
Individual BA Concentrations in Serum
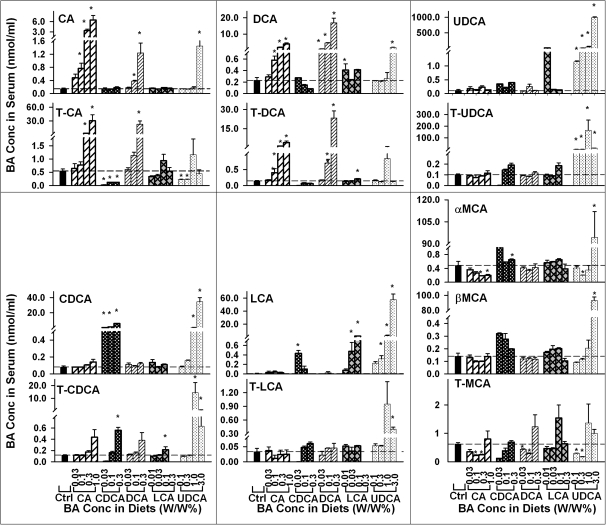
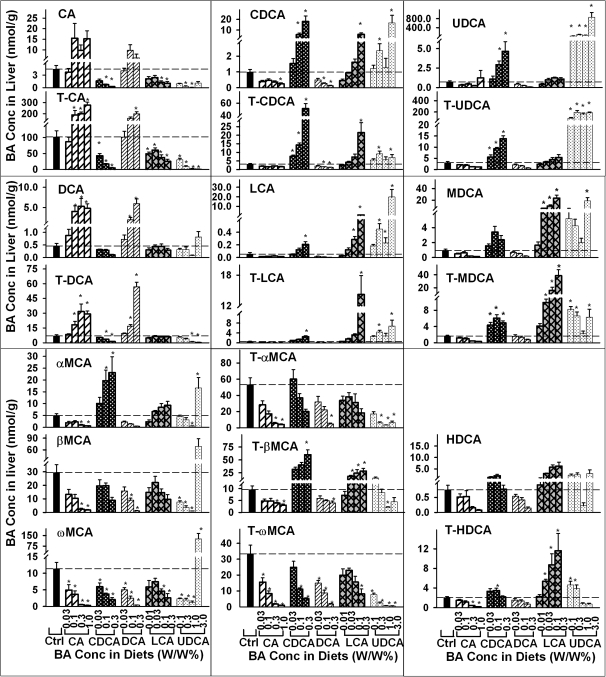
To further determine the effect of feeding BAs on serum BAs, the concentrations of individual BAs in serum were quantified and are shown as Figure 4. Feeding CA at 0.1, 0.3, or 1% dose dependently increased serum CA concentrations about 4-, 21-, and 42-fold, respectively. Feeding 0.3 and 1% CA significantly increased serum taurocholic acid (T-CA) about 4- and 54-fold, respectively. Feeding CA at 0.1, 0.3, and 1% dose dependently increased serum DCA concentrations about 1.54-, 6.94-, and 16-fold, respectively. In addition, feeding CA at 0.3 and 1% significantly increased serum taurodeoxycholic acid (T-DCA) concentration. Feeding various concentrations of CA had little effect on serum concentrations of CDCA, LCA, and UDCA as well as their taurine conjugates. Feeding CA at 0.3 or 1% significantly decreased serum αMCA concentration. In addition, feeding CA at 0.1 and 0.3% significantly decreased serum concentration of tauromuricholic acid (T-MCA).
FIG. 4.
Concentrations of individual BAs in serum of mice fed five BAs (CA, CDCA, DCA, LCA, or UDCA) at concentrations of 0.01, 0.03, 0.1, 0.3 1.0, or 3% in the diets for 1 week. Data are presented as mean ± SEM (n = 5). Asterisks represent statistically significant differences (p < 0.05) between control and treatment groups.
Feeding CDCA at 0.03, 0.1, and 0.3% dose dependently increased serum CDCA about 8-, 15-, and 69-fold, respectively. Feeding 0.3% CDCA significantly increased serum taurochenodeoxycholic acid (T-CDCA) about threefold. Feeding 0.1% CDCA significantly increased the concentrations of LCA but not T-LCA in serum. Feeding CDCA at all concentrations significantly decreased serum T-CA concentration. Feeding 0.3% CDCA significantly increased serum αMCA concentration. In addition, feeding CDCA tended to, but not significantly, increase serum βMCA concentration.
Feeding DCA not only resulted in a dose-dependent increase in serum concentrations of DCA and T-DCA but also increased the serum concentrations of CA and T-CA. Feeding 0.03% DCA significantly increased serum DCA concentration about threefold. Feeding 0.1 and 0.3% DCA significantly increased serum concentrations of DCA (19- and 73-fold) and T-DCA (4- and 162-fold). Feeding 0.1 and 0.3% DCA significantly increased serum concentration of CA. In addition, feeding 0.3% DCA significantly increased serum concentrations of T-CA (39-fold). In contrast, feeding DCA had little effect on the serum concentrations of CDCA, LCA, and UDCA as well as their taurine conjugates. Feeding 0.03 and 0.1% DCA significantly decreased serum T-MCA, whereas feeding 0.3% DCA tended to, but not significantly, increase serum T-MCA.
Feeding 0.03% LCA tended to, but not significantly, increase serum concentration of LCA about 67-fold. Feeding LCA at 0.1 and 0.3% dose dependently increased the concentrations of LCA in serum about 225- and 782-fold, respectively. In contrast, feeding LCA had little effect on the concentration of T-LCA in serum. Feeding 0.3% LCA significantly increased the concentration of T-CDCA about twofold. Feeding LCA had little effect on serum concentrations of CA or T-CA. In contrast, feeding LCA at 0.1% significantly increased serum DCA concentration and feeding LCA at 0.3% significantly increased serum T-DCA concentration. Feeding LCA at the tested concentrations had little effect on the concentrations of αMCA, βMCA, or T-MCA.
Feeding UDCA resulted in a dose-dependent increase in the concentrations of UDCA, LCA, and CDCA in serum. Feeding UDCA at 0.1, 0.3, 1.0, and 3% significantly increased serum concentration of tauroursodeoxycholic acid (T-UDCA) but not in a dose-dependent manner. Feeding 1.0 and 3% UDCA significantly increased serum concentrations of CDCA and T-CDCA. Feeding UDCA at 0.3% or above significantly increased the concentration of LCA in serum. Feeding 3% UDCA also significantly increased serum concentration of T-LCA. Compared with mice fed 1% UDCA, mice fed 3% UDCA had a lower increase in serum concentrations of T-UDCA and T-CDCA. In addition, feeding 3% UDCA significantly increased serum concentrations of CA, DCA, αMCA, and βMCA.
Individual BA Concentrations in Liver
The concentrations of individual BAs in livers of mice fed various BAs were also quantified (Fig. 5). Feeding 0.1, 0.3, and 1% CA tended to, but not significantly, increase CA concentration (about twofold to fourfold). Feeding CA at 0.1, 0.3, and 1% significantly increased T-CA concentrations about twofold to fourfold in mouse livers. Feeding CA also increased the liver concentrations of DCA and T-DCA 2- to 11-fold and onefold to fivefold, respectively. In contrast, feeding CA had little effect on the concentrations of LCA, UDCA, murideoxycholic acid (MDCA), or their taurine conjugates. Feeding 1% CA significantly decreased liver concentration of CDCA. Feeding 0.3 and 1% CA significantly decreased αMCA, βMCA, tauro-α-muricholic acid (T-αMCA), tauro-β-muricholic acid (T-βMCA), and taurohyodeoxycholic acid (T-HDCA). In addition, feeding CA significantly decreased the concentrations of ω-muricholic acid (ωMCA) and tauro-ω-muricholic acid (T-ωMCA).
FIG. 5.
Concentrations of individual BAs in livers of mice fed five BAs (CA, CDCA, DCA, LCA, or UDCA) at concentrations of 0.01, 0.03, 0.1, 0.3 1.0, or 3% in the diets for 1 week. Data are presented as mean ± SEM (n = 5). Asterisks represent statistically significant differences (p < 0.05) between control and treatment groups.
Feeding 0.03% CDCA tended to, but not significantly, increase liver concentration of CDCA (about 60%). In contrast, feeding 0.03% CDCA significantly increased liver concentration of T-CDCA (about 100%). Feeding 0.1 and 0.3% CDCA dose dependently increased the liver concentrations of CDCA (4- and 17-fold, respectively) and T-CDCA (3- and 15-fold, respectively). Feeding CDCA also resulted in a dose-dependent increase in the concentrations of LCA, T-LCA, UDCA, T-UDCA, αMCA, and T-βMCA. Feeding 0.3% CDCA significantly increased the liver concentrations of LCA and T-LCA about twofold and fourfold, respectively. Feeding CDCA at 0.03, 0.1, and 0.3% significantly increased liver concentration of tauromurideoxycholic acid (T-MDCA). In addition, feeding 0.1% CDCA significantly increased liver concentration of T-HDCA. In contrast, feeding 0.1 and 0.3% CDCA significantly decreased the concentrations of CA, T-CA, T-DCA, ωMCA, and T-ωMCA.
Feeding 0.03% DCA tended to, but not significantly, increase the concentrations of DCA and T-DCA in livers of mice. Feeding 0.1 and 0.3% DCA dose dependently increased the concentrations of DCA (threefold and ninefold, respectively) and T-DCA (2- and 14-fold, respectively). Feeding 0.1% DCA tended to, but not significantly, increase the concentrations of CA and T-CA. Feeding 0.3% DCA tended to increase CA concentration and significantly increased T-CA concentration. In contrast, feeding DCA at 0.1% or above decreased the concentrations of CDCA, T-CDCA, βMCA, ωMCA, and T-ωMCA. In addition, feeding 0.3% DCA significantly decreased T-αMCA and T-βMCA.
Feeding LCA tended to increase liver concentrations of LCA, T-LCA, CDCA, T-CDCA, MDCA, T-MDCA, hyodeoxycholic acid, and T-HDCA in a dose-dependent manner. Feeding LCA at 0.1 and 0.3% significantly increased liver concentration of LCA. Feeding 0.3% LCA significantly increased liver concentration of T-LCA, CDCA, and T-CDCA. Feeding LCA at 0.03% or above significantly increased the liver concentrations of MDCA, T-MDCA, T-βMCA, and T-HDCA. In contrast, feeding LCA tended to result in a dose-dependent decrease in the concentrations of CA, T-CA, ωMCA, and T-ωMCA in livers of mice.
Feeding mice 0.1, 0.3, 1.0, and 3% UDCA increased liver concentrations of UDCA about 42- to 194-fold and T-UDCA 25- to 63-fold. Feeding UDCA at 0.3 and 3% significantly increased liver concentrations of CDCA, T-CDCA, LCA, and T-LCA. Feeding UDCA at 0.1% or above significantly increased the concentration of MDCA and T-MDCA. In contrast, feeding UDCA at 0.3 and 1% slightly decreased the concentration of CA. Feeding UDCA at 1% or above significantly decreased the liver concentration of T-CA. Feeding UDCA at 1.0 and 3% significantly decreased the concentration of T-DCA but not DCA. Feeding 1% UDCA significantly decreased, whereas feeding 3% UDCA markedly increased the concentration of αMCA. Feeding UDCA at 1% or lower decreased, whereas feeding UDCA at 3% increased the concentrations of βMCA and ωMCA. Feeding UDCA tended to dose dependently decrease the concentrations of T-αMCA, T-βMCA, and T-ωMCA in livers of mice.
Hydrophobicity Index of Total BAs in Liver
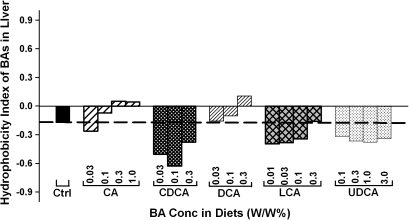
Hydrophobicity indices of individual BAs as well as total BAs in livers of mice were calculated according to the method of Heuman (1989). As shown in Figure 6, the hydrophobicity indices of the total BAs in livers of mice differed markedly when fed various BAs. Feeding CA or DCA resulted in a dose-dependent increase in the hydrophobicity indices of the total BAs in the livers of mice. In contrast, feeding CDCA, LCA, and UDCA decreased the hydrophobicity indices of the liver total BAs. Feeding CDCA decreased the hydrophobicity of liver BAs more than feeding LCA and UDCA.
FIG. 6.
The hydrophobicity indices of total BAs in livers of mice fed five BAs (CA, CDCA, DCA, LCA, or UDCA) at concentrations of 0.01, 0.03, 0.1, 0.3 1.0, or 3% in the diets for 1 week.
DISCUSSION
The present study systematically investigated the relative hepatotoxicity of five BAs, including primary BAs (CA and CDCA), secondary BAs (DCA and LCA), and one therapeutic BA (UDCA). Serum ALT activity is a traditional biochemical index of liver function and is used clinically for diagnosis of liver injury. According to the increase in serum ALT activity, the lowest concentration of CA and CDCA in the feed that causes hepatotoxicity is 0.3%, whereas it is 0.1% for DCA and 0.03% for LCA (Fig. 2). Feeding UDCA at any of the concentrations did not increase serum ALT activity. In addition to serum ALT activity, serum BA concentrations are also proposed to be a biological marker for hepatotoxicity (Lucangioli et al., 2009; Walters, 2010). Serum BA concentration has even been suggested to be a more sensitive and accurate indicator of liver function than serum ALT (Ambros-Rudolph et al., 2007; Azer et al., 1997). BA feeding resulted in a dose-dependent increase in the concentrations of the fed BA in serum of mice. In contrast, the concentration of total BAs in serum increased only in mice fed high doses of BAs. To increase serum total BA concentrations, mice needed to be fed CA, CDCA, and UDCA at 0.3%, whereas DCA and LCA only required 0.1% (Fig. 3). Histopathological examination of the liver indicated that feeding the highest dose of CA (1%), CDCA (0.3%), or UDCA (3%) had little effect, whereas feeding DCA or LCA at the highest concentration (0.3%) caused random cell swelling and death (data not shown). In addition, the survival study showed that mice fed 1% CDCA died within 3–5 days, whereas all mice fed 1% CA survived at least 7 days, indicating that CA is less toxic than CDCA (Table 1). Taken together, the order for these five BAs to cause hepatotoxicity is UDCA<CA<CDCA<DCA<LCA.
Contrary to serum total BA concentrations, feeding BAs, even at hepatotoxic concentrations, have little effect on the total BA concentrations in livers of mice. For example, feeding CA at all doses (0.03, 0.1, 0.3, and 1%) failed to increase the total BA concentrations in livers of mice. The exception is feeding 3% UDCA, which markedly increased the total BA concentration in livers of mice (Fig. 3). An increase in the total BA concentrations in liver is thought to be a major feature of cholestatic liver diseases (Fischer et al., 1996). However, the present study shows that hepatotoxicity induced by feeding BAs is not due to accumulation of total BAs in livers. Taken together, feeding BAs do not necessarily increase liver total BA concentrations, and hepatotoxicity induced by feeding BAs is not related to the total BA concentrations in livers.
Feeding BAs may suppress BA synthesis in liver. After feeding BAs, the messenger RNA expression of BA-synthetic enzymes, such as Cyp7a1 and 8b1, are suppressed markedly in livers of mice (Zhang and Klaassen, 2010). In the present study, feeding CA and DCA at high concentrations decreased the concentrations of both conjugated and unconjugated MCAs (αMCA and βMCA), suggesting that feeding CA and DCA may suppress the alternative pathway of BA synthesis in livers of mice. In addition, feeding CDCA and LCA at high concentrations (0.1 and 0.3%) decreased the concentrations of CA and T-CA, suggesting that feeding CDCA and LCA may suppress the classic pathway of BA synthesis in livers of mice.
During BA feeding, the fed BAs are metabolized by intestinal bacteria and hepatic enzymes. The fed primary BAs (CA and CDCA) can be metabolized by bacteria in the intestine to form their corresponding secondary BAs (DCA and LCA). Feeding CA at 0.1% or above in the diet increased the concentration of DCA in the liver and feeding 0.3% CDCA increased the concentration of LCA in the liver. After feeding BAs, the fed secondary BAs (DCA and LCA) can be “repaired” by enzymes in the liver to form their corresponding primary BAs (CA and CDCA). The present study also shows that feeding DCA and LCA at 0.3% in the diet increased the liver concentrations of T-CA and T-CDCA, respectively (Fig. 5).
Feeding BAs may alter the hepatic uptake of BAs. Feeding DCA, CDCA, and LCA tended to increase the liver concentrations of DCA, CDCA, and LCA, respectively, in a dose-dependent manner. In contrast, feeding CA at higher concentrations (0.1, 0.3, and 1%) similarly increased the concentrations of CA and DCA. It is possible that CA, being more hydrophilic than DCA, CDCA, and LCA, requires BA transporters for uptake into liver. Oatp1b2 has been shown to transport unconjugated CA into livers of mice (Csanaky et al., 2011). It is likely that Oatp1b2 is saturated by high doses of CA and thus feeding CA does not result in a dose-dependent increase in the concentration of CA in the liver.
It is generally accepted that the toxicity of BAs is related to their hydrophobicity. The order of hydrophobicity of BAs is UDCA<CA<CDCA<DCA<LCA (Perez and Briz, 2009), which is the exact order of the toxicity observed in the present study. Thus, it might appear that feeding hydrophobic BAs may increase the hydrophobicity of total BAs in liver and thus cause liver toxicity. Surprisingly, feeding CA and DCA dose dependently increased but feeding CDCA, LCA, and UDCA decreased the hydrophobicity indices of total BAs in livers of mice (Fig. 6). The marked difference in the hydrophobicity indices between total BAs in livers and the individual fed BAs is due to the metabolism of the fed BAs by the liver and intestinal bacteria. For example, feeding CA increased the concentration of a hydrophobic BA (DCA) but decreased the concentrations of hydrophilic BAs (αMCAs, βMCAs, and ωMCAs) and thus increased the hydrophobicity indices of total BAs in liver (Fig. 5). Taken together, the hepatotoxicity of the fed BAs does not necessarily correlate with the hydrophobicity of total BAs in liver.
UDCA has been used to treat cholesterol gallstones, primary cirrhosis, and cholestasis of pregnancy (Glantz et al., 2005; Hofmann and Hagey, 2008). Before the discovery of the therapeutic use of UDCA, CDCA was used to induce gradual dissolution of cholesterol gallstones (Danzinger et al., 1972). UDCA replaced CDCA for cholesterol gallstone dissolution because CDCA induced a dose-related elevation in plasma transaminase levels, whereas UDCA appeared to be devoid of hepatotoxicity (Howard and Fromm, 1999). Similar to that in humans, the present study demonstrates that CDCA is more toxic than UDCA in mice. CDCA and UDCA share similar metabolic pathways in mice (Zhang and Klaassen, 2010), and one of their metabolites, LCA, has been proposed to be one of the reasons that CDCA causes hepatotoxicity (Hofmann, 2004). The present study shows that feeding 0.3% UDCA increased liver concentrations of LCA and T-LCA in mice more than did feeding 0.3% CDCA or LCA (Fig. 5). Thus, the difference in toxicity between CDCA and UDCA is not likely due to their hydrophobic metabolites. Feeding 0.3% UDCA increased the liver concentration of T-UDCA much higher than feeding 0.1% UDCA, whereas feeding 0.3, 1, and 3% UDCA resulted in a similar increase in liver concentrations of T-UDCA. This suggests that BA-conjugating enzymes in liver may be saturated by feeding UDCA at concentrations higher than 0.3%.
In summary, the findings of the present study provide guidance for choosing the feeding concentrations of BAs in mice and will aid in interpreting BA hepatotoxicity as well as BA-mediated gene regulation. The lowest concentration of each BA in the feed that causes hepatotoxicity in mice is CA and CDCA at 0.3%, DCA at 0.1%, and LCA at 0.03%. The dose of CA that increases DCA concentration in the liver is 0.1%, whereas it is 0.3% for DCA, CDCA, and LCA to increase the liver concentrations of CA, LCA, and CDCA, respectively. In addition, hepatotoxicity of the fed BAs does not simply depend on the concentration or hydrophobicity of total BAs in the liver.
FUNDING
National Institutes of Health (ES009649, ES009716, RR021940).
Acknowledgments
The authors thank the members in the laboratory of C.D.K. for tissue collection and manuscript reviewing. Special thanks to Dr Iván Csanaky and Dr Cheryl Rockwell for assistance in BA extraction and messenger RNA quantification. The authors also thank Drs Bryan Copple, Grace Guo, Bruno Hagenbuch, and Hartmut Jaeshke for their critical reading and suggestions on revising the manuscripts.
References
- Allen K, Jaeschke H, Copple BL. Bile acids induce inflammatory genes in hepatocytes: a novel mechanism of inflammation during obstructive cholestasis. Am. J. Pathol. 2011;178:175–186. doi: 10.1016/j.ajpath.2010.11.026. [DOI] [PMC free article] [PubMed] [Google Scholar]
- Alnouti Y, Csanaky IL, Klaassen CD. Quantitative-profiling of bile acids and their conjugates in mouse liver, bile, plasma, and urine using LC-MS/MS. J. Chromatogr. B Analyt. Technol. Biomed. Life Sci. 2008;873:209–217. doi: 10.1016/j.jchromb.2008.08.018. [DOI] [PMC free article] [PubMed] [Google Scholar]
- Ambros-Rudolph CM, Glatz M, Trauner M, Kerl H, Mullegger RR. The importance of serum bile acid level analysis and treatment with ursodeoxycholic acid in intrahepatic cholestasis of pregnancy: a case series from central Europe. Arch. Dermatol. 2007;143:757–762. doi: 10.1001/archderm.143.6.757. [DOI] [PubMed] [Google Scholar]
- Azer SA, Klaassen CD, Stacey NH. Biochemical assay of serum bile acids: methods and applications. Br. J. Biomed. Sci. 1997;54:118–132. [PubMed] [Google Scholar]
- Billington D, Evans CE, Godfrey PP, Coleman R. Effects of bile salts on the plasma membranes of isolated rat hepatocytes. Biochem. J. 1980;188:321–327. doi: 10.1042/bj1880321. [DOI] [PMC free article] [PubMed] [Google Scholar]
- Chiang JY. Bile acid regulation of gene expression: roles of nuclear hormone receptors. Endocr. Rev. 2002;23:443–463. doi: 10.1210/er.2000-0035. [DOI] [PubMed] [Google Scholar]
- Csanaky IL, Lu H, Zhang Y, Ogura K, Choudhuri S, Klaassen CD. Organic anion-transporting polypeptide 1b2 (Oatp1b2) is important for the hepatic uptake of unconjugated bile acids: studies in Oatp1b2-null mice. Hepatology. 2011;53:272–281. doi: 10.1002/hep.23984. [DOI] [PMC free article] [PubMed] [Google Scholar]
- Danzinger RG, Hofmann AF, Schoenfield LJ, Thistle JL. Dissolution of cholesterol gallstones by chenodeoxycholic acid. N. Engl. J. Med. 1972;286:1–8. doi: 10.1056/NEJM197201062860101. [DOI] [PubMed] [Google Scholar]
- Delzenne NM, Calderon PB, Taper HS, Roberfroid MB. Comparative hepatotoxicity of cholic acid, deoxycholic acid and lithocholic acid in the rat: in vivo and in vitro studies. Toxicol. Lett. 1992;61:291–304. doi: 10.1016/0378-4274(92)90156-e. [DOI] [PubMed] [Google Scholar]
- Deo AK, Bandiera SM. Identification of human hepatic cytochrome p450 enzymes involved in the biotransformation of cholic and chenodeoxycholic acid. Drug. Metab. Dispos. 2008;36:1983–1991. doi: 10.1124/dmd.108.022194. [DOI] [PubMed] [Google Scholar]
- Fischer S, Beuers U, Spengler U, Zwiebel FM, Koebe HG. Hepatic levels of bile acids in end-stage chronic cholestatic liver disease. Clin. Chim. Acta. 1996;251:173–186. doi: 10.1016/0009-8981(96)06305-x. [DOI] [PubMed] [Google Scholar]
- Glantz L, Avramovich A, Trembovler V, Gurvitz V, Kohen R, Eidelman LA, Shohami E. Ischemic preconditioning increases antioxidants in the brain and peripheral organs after cerebral ischemia. Exp. Neurol. 2005;192:117–124. doi: 10.1016/j.expneurol.2004.11.012. [DOI] [PubMed] [Google Scholar]
- Heuman DM. Quantitative estimation of the hydrophilic-hydrophobic balance of mixed bile salt solutions. J. Lipid Res. 1989;30:719–730. [PubMed] [Google Scholar]
- Hofmann AF. Detoxification of lithocholic acid, a toxic bile acid: relevance to drug hepatotoxicity. Drug Metab. Rev. 2004;36:703–722. doi: 10.1081/dmr-200033475. [DOI] [PubMed] [Google Scholar]
- Hofmann AF, Hagey LR. Bile acids: chemistry, pathochemistry, biology, pathobiology, and therapeutics. Cell. Mol. Life Sci. 2008;65:2461–2483. doi: 10.1007/s00018-008-7568-6. [DOI] [PMC free article] [PubMed] [Google Scholar]
- Howard DE, Fromm H. Nonsurgical management of gallstone disease. Gastroenterol. Clin. N. Am. 1999;28:133–144. doi: 10.1016/s0889-8553(05)70047-9. [DOI] [PubMed] [Google Scholar]
- Lucangioli SE, Castano G, Contin MD, Tripodi VP. Lithocholic acid as a biomarker of intrahepatic cholestasis of pregnancy during ursodeoxycholic acid treatment. Ann. Clin. Biochem. 2009;46:44–49. doi: 10.1258/acb.2008.008130. [DOI] [PubMed] [Google Scholar]
- Makishima M, Lu TT, Xie W, Whitfield GK, Domoto H, Evans RM, Haussler MR, Mangelsdorf DJ. Vitamin D receptor as an intestinal bile acid sensor. Science. 2002;296:1313–1316. doi: 10.1126/science.1070477. [DOI] [PubMed] [Google Scholar]
- Palmer RH. Bile acids, liver injury, and liver disease. Arch. Intern. Med. 1972;130:606–617. [PubMed] [Google Scholar]
- Parks DJ, Blanchard SG, Bledsoe RK, Chandra G, Consler TG, Kliewer SA, Stimmel JB, Willson TM, Zavacki AM, Moore DD, et al. Bile acids: natural ligands for an orphan nuclear receptor. Science. 1999;284:1365–1368. doi: 10.1126/science.284.5418.1365. [DOI] [PubMed] [Google Scholar]
- Perez MJ, Briz O. Bile-acid-induced cell injury and protection. World J. Gastroenterol. 2009;15:1677–1689. doi: 10.3748/wjg.15.1677. [DOI] [PMC free article] [PubMed] [Google Scholar]
- Sato H, Macchiarulo A, Thomas C, Gioiello A, Une M, Hofmann AF, Saladin R, Schoonjans K, Pellicciari R, Auwerx J. Novel potent and selective bile acid derivatives as TGR5 agonists: biological screening, structure-activity relationships, and molecular modeling studies. J. Med. Chem. 2008;51:1831–1841. doi: 10.1021/jm7015864. [DOI] [PubMed] [Google Scholar]
- Song C, Hiipakka RA, Liao S. Selective activation of liver X receptor alpha by 6alpha-hydroxy bile acids and analogs. Steroids. 2000;65:423–427. doi: 10.1016/s0039-128x(00)00127-6. [DOI] [PubMed] [Google Scholar]
- Thomas C, Pellicciari R, Pruzanski M, Auwerx J, Schoonjans K. Targeting bile-acid signalling for metabolic diseases. Nat. Rev. Drug Discov. 2008;7:678–693. doi: 10.1038/nrd2619. [DOI] [PubMed] [Google Scholar]
- Tsuda H, Masui T, Imaida K, Fukushima S, Ito N. Promotive effect of primary and secondary bile acids on the induction of gamma-glutamyl transpeptidase-positive liver cell foci as a possible endogenous factor for hepatocarcinogenesis in rats. Gann. 1984;75:871–875. [PubMed] [Google Scholar]
- Walters JR. Defining primary bile acid diarrhea: making the diagnosis and recognizing the disorder. Expert Rev. Gastroenterol. Hepatol. 2010;4:561–567. doi: 10.1586/egh.10.54. [DOI] [PubMed] [Google Scholar]
- Wang DQ, Tazuma S, Cohen DE, Carey MC. Feeding natural hydrophilic bile acids inhibits intestinal cholesterol absorption: studies in the gallstone-susceptible mouse. Am. J. Physiol. Gastrointest. Liver Physiol. 2003;285:G494–G502. doi: 10.1152/ajpgi.00156.2003. [DOI] [PubMed] [Google Scholar]
- Xie W, Radominska-Pandya A, Shi Y, Simon CM, Nelson MC, Ong ES, Waxman DJ, Evans RM. An essential role for nuclear receptors SXR/PXR in detoxification of cholestatic bile acids. Proc. Natl. Acad. Sci. U.S.A. 2001;98:3375–3380. doi: 10.1073/pnas.051014398. [DOI] [PMC free article] [PubMed] [Google Scholar]
- Zhang Y, Klaassen CD. Effects of feeding bile acids and a bile acid sequestrant on hepatic bile acid composition in mice. J. Lipid Res. 2010;51:3230–3242. doi: 10.1194/jlr.M007641. [DOI] [PMC free article] [PubMed] [Google Scholar]


