

Abstract
Despite reports of increasing non-medical prescription drug use, relatively few studies have systematically evaluated the prevalence and correlates of non-medical prescription drug use, particularly in populations that might be especially vulnerable (e.g., injection drug users [IDUs]). We examined factors associated with non-medical prescription drug use among a community-based cohort of current and former IDUs in Baltimore (The ALIVE Study). We conducted a cross-sectional analysis of data from cohort participants that responded to a survey that included questions on non-medical prescription drug use between 2005–06 (n=1320). Non-medical prescription drug use was considered to be use of any of the following: Opiates (Oxycontin, Percocet), Benzodiazepines or Clonidine, purchased on the street and taken orally within the last six months. Data on other covariates of interest (e.g., demographics, substance use, general health) was obtained through a standardized interview. The median age was 46 years; 66% were male, 85% were African-American. Twenty one percent reported any non-medical prescription drug use; 12% reported using more than one drug. Non-medical use of opiates was most common (17%). In multivariate analysis, non-medical prescription drug use was significantly associated with Caucasian race (prevalence ratio [PR]: 1.79), self-reported bodily pain (PR: 1.58), hazardous alcohol use (PR: 1.47), marijuana use (PR: 1.65), non-injection cocaine/heroin use (PR: 1.70), diverted use of buprenorphine (PR: 1.51) or methadone (PR: 2.51), and active injection drug use (PR: 3.50; p<0.05 for all). The association between bodily pain and non-medical prescription drug use was stronger among persons that were not using substances (marijuana, injecting drugs, snorting/smoking heroin, cocaine, using crack) as compared to those using these substances. The high prevalence of non-medical prescription drug use among this population warrants further research and action. Information on the risks of nonmedical prescription drug use especially overdose, should be incorporated into interventions targeted at IDUs.
Keywords: non-medical prescription drug use, poly-drug use, injection drug users, substance abuse, Baltimore
1. Introduction
Non-medical prescription drug use has been defined as, “…use without a prescription of the individual’s own or simply for the experience or feeling the drugs cause (SAMHSA, 2009). In recent years, non-medical prescription drug use has reached epidemic proportions in the United States. Data suggest that the incidence of non-medical use of prescription opioids alone increased from 628,000 in 1990 to 2.7 million in 2000 an increase of more than 400% (Sigmon, 2006). Data from the Substance Abuse and Mental Health Services Administration (SAMSHA) estimated that in 2009, there were 7.0 million (2.8 percent) persons aged 12 or older who reported non-medical prescription drug use in the past month (SAMHSA, 2009) representing a slight increase from 2008 (6.2 million or 2.5 percent) (SAMHSA, 2009). The increases in non-medical prescription drug use may be due in part to rising prescription rates of opioids for non–disease-based pain (Pawl, 2008) as well as increased availability on the street.
Non-medical use of prescription drugs can result in adverse health outcomes including respiratory distress, withdrawal symptoms, feelings of hostility, irregular heartbeat and in some extreme cases, death (NIDA, 2005; SAMHSA, 2007) and can have legal, economic and social costs. In 2002, it was estimated that non-medical prescription drug use cost the US $181 billion including both medical costs as well as law enforcement expenses (Davis & Johnson, 2008).
Non-medical prescription drug use has been characterized in college students (McCabe, 2008; McCabe, Teter, & Boyd, 2004), populations suffering from chronic pain (Kirsh & Smith, 2008), the general population (Blazer & Wu, 2009; Novak, Herman-Stahl, Flannery, & Zimmerman, 2009; SAMHSA, 2009) and vulnerable populations including sex workers(Surratt, Inciardi, & Kurtz, 2006); adolescent arrestees (Alemagno, Stephens, Shaffer-King, & Teasdale, 2009) and drug-dependent populations (Brands, Blake, Sproule, Gourlay, & Busto, 2004; Davis & Johnson, 2008; Fischer, et al., 2005; Fischer, Rehm, Patra, & Cruz, 2006; Green, Grimes Serrano, Licari, Budman, & Butler, 2009; Inciardi, Surratt, Kurtz, & Cicero, 2007; Obadia, Perrin, Feroni, Vlahov, & Moatti, 2001; Rosenblum, et al., 2007; Sigmon, 2006; Vlahov, et al., 2007). Among vulnerable populations including injection drug users (IDUs), the adverse health consequences of non-medical prescription drug use may worsen the already high burden of poverty, disease and social disadvantage. Further, among IDUs where polysubstance use may be common, the risk of drug overdose may be exacerbated by concomitant use of prescription drugs. The risk for overdose is further heightened given that some users perceive prescription drugs to be more pure, safe, respectable, legal and less likely to induce withdrawal symptoms than illicit drugs (Inciardi, et al., 2007). Some have even suggested that prescription drugs may be preferred by IDUs as there is a lower likelihood of getting arrested for possession (versus illicit opioids); the formulation is standard and provides consistent results; the effect is easier on the body and provides a false sense of well-being (Cicero, Inciardi, & Munoz, 2005; Firestone & Fischer, 2008).
We characterized the prevalence and correlates of non-medical prescription drug use in a cohort of former and current IDUs in Baltimore, Maryland, USA.
2. Methods
2.1 Study Population and Procedures
The study population derives from the AIDS Linked to the IntraVenous Experience (ALIVE) study, an ongoing, longitudinal study on the natural history of HIV infection among IDUs in Baltimore (Vlahov, et al., 1991). The study was approved by the Johns Hopkins University Institutional Review Board and all participants provided written informed consent. The initial recruitment for this study was conducted in 1988–1989; 2946 IDUs from the Baltimore metropolitan area were enrolled, 707 of whom were HIV-positive. Additional recruitment was done in subsequent years to replenish the cohort (1994–95, 433; 1998, 244; 2000, 51 and 2005–07, 537). Individuals have been followed semi-annually; at each visit, a questionnaire on drug use, sexual practices, health status is administered to the participants and blood is collected for serologic testing and repository storage.
From 1998 until July 2005, persons were not specifically queried about non-medical prescription drug use, but they were asked to report any other drug use beyond the drugs specifically included in the questionnaire (e.g., cocaine, heroin, crack, marijuana). These data revealed that many IDUs were using prescription drugs purchased on the street. In response, questions on non-medical prescription drug use were added to the standard questionnaire in July 2005. We included only prescription drugs that were most commonly mentioned in the prior 10 years. We present data from the first available study visit after July 2005. 1397 cohort members who were still in follow up in July 2005 were eligible for inclusion in the analysis (n=1397), 77 of whom were excluded due to missing data on key covariates of interest. We present data for the remaining 1320 subjects.
2.2 Instruments and measures
“Non-medical use of prescription drugs” was measured by asking respondents if they had purchased on the street and taken orally any of the following in the prior six months: narcotic analgesics (Oxycontin, Percocet), benzodiazepines (Klonipin, Valium, Ativan, Xanax), or Clonidine. We also asked about methamphetamine but as the prevalence of use was low (1.3% individuals ever reported), we excluded methamphetamine. Respondents were considered to have used prescription drugs for non-medical reasons if they answered yes to any of the above drugs or drug categories.
Exposure variables of interest were captured through questionnaires that were both interviewer-administered and through audio computer-assisted self interview (ACASI). Fixed characteristics of interest (e.g., age, gender and race) were captured at baseline. All other information was collected at the follow-up interview where information on non-medical prescription drug use was collected and reflected behaviors and perceptions in the prior six months. Information on health care utilization, including consistency of care from the same physician and emergency room visits, was captured through the interviewer-administered questionnaire. All information that was considered more sensitive was captured via ACASI including information on types and frequency of injection drug use (heroin, cocaine) and non-injection drug use (heroin, cocaine, marijuana, crack), alcohol use via a screening test: Alcohol Use Disorders Identification Test (AUDIT) (Saunders, Aasland, Babor, de la Fuente, & Grant, 1993), cigarettes as well as buprenorphine and methadone purchased on the street. Information on general health status, depressive symptoms, experienced bodily pain and self-perceived risk for HIV based on their drug use and sexual behaviors were also captured via ACASI. Pain was measured by asking respondents, “During the last 4 weeks, how much did pain interfere with your normal work (including work outside the home and housework)? This question is a validated item drawn from the Short Form Health Survey( SF-12) (Ware, Kosinski, & Keller, 1996). Depressive symptoms were measured using the Center for Epidemiological Studies-Depression Scale (CES-D) (Radloff, 1977). A cut-off of 23 (versus 16 that is typically used) was used to classify respondents as having depressive symptoms since the base rate of depression is expected to be higher in this population (Perdue, Hagan, Thiede, & Valleroy, 2003).
2.3 Statistical analysis
We first evaluated the prevalence of non-medical prescription drug use by correlates of interest. The outcome (non-medical prescription drug use) was analyzed as a count variable according to the number of prescription drugs (clonidine) or drug categories (opiates, benzodiazepines) reportedly used (values from 0 to 3). We used negative binomial regression with robust variance estimation to directly estimate prevalence ratios (PR). This method was used to account for excess zeroes (79% were zeroes) as well as the high prevalence of outcome (Gardner, Mulvey, & Shaw, 1995). Since the data is cross-sectional, coefficients are interpreted as prevalence ratios.
Variables were included in multivariate models if they were associated with the outcome variable at p<0.05. In addition, we included several demographic variables of interest (e.g., age, gender, race and income) regardless of statistical significance. In cases where more than one predictor of a theoretical construct was significant, predictors with the strongest point estimate were entered first into the multivariate model. Additionally, to further explore overlap between variables measuring the same theoretical construct, checks for collinearity were done by assessing the correlation between pairs of independent variables. No pairs were highly correlated (none with r>0.5). The final model was chosen based on a combination of variables deemed important a priori (e.g., demographics), statistical significance (p<0.05) and AIC values. We examined effect modification by substance use (injection frequency; non-injection drug use (snorting cocaine or heroin, crack use or smoking heroin); marijuana use; use of street methadone; use of street buprenorphine and depressive symptoms on the association between bodily pain and non medical use of prescription drugs by fitting regression models with interaction terms. Finally, sensitivity analyses were performed to determine if any of the observed associations differed when analyses were restricted to a particular drug class (e.g., opiates). All analyses were conducted using STATA (version 10, College Station, TX) (STATA, 2007).
3. Results
3.1 Participant characteristics
Characteristics of study participants (N=1320) are summarized in Table 1. The mean age was 46 (SD: 8 years; range: 19 – 69 years). Nearly 67% were male and 85% were African–American. Twenty-three percent had no legal income and one quarter reported having been homeless in the past 6 months. Nearly, 27% exhibited depressive symptoms. Twenty-eight percent were HIV positive. A quarter of participants reported having moderate or severe pain that interfered with daily activities. More than half reported that they perceived themselves to be at low risk for HIV based on their drug use and sexual behaviors. Fifty-six percent were actively injecting drugs; of these 33% were injecting daily. Eighty-five percent reported current smoking and 27% had evidence of hazardous alcohol use.
Table 1.
Characteristics of study population (n=1320)
| N=1320, % | |
|---|---|
| Demographics | |
| Age(years), Mean, SD, range | 46.3 (8.12), 19.6–68.8 |
| Gender | |
| Male | 876(66.4) |
| Female | 444(33.6) |
| Race/ethnicity | |
| African-American | 1115(84.5) |
| Caucasian | 154(11.7) |
| Other | 51(3.86) |
| Annual income (US dollars) | |
| No legal income | 306(23.2) |
| Less than 2500 | 477( 36.1) |
| 2500–4999 | 226( 17.1) |
| 5000 and above | 311(23.3) |
| Stability factors | |
| Homeless* | 325(24.6) |
| Incarcerated ≥7 days* | 220(16.7) |
| Emergency room visit* | 391(29.6) |
| Saw same physician 90% of the time* | 812(61.5) |
| Health status | |
| Depressive symptoms (CES-D≥23) | 349(26.4) |
| HIV positive | 374(28.3) |
| Bodily pain interferes with activity* | |
| Not at all | 645(48.9) |
| Little bit | 342(25.9) |
| Moderately | 184(13.9) |
| Highly | 149(11.3) |
| Self-reported general health status* | |
| Excellent | 131(9.92) |
| Very good | 326(24.7) |
| Good | 454(34.4) |
| Fair/poor | 409(31.0) |
| Perceived level of risk to self** | |
| Not risky | 670(51.0) |
| Slightly risky | 229(17.4) |
| Risky | 191(14.5) |
| Highly risky | 226(17.2) |
| Substance use | |
| Smoked cigarettes* | 1111(84.3) |
| Hazardous alcohol use(AUDIT ≥8) | 354(26.8) |
| Used marijuana* | 291(22.1) |
| Non injection cocaine/heroin/crack use* | 605(46.0) |
| Injection frequency* | |
| None | 612(44.0) |
| Less than daily | 325(23.4) |
| Daily or greater than daily | 455(32.7) |
| Use of buprenorphine purchased on the street* | 76(5.76) |
| Use of methadone purchased on the street* | 173(13.1) |
Abbreviations: SD, standard deviation; CES-D, Center for Epidemiological Studies-Depression Scale; AUDIT, Alcohol Use Disorders Identification Test
Refer to behaviors in the prior six months
Numbers do not add up because of missing values
3.2 Prevalence of non-medical prescription drug use and associated characteristics
A total of 276 respondents (20.9 %) reported non-medical prescription drug use in the prior 6 months. The most frequently used prescription drugs were opiates (Percocet and Oxycontin), reported by 17% of participants. Clonidine was reported by 11% of respondents and Benzodiazepines by 12%. Polydrug use was common with nearly 12 %( 157) respondents reporting use of more than one prescription drug (Figure 1).
Figure 1.
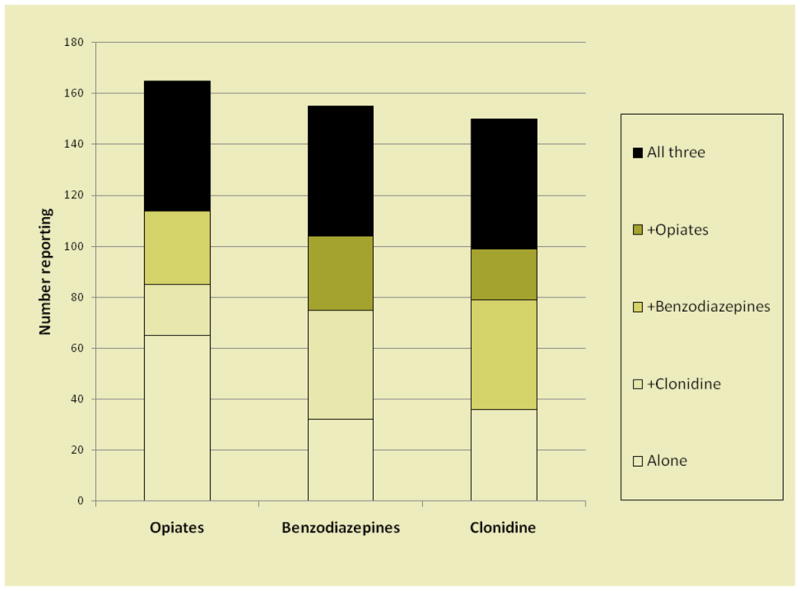
Number of persons reporting use of different combinations of prescription drugs. Opiates included Oxycontin and Percocet. Benzodiazepines included Klonipin, Valium, Ativan, Xanax.
Correlates of non medical prescription drug use are shown in Table 2. In the bivariate analysis, there were no statistically significant differences by gender or income. Older persons were significantly less likely to use prescription drugs than those aged 18–25 years. The prevalence of non-medical prescription drug use was significantly higher among Caucasians, those who reported within the prior six months being homeless, incarcerated for seven or more days and seeking care at the emergency room. Finally, the prevalence of non-medical prescription drug use was significantly higher among those who had evidence of depressive symptoms, self-reported bodily pain, poor general health, higher HIV risk perception as well as those who reported use of other substances in the prior six months. Visiting the same physician 90% of the time and being HIV positive were significantly associated with lower prevalence of non-medical prescription drug use.
Table 2.
Unadjusted and adjusted prevalence ratios of prescription drug abuse among 1320 respondents
| Unadjusted prevalence ratio (95% CI) | Adjusted prevalence ratio (95% CI) | |
|---|---|---|
| Demographics | ||
| Age (years) | ||
| 18–25 | 1 | 1 |
| 26–34 | 0.49 (0.27 – 0.89) | 1.13 (0.63 – 2.05) |
| 35–49 | 0.31 (0.11 – 0.51) | 1.32 (0.76 – 2.70) |
| >=50 | 0.19 (0.11 – 0.33) | 1.25 (0.69 – 2.25) |
| Female gender | 1.18 (0.92 – 0.52) | 1.12 (0.88 – 1.43) |
| Race | ||
| African-American | 1 | 1 |
| Caucasian | 3.22(2.53–4.10) | 1.79(1.32 – 2.42) |
| Other | 0.80(0.45 – 1.43) | 0.89(0.51 – 1.56) |
| Annual Income† | 0.96 (0.88 – 1.04) | 1.04 (0.97 – 1.11) |
| Stability factors | ||
| Homeless* | 2.88 (2.28 – 3.64) | 1.13 (0.87 – 1.46) |
| Incarcerated ≥7 days* | 1.71 (1.30 – 2.25) | 1.06 (0.81 – 1.39) |
| Emergency room visit* | 2.02 (1.59 – 2.57) | |
| Saw same physician 90% of the time* | 0.73 (0.58 – 0.93) | 1.03 (0.81 – 1.30) |
| Health status | ||
| Depressive symptoms (CES-D≥23) | 3.00(2.37 – 3.80) | 1.27 (0.99 – 1.63) |
| HIV positive | 0.65(0.48–0.89) | 0.91 (0.69 – 1.20) |
| Bodily pain interferes with activity | ||
| None | 1 | 1 |
| A little | 2.55 (1.88 – 3.47) | 1.77 (1.31 – 2.40) |
| Moderately | 2.60 (1.82 – 3.73) | 1.44(1.03 – 2.03) |
| Highly | 3.34 (2.36 – 4.73) | 1.58 (1.09 – 2.28) |
| Self reported general health status | ||
| Excellent | 1 | |
| Very good | 1.66 (0.92 – 3.02) | |
| Good | 1.80 (1.02 – 3.20) | |
| Poor | 2.37 (1.35 – 4.17) | |
| Perceived level of risk to self | ||
| Not risky | 1 | |
| Slightly risky | 2.05 (1.45 – 2.91) | |
| Risky | 2.76 (1.98 – 3.86) | |
| Highly risky | 2.94 (2.15 – 4.03) | |
| Substance abuse | ||
| Smoked cigarettes * | 1.94 (1.28 – 2.96) | |
| Hazardous alcohol use( AUDIT ≥8) | 2.55 (2.01 – 3.23) | 1.47 (1.16 – 1.87) |
| Used marijuana* | 3.18 (2.52 – 4.01) | 1.65 (1.31 – 2.09) |
| Non-injection cocaine/heroin/crack use* | 5.43 (4.01 – 7.35) | 1.70 (1.21 – 2.38) |
| Injection frequency* | ||
| None | 1 | 1 |
| Less than daily | 8.94 (5.52 – 14.45) | 3.76 (2.24 – 6.33) |
| Daily or greater than daily | 10.93 (6.90 – 17.30) | 3.50 (2.08 – 5.89) |
| Use of buprenorphine purchased on the street* | 4.38 (3.42 – 5.60) | 1.51 (1.15 – 1.99) |
| Use of methadone purchased on the street* | 5.61 (4.51 – 6.96) | 2.51 (1.99 – 3.16) |
Abbreviations: CES-D, Center for Epidemiological Studies-Depression Scale; AUDIT, Alcohol Use Disorders Identification Test
Income treated as an ordinal variable
Refer to behaviors in the prior six months
In multivariate analysis, non-medical prescription drug use remained more common among those who were Caucasian (PR: 1.79; 95% confidence interval [CI]: 1.32–2.42), had evidence of depressive symptoms (CESD score>=23; PR: 1.27; 95% CI: 0.99–1.63) and reported that pain interfered with their daily activities (PR for persons that reported that pain interfered highly with their activity vs. those where pain did not interfere at all: 1.58; 95% CI: 1.09–2.28). Non-medical prescription drug use also remained significantly associated with hazardous alcohol use (AUDIT score >=8; PR: 1.47; 95% CI: 1.16–1.87), marijuana use (PR: 1.65; 95% CI: 1.31–2.09), non-injection drug use( PR: 1.70; 95%CI: 1.21–2.38), active drug injection (PR for <daily injection versus no injection: 3.76; 95% CI: 2.24–6.33 and PR for ≥ daily injection vs. no injection: 3.50 times; 95% CI: 2.08–5.89), cocaine and heroin by non-injection routes (PR: 1.70; 95% CI: 1.21–2.38) as well as buprenorphine purchased on the street (PR: 1.51; 95% CI: 1.15–1.99) and methadone purchased on the street (PR: 2.51; 95% CI: 1.99–3.16). A number of variables (e.g., cigarette smoking, emergency room utilization, perceived overall level of risk and self-reported general health status) were dropped from the final model either because lack of statistical significance or collinearity with other variables. For example, the effect of perceived overall HIV risk was captured by actual self-reported substance use. The results did not differ when individual drugs were considered separately (e.g., benzodiazepines, opiates and clonidine).
3.3 Substance use, bodily pain and non-medical prescription drug use
Table 3 illustrates the results of the interaction between bodily pain and substance use. Persons who reported that pain interfered with their activities had higher non-medical use of prescription drugs than those that reported that pain did not interfere with their activities. The magnitude of the association between self-reported bodily pain and non-medical prescription drug use did differ by whether or not persons were using other substances. For example, among those who reported marijuana use in the prior six months, the association between pain interfering a little with activity and non-medical prescription drug use was 1.72 (95% CI: 1.15–2.58). However, among those not using marijuana, the magnitude was nearly double (PR: 3.37; 95% CI: 2.18–5.21). A similar association was observed between non-injection drug use (snorting cocaine or heroin, crack use or smoking heroin) and pain as well as active injection drug use and pain; the associations between bodily pain and non-medical prescription drug use were stronger among those not using drugs via injection or otherwise. No interaction was observed between bodily pain, street buprenorphine/methadone and non-medical prescription drug use.
Table 3.
Interaction between substance use, bodily pain and non-medical prescription drug use*
| Prevalence ratio (95% Confidence interval) | ||||
|---|---|---|---|---|
| No pain | Pain interferes with activity† | |||
| A little | Moderately | Highly | ||
| Marijuana use* | ||||
| No | 1 | 3.37 (2.18 – 5.21) | 4.03 (2.43 – 6.66) | 4.23 (2.57 – 6.94) |
| Yes | 1 | 1.72 (1.15 – 2.58) | 1.26 (0.77 – 2.07) | 2.04 (1.31 – 3.18) |
| Non-injection cocaine/heroin use* | ||||
| No | 1 | 3.27 (1.88 – 5.71) | 3.15 (1.58 – 6.28) | 3.38 (1.57 – 7.26) |
| Yes | 1 | 1.76 (1.22 – 2.55) | 1.72 (1.12 – 2.65) | 2.13 (1.37 – 3.30) |
| Injection drug use* | ||||
| None | 1 | 4.40 (1.50 – 12.93) | 1.61 (0.31 – 8.48) | 6.45 (1.97 – 21.13) |
| < daily | 1 | 2.36 (1.40 – 3.96) | 1.64 (0.84 – 3.21) | 2.41 (1.34 – 4.32) |
| ≥ daily | 1 | 1.57 (1.08 – 2.29) | 2.03 (1.35 – 3.03) | 2.18 (1.43 – 3.33) |
reference group for all three comparisons is no bodily pain
refer to behaviors in the prior six months
4. Discussion
We observed a high prevalence of non-medical prescription drug use in this population. Our results are similar national surveys of injection drug users in Australia that reported illicit drug use, defined as drugs obtained through a prescription in someone else’s name(IDRS, 2010). They reported the following prevalence of non-medical use of prescription drugs within last 6 months: 13%(prescription stimulants), 28%(oxycodone), 40% (benzodiazepines) and 4%(other opiates) in the six months preceding the interview(IDRS, 2010). Other studies have observed higher prevalence of use (up to 96%) but generally included different target populations (Lankenau, et al., 2007). Importantly, some studies included other routes of administration and we only inquired about oral administration.
Our estimates and those from other studies among IDUs are orders of magnitude higher than general population studies. For example, in the NSDUH, the prevalence of non-medical prescription drug in the past month was only 2.8 % (SAMHSA, 2009). Similarly, a population-based study in Japan found that 12-month prevalence of non-medical prescription drug use (tranquilizers, stimulants, analgesics) was 1.9% (Tominaga, et al., 2009). Further, a US-based study from 2002–2004, which included Baltimore reported low levels of Oxycontin abuse among the general population in Baltimore (0–0.31 per 100,000) (Cicero, et al., 2005). Interestingly, in this report, the authors did not observe higher prevalence of use among heroin-dependent persons or those living inner cities, but rather found that prescription drug use was concentrated in small-medium urban, semi-urban and rural areas (Cicero, et al., 2005). Our data combined with other reports (Cicero, et al., 2005; Firestone & Fischer, 2008; Fischer, Cruz, & Rehm, 2006) suggest that non-medical use of prescription drugs may be increasing among drug users in metropolitan areas.
In this study, opiates were the most commonly abused prescription drug which is commensurate with fact that this is a population that primarily abuses illicit opiates (e.g., heroin). Further, most studies whether in the general population or among substance users, have found that opiates are the most commonly abused prescription drug. In general, non-medical prescription drug use was more common among persons who also reported other substance use including injection, alcohol use, marijuana and diverted opiate substitution therapy. This is consistent with other reports that have suggested that risk factors travel together (Davis & Johnson, 2008; Lankenau, et al., 2007) and that prescription drug use is more common among those who abuse alcohol (Brands, et al., 2004) and marijuana (Blazer & Wu, 2009). Another study reported that some users begin substance abuse with alcohol, marijuana and cocaine and then move on to prescription drugs (Inciardi, et al., 2007). Some dealers market prescription and illicit drugs together, purporting that use of both together can ensure a “smooth landing” after the effect of the illicit drug wears off (Inciardi, et al., 2007). Polydrug use is especially concerning for this population because it can put individuals at risk for adverse events, chief among which is drug overdose (Sands, Knapp, & Ciraulo, 1993).
We also observed that non-medical prescription drug use was more common among those who reported bodily pain and depressive symptoms. The links between pain, depressive symptoms and non-medical prescription drug use have been previously documented. For example, a study among methadone maintenance patients observed that depressive symptoms were associated with use of prescription drugs (Brands, et al., 2004). Similarly, the association between bodily pain and non-medical use of prescription drugs has been extensively reported in the literature (Blazer & Wu, 2009; Brands, et al., 2004; Rosenblum, et al., 2007). There also appears to be some evidence that pain may be more prevalent in IDU populations who may be physiologically dependent on other substances (Rosenblum, et al., 2003).
Though causality cannot be determined from our study given the cross-sectional design and we did not specifically ask about the reasons for prescription drug use, our data suggest that the causes of non-medical prescription drug use are multi-factorial. Given the associations with other substance use, some persons may simply be using prescription drugs to get high or to enhance the high from other substances. However, prior reports have also suggested that some persons that engage in non-medical prescription drug use, take prescription drugs to self-medicate for stress related to both health and social adversity (Daniulaityte, Carlson, & Kenne, 2007). Our data lend further support to these hypotheses. Given that the observation that prescription drug use was more common among those with physical health (bodily pain) issues, it is possible that in this population, non-medical prescription drug use was in part to medicate for these symptoms. The hypothesis of self-medication is further supported by the observation that persons not using other substances by either injection or non-injection routes were more likely to use prescription drug in association with bodily pain. Though our findings are generally supported by the literature, we consider them hypothesis generating rather than confirmatory given the design.
In this study, we only asked about prescription drugs acquired on the street and not about prescription medications acquired from a physician. Understanding the interface between patients and providers will be critical for determining both the scope of non-medical use of prescription drug use and the reasons behind it. On the one hand, it is possible that persons in this study also abused drugs that were acquired through a medical prescription; indeed, “doctor shopping” by persons in order to obtain multiple prescriptions has been reported previously (Inciardi, et al., 2007). We did observe in the bivariate analysis that participants who saw the same physician 90% of the time were less likely to use prescription drugs. Though not protective in multivariate analysis, it is potentially encouraging that having the same physician may help to reduce non-medical prescription drug use.
On the other hand, the frequent acquisition of prescription medications on the street may reflect the general instability of IDUs with respect to medical care. Prior work has demonstrated that IDUs vacillate in and out of stable living situations and medical care. Further, even among those who are in care, depression and chronic pain, though common in this population, are likely to be under-diagnosed. Further, it is possible that clinicians are hesitant to prescribe pain killers and anti-depressants to persons with an underlying history of substance abuse. Thus, it is possible that at least some persons purchased prescription drugs on the street because they were unable to get them from a physician. Additional work is needed to confirm this conjecture, but it is important that clinicians treating such patients be sensitive to the fact that IDUs can access prescription drugs from the street without information on drug contra-indications, interactions and safe use.
Our study had several important limitations. We only asked about prescription drugs that were commonly used by our study participants over the prior decade and this may not reflect possible changes in patterns of non-medical prescription drug use over time. We focused on oral intake of prescription drugs and did not ask about other modes of administration; however, our data are consistent with prior studies among street drug users suggesting that oral administration was most common (Davis & Johnson, 2008). If anything, we would have underestimated the true prevalence of non-medical prescription drug use. It is possible that IDUs were familiar with street names of prescription drugs rather than the medical names used in the questionnaire. However, our survey was based on names reported by participants themselves and a study of patients in methadone maintenance found that patients were able to correctly match unlabeled drug photographs of five opioid prescription drugs with their medical names (Smith, Rosenblum, Parrino, Fong, & Colucci, 2010). We did not probe the reasons for non-medical use of prescription drugs since the focus of ALIVE study is on illicit drug use and health behaviors in general. The lack of data on reasons behind use, limited our ability to make inferences about the context of prescription drug use. We did not investigate sources of use other than street purchase. Again, this would have likely resulted in an underestimate of true prevalence. Because of the cross-sectional nature of the study, temporality and causal associations could not be determined. All data was self reported and may be subject to recall bias. Finally, this is an urban, predominantly African-American cohort and the findings may not be generalizable to other settings. Future research should further explore the reasons for prescription drug use. Information on knowledge, attitudes and beliefs related to prescription drug use and their source would provide important information on the context in which use occurs.
Our study provides evidence that the emerging public health problem of non-medical prescription drug use affects IDUs disproportionately. Further, if any of the use is related to self-medication for physical and mental health symptoms, use is likely to increase as IDUs age. Currently, it is not clear how much harm-reduction and counseling initiatives directed towards IDUs also include information on prescription drugs. Information on the potential hazards of nonmedical prescription drug use especially overdose, should be incorporated in interventions targeted at IDUs. Ongoing interventions targeted towards this population particularly those directed at cessation of substance use should incorporate non-medical prescription drug use in order to truly improve morbidity and mortality in this population.
Highlights.
We found a high prevalence of non-medical prescription drug use in a cohort of IDUs in Baltimore, MD.
Non-medical prescription drug use was linked with other substance abuse, Caucasian race and pain.
Programs for IDUs need to address non-medical prescription drug use to improve their health status.
Acknowledgments
The authors thank Lisa McCall for project management and the ALIVE study staff and participants without whom this work would not be possible.
Role of Funding Source
Funding for this study was provided by Public Health Grants from the National Institute on Drug Abuse (DA12568 and DA04334); the funding agency had no further role in study design; in the collection, analysis and interpretation of data; in the writing of the report; or in the decision to submit the paper for publication.
Footnotes
Contributors
Gregory D Kirk and Shruti H Mehta wrote the study protocol. Nidhi Khosla, Hee Soon Juon, and Jacqueline Astemborski undertook the statistical analysis. Nidhi Khosla reviewed the literature and wrote the first draft of the manuscript. Hee Soon Juon, Gregory D Kirk and Shruti Mehta provided critical input in data analysis and interpretation. All authors contributed to and have approved the final manuscript.
Conflict of Interest
No Conflict declared
Publisher's Disclaimer: This is a PDF file of an unedited manuscript that has been accepted for publication. As a service to our customers we are providing this early version of the manuscript. The manuscript will undergo copyediting, typesetting, and review of the resulting proof before it is published in its final citable form. Please note that during the production process errors may be discovered which could affect the content, and all legal disclaimers that apply to the journal pertain.
References
- Alemagno SA, Stephens P, Shaffer-King P, Teasdale B. Prescription drug abuse among adolescent arrestees: correlates and implications. J Correct Health Care. 2009;15(1):35–46. doi: 10.1177/1078345808326620. quiz 81. [DOI] [PubMed] [Google Scholar]
- Blazer DG, Wu LT. Nonprescription use of pain relievers by middle-aged and elderly community-living adults: National Survey on Drug Use and Health. J Am Geriatr Soc. 2009;57(7):1252–1257. doi: 10.1111/j.1532-5415.2009.02306.x. [DOI] [PMC free article] [PubMed] [Google Scholar]
- Brands B, Blake J, Sproule B, Gourlay D, Busto U. Prescription opioid abuse in patients presenting for methadone maintenance treatment. Drug Alcohol Depend. 2004;73(2):199–207. doi: 10.1016/j.drugalcdep.2003.10.012. [DOI] [PubMed] [Google Scholar]
- Cicero TJ, Inciardi JA, Munoz A. Trends in abuse of Oxycontin and other opioid analgesics in the United States: 2002–2004. J Pain. 2005;6(10):662–672. doi: 10.1016/j.jpain.2005.05.004. [DOI] [PubMed] [Google Scholar]
- Daniulaityte R, Carlson RG, Kenne DR. Methamphetamine use in Dayton, Ohio: preliminary findings from the Ohio Substance Abuse Monitoring Network. J Psychoactive Drugs. 2007;39(3):211–221. doi: 10.1080/02791072.2007.10400607. [DOI] [PubMed] [Google Scholar]
- Davis WR, Johnson BD. Prescription opioid use, misuse, and diversion among street drug users in New York City. Drug Alcohol Depend. 2008;92(1–3):267–276. doi: 10.1016/j.drugalcdep.2007.08.008. [DOI] [PMC free article] [PubMed] [Google Scholar]
- Firestone M, Fischer B. A qualitative exploration of prescription opioid injection among street-based drug users in Toronto: behaviours, preferences and drug availability. Harm Reduct J. 2008;5:30. doi: 10.1186/1477-7517-5-30. [DOI] [PMC free article] [PubMed] [Google Scholar]
- Fischer B, Cruz MF, Rehm J. Illicit opioid use and its key characteristics: a select overview and evidence from a Canadian multisite cohort of illicit opioid users (OPICAN) Can J Psychiatry. 2006;51(10):624–634. doi: 10.1177/070674370605101002. [DOI] [PubMed] [Google Scholar]
- Fischer B, Rehm J, Brissette S, Brochu S, Bruneau J, El-Guebaly N, et al. Illicit opioid use in Canada: comparing social, health, and drug use characteristics of untreated users in five cities (OPICAN study) J Urban Health. 2005;82(2):250–266. doi: 10.1093/jurban/jti049. [DOI] [PMC free article] [PubMed] [Google Scholar]
- Fischer B, Rehm J, Patra J, Cruz MF. Changes in illicit opioid use across Canada. CMAJ. 2006;175(11):1385. doi: 10.1503/cmaj.060729. [DOI] [PMC free article] [PubMed] [Google Scholar]
- Gardner W, Mulvey EP, Shaw EC. Regression analyses of counts and rates: Poisson, overdispersed Poisson, and negative binomial models. Psychol Bull. 1995;118(3):392–404. doi: 10.1037/0033-2909.118.3.392. [DOI] [PubMed] [Google Scholar]
- Green TC, Grimes Serrano JM, Licari A, Budman SH, Butler SF. Women who abuse prescription opioids: findings from the Addiction Severity Index-Multimedia Version Connect prescription opioid database. Drug Alcohol Depend. 2009;103(1–2):65–73. doi: 10.1016/j.drugalcdep.2009.03.014. [DOI] [PMC free article] [PubMed] [Google Scholar]
- IDRS. Australian Drug Trends. 2010. [Google Scholar]
- Inciardi JA, Surratt HL, Kurtz SP, Cicero TJ. Mechanisms of prescription drug diversion among drug-involved club- and street-based populations. Pain Med. 2007;8(2):171–183. doi: 10.1111/j.1526-4637.2006.00255.x. [DOI] [PMC free article] [PubMed] [Google Scholar]
- Kirsh KL, Smith HS. Special issues and concerns in the evaluation of older adults who have pain. Clin Geriatr Med. 2008;24(2):263–274. vi. doi: 10.1016/j.cger.2007.12.005. [DOI] [PubMed] [Google Scholar]
- Lankenau SE, Sanders B, Bloom JJ, Hathazi DS, Alarcon E, Tortu S, et al. Prevalence and Patterns of Prescription Drug Misuse among Young Ketamine Injectors. J Drug Issues. 2007;37(3):717–736. doi: 10.1177/002204260703700311. [DOI] [PMC free article] [PubMed] [Google Scholar]
- McCabe SE. Screening for drug abuse among medical and nonmedical users of prescription drugs in a probability sample of college students. Arch Pediatr Adolesc Med. 2008;162(3):225–231. doi: 10.1001/archpediatrics.2007.41. [DOI] [PMC free article] [PubMed] [Google Scholar]
- McCabe SE, Teter CJ, Boyd CJ. The use, misuse and diversion of prescription stimulants among middle and high school students. Subst Use Misuse. 2004;39(7):1095–1116. doi: 10.1081/ja-120038031. [DOI] [PubMed] [Google Scholar]
- NIDA. No. NIH Publication Number 05–4881. 2005. Prescription Drugs: Abuse and Addiction. [Google Scholar]
- Novak SP, Herman-Stahl M, Flannery B, Zimmerman M. Physical pain, common psychiatric and substance use disorders, and the non-medical use of prescription analgesics in the United States. Drug Alcohol Depend. 2009;100(1–2):63–70. doi: 10.1016/j.drugalcdep.2008.09.013. [DOI] [PMC free article] [PubMed] [Google Scholar]
- Obadia Y, Perrin V, Feroni I, Vlahov D, Moatti JP. Injecting misuse of buprenorphine among French drug users. Addiction. 2001;96(2):267–272. doi: 10.1046/j.1360-0443.2001.96226710.x. [DOI] [PubMed] [Google Scholar]
- Pawl R. Prescription narcotic drug abuse: “We have met the enemy and they are ourselves”. Surg Neurol. 2008;69(5):538–541. doi: 10.1016/j.surneu.2007.10.013. [DOI] [PubMed] [Google Scholar]
- Perdue T, Hagan H, Thiede H, Valleroy L. Depression and HIV risk behavior among Seattle-area injection drug users and young men who have sex with men. AIDS Educ Prev. 2003;15(1):81–92. doi: 10.1521/aeap.15.1.81.23842. [DOI] [PubMed] [Google Scholar]
- Radloff L. The CES-D scale: A self-report depression scale for research in the general population. Applied Psychological Measurement. 1977;1:385–401. [Google Scholar]
- Rosenblum A, Joseph H, Fong C, Kipnis S, Cleland C, Portenoy RK. Prevalence and characteristics of chronic pain among chemically dependent patients in methadone maintenance and residential treatment facilities. JAMA. 2003;289(18):2370–2378. doi: 10.1001/jama.289.18.2370. [DOI] [PubMed] [Google Scholar]
- Rosenblum A, Parrino M, Schnoll SH, Fong C, Maxwell C, Cleland CM, et al. Prescription opioid abuse among enrollees into methadone maintenance treatment. Drug Alcohol Depend. 2007;90(1):64–71. doi: 10.1016/j.drugalcdep.2007.02.012. [DOI] [PubMed] [Google Scholar]
- SAMHSA. Results from the 2006 National Survey on Drug Use and Health:National Findings. NSDUH series H-32, DHHS Publication No.SMA 07-4293. 2007 Retrieved from http://oas.samhsa.gov/nsduh/2k6nsduh/2k6Results.pdf.
- SAMHSA. Results from the 2009 National Survey on Drug Use and Health: National Findings. NSDUH Series H-38A, HHS Publication No. SMA 10-4586(findings) 2009 Retrieved from http://www.oas.samhsa.gov/nsduh/reports.htm.
- Sands B, Knapp CM, Ciraulo DA. Medical consequences of alcohol-drug interactions. Alcohol Health & Research World. 1993;17(4):5. [Google Scholar]
- Saunders JB, Aasland OG, Babor TF, de la Fuente JR, Grant M. Development of the Alcohol Use Disorders Identification Test (AUDIT): WHO Collaborative Project on Early Detection of Persons with Harmful Alcohol Consumption--II. Addiction. 1993;88(6):791–804. doi: 10.1111/j.1360-0443.1993.tb02093.x. [DOI] [PubMed] [Google Scholar]
- Sigmon SC. Characterizing the emerging population of prescription opioid abusers. Am J Addict. 2006;15(3):208–212. doi: 10.1080/10550490600625624. [DOI] [PubMed] [Google Scholar]
- Smith M, Rosenblum A, Parrino M, Fong C, Colucci S. Validity of self-reported misuse of prescription opioid analgesics. Subst Use Misuse. 2010;45(10):1509–1524. doi: 10.3109/10826081003682107. [DOI] [PubMed] [Google Scholar]
- STATA. STATA Statistical Software: Release 10. College Station, Texas: STATA; 2007. [Google Scholar]
- Surratt HL, Inciardi JA, Kurtz SP. Prescription opioid abuse among drug-involved street-based sex workers. J Opioid Manag. 2006;2(5):283–289. doi: 10.5055/jom.2006.0042. [DOI] [PubMed] [Google Scholar]
- Tominaga M, Kawakami N, Ono Y, Nakane Y, Nakamura Y, Tachimori H, et al. Prevalence and correlates of illicit and non-medical use of psychotropic drugs in Japan: findings from the World Mental Health Japan Survey 2002–2004. Soc Psychiatry Psychiatr Epidemiol. 2009;44(9):777–783. doi: 10.1007/s00127-009-0499-1. [DOI] [PubMed] [Google Scholar]
- Vlahov D, Anthony JC, Munoz A, Margolick J, Nelson KE, Celentano DD, et al. The ALIVE study, a longitudinal study of HIV-1 infection in intravenous drug users: description of methods and characteristics of participants. NIDA Res Monogr. 1991;109:75–100. [PubMed] [Google Scholar]
- Vlahov D, O’Driscoll P, Mehta SH, Ompad DC, Gern R, Galai N, et al. Risk factors for methadone outside treatment programs: implications for HIV treatment among injection drug users. Addiction. 2007;102(5):771–777. doi: 10.1111/j.1360-0443.2007.01767.x. [DOI] [PubMed] [Google Scholar]
- Ware J, Jr, Kosinski M, Keller SD. A 12-Item Short-Form Health Survey: construction of scales and preliminary tests of reliability and validity. Med Care. 1996;34(3):220–233. doi: 10.1097/00005650-199603000-00003. [DOI] [PubMed] [Google Scholar]