

Abstract
Human tumors are heterogeneous and evolve through a dynamic process of genetic mutation and selection. During this process, the effects of a specific mutation on the incipient cancer cell may dictate the nature of subsequent mutations that can be tolerated or selected for, affecting the rate at which subsequent mutations occur. Here we have used a new mouse model of prostate cancer that recapitulates several salient features of the human disease to examine the relative rates in which the remaining wild type alleles of Pten and p53 tumor suppressor genes are lost. In this model, focal overexpression of c-MYC in a few prostate luminal epithelial cells provokes a mild proliferative response. In the context of compound Pten/p53 heterozygosity, c-MYC-initiated cells progress to prostatic intraepithelial neoplasia (mPIN) and adenocarcinoma lesions with marked heterogeneity within the same prostate glands. Using Laser Capture Microdissection and gene copy number analyses, we found that the frequency of Pten loss was significantly higher than that of p53 loss in mPIN but not invasive carcinoma lesions. c-MYC overexpression, unlike Pten loss, did not activate the p53 pathway in transgenic mouse prostate cells, explaining the lack of selective pressure to lose p53 in the c-MYC-overexpressing cells. This model of heterogeneous prostate cancer based on alterations in genes relevant to the human disease may be useful for understanding pathogenesis of the disease and testing new therapeutic agents.
Keywords: c-MYC, Pten, p53, prostate cancer, rate of mutations
Introduction
Human somatic tumorigenesis is believed to initiate with a single genetic mutation in a cancer gene, with progressive accumulation of additional genetic alterations that confer a selective growth advantage on the mutant cell (Fearon & Vogelstein, 1990). A notable feature of this multistep model of carcinogenesis is the occurrence of a preferred (but not absolute) order in which these genetic mutations accumulate during cancer progression (Fearon & Vogelstein, 1990; Yeang et al., 2008). In human colorectal carcinomas where defined histopathological stages are easily recognizable and accessible, this notion could be examined (Fearon & Vogelstein, 1990). However, other tumors such as prostate cancer, are notoriously heterogeneous and have precursor lesions that are not as well defined (Andreoiu & Cheng,; Cheng et al., 1998; Greene et al., 1991; Villers et al., 1992). Some have suggested that prostate cancer heterogeneity may be due to an underlying “field effect” which sensitizes wide swathes of tissue to transformation without the presence of an obvious histological abnormality, a phenomenon known as field cancerization (Slaughter et al., 1953). This complexity of the human disease makes the use of accurate animal models an attractive approach to define tumor initiation and multistep progression in prostate cancer.
To begin to address these issues, we used the Z-MYC mouse (Roh et al., 2006) which contains a latent, Cre-activatable c-MYC allele which when combined with a prostate-specific Cre allele (PbCre4), yields a novel mouse model of c-MYC-initiated prostate cancer that recapitulates various salient features of the human disease (Kim et al., 2009). In the PBCre4;Z-MYC model, we have shown that c-MYC is induced focally in the prostatic luminal epithelial cells. Notably, in a significant fraction of these mice, c-MYC expression leads to the expansion of “fields” of c-MYC-positive cells without eliciting any obvious pathology (Kim et al., 2009). However, c-MYC expression sensitizes the prostate cells to the transforming effects of additional mutations. To examine tumor progression in this model, we have generated Pten/p53 compound mutant mice and examined loss of gene copy number in microdissected c-MYC-expressing prostate lesions. The genes that form the basis for this mouse model are relevant to human prostate cancer. c-MYC overexpression is an early event in prostate cancer, with recent studies indicating overexpression in up to ~76% of prostatic intraepithelial neoplasia (PIN) lesions (Gurel et al., 2008), while alterations in PTEN and P53 have been observed in human prostate cancer with varying frequencies (Bookstein et al., 1993; Brooks et al., 1996; Carver et al., 2009; Chi et al., 1994; Dinjens et al., 1994; Dong et al., 2001; Effert et al., 1993; Feilotter et al., 1998; Fenic et al., 2004; Fernandez-Marcos et al., 2009; Grizzle et al., 1994; Han et al., 2009; Konishi et al., 1995; McCall et al., 2008; McMenamin et al., 1999; Mellon et al., 1992; Mirchandani et al., 1995; Navone et al., 1993; Nesslinger et al., 2003; Qian et al., 2002; Schmitz et al., 2007; Sircar et al., 2009; Suzuki et al., 1998; Voeller et al., 1994; Wang et al., 1998; Yoshimoto et al., 2007). However, there has been limited analysis of the rates of mutation in PTEN and P53 in the same tumor, and their relation to progression. Our analysis of c-MYC-initiated mouse prostate tumors allowed examination of alterations in Pten versus p53 during tumor progression, which appears to be dictated by the molecular interaction between the c-MYC, Pten and p53 pathways.
Materials and Methods
Animals
Z-MYC, PbCre4, Ptenf/f and p53f/f mice on B6/129 background have been described previously (Groszer et al., 2001; Jonkers et al., 2001; Kim et al., 2009; Roh et al., 2006; Wu et al., 2001). p53f/f and Ptenf/f mice were obtained from MMHCC, Frederick. PbCre4;p53f/+, PbCre4;p53f/f, PbCre4;Z-MYC;p53f/+ and PbCre4;Z-MYC;p53f/f mice were generated using a similar strategy to that described for generating PbCre4/Z-MYC/Ptenf/f compound mutant mice (Kim et al., 2009). To generate PbCre4;Ptenf/+;p53f/+, PbCre4;Ptenf/f;p53f/+, PbCre4;Ptenf/+;p53f/f, PbCre4;Z-MYC;Ptenf/+;p53f/+, PbCre4;Z-MYC;Ptenf/f;p53f/+, PbCre4;Z-MYC;Ptenf/+;p53f/f mice, we first generated PbCre4;Ptenf/f;p53f/f males and Z-MYC;Ptenf/+;p53f/+ females and these were further crossed. Animal care and experiments were carried out according to the protocols approved by the Institutional Animal Care and Use Committees at Vanderbilt University.
Histology and immunohistochemical analyses
Mouse prostate tissues were prepared as described (Abdulkadir et al., 2001b) and histopathology was evaluated by SAA and IAE based on published criteria (Mentor-Marcel et al., 2001). Immunohistochemical analyses were performed as described (Abdulkadir et al., 2001a)(Abdulkadir et al., 2001b) and the following antibodies were used (when indicated as TSA, Tyramide Signal Amplification (Perkin Elmer) was applied): anti-c-MYC (rabbit, 1:15,000 with TSA, Santa Cruz Biotechnology), anti-α-smooth muscle actin (SMA) (mouse, 1:2000, Sigma), anti-Pten (rabbit, 1:200 with TSA, Cell Signaling), anti-Synaptophysin (mouse, 1:1000, BD Biosciences), anti-activated Caspase 3 (rabbit, 1:500, Cell Signaling), anti-phospho-Histone H3 (rabbit, 1:500, Upstate), anti-p53 (rabbit, 1:5000 with TSA, Santa Cruz Biotechnology) and anti-androgen receptor (AR) (rabbit, 1:500, Santa Cruz Biotechnology). Double stains with two antibodies of same species are described previously (Kim et al., 2009). 3–4 tissue samples were used for the quantitation of proliferation and apoptosis using anti-phospho-Histone H3 and anti-activated Caspase 3 antibodies. Nuclei were stained with DAPI (Vector Laboratories).
Laser capture microdissection (LCM) and DNA isolation
LCM was performed on PixCell II Laser Capture Microdissection System (MDS) using CapSure Macro LCM Caps (MDS) and DNA extraction was followed according to manufacturer's instruction (PicoPure DNA extraction kit, MDS). Immunostaining for c-MYC and Pten on adjacent sections were used to guide LCM.
Quantitative Polymerase Chain Reaction (qPCR) and Gene copy number analysis
QPCR with extracted DNA from LCM procedure was performed on 7300 Real Time PCR System (Applied Biosystems) using Platinum qPCR Supermix-UDG (Invitrogen). For the reaction of 25μl, 12.5μl of 2× Supermix, 1.4μl of water, 0.5μl of ROX reference dye, 1μl each of two 6μM primer pairs (Pten/Apo B or p53/Apo B), 0.8μl each of two 6μM probes (Pten/Apo B or p53/Apo B) and 5μl of DNA were added. Apo B gene was always coamplified with either Pten or p53 as an internal control. Mouse tail DNA was included in each reaction for normalization. Conditional Pten heterozygous and p53 heterozygous prostate tissues were used as standard samples to determine the range of gene copy number (1 or 0). Triplicate data were analyzed by ddCt method. Based on the range of normalized quantity of standard samples (0.451–0.679 for one copy of Pten and 0.276–0.462 for one copy of p53, see Table S1) as well as significance t-test (P < 0.05) between normalized sample quantities and standard sample quantities, gene copy numbers of Pten and p53 were determined. Primers and probes used were: Pten forward (5'-ACA ATC ATg TTg CAg CAA TTC AC-3'), Pten reverse (5'-CCg ATg CAA TAA ATA TgC ACA AA-3') and Pten probe (5'-/FAM/CCg gAT g AgC Tgg AAA ggg ACg gAC Tgg TgT AA CAT CCg g/BHQ/-3'); Apo B forward (5'-ATC TCA gCA CgT ggg CTC-3'), Apo B reverse (5'-TCA CCA gTC ATT TCT gCC TTT g-3') and Apo B probe (5'-/JOE/CgC gAT g CCA ATg gTC ggg CAC TgC TCA A CAT CgC g/BHQ/-3'); p53 forward (5'-CTg TgC AgT TgT ggg TCA gC-3'), p53 reverse (5'-ACC TCC gTC ATg TgC TgT gA-3') and p53 probe (5'-/FAM/CCg gAT g ggA gCC gTg TCC gCg CCA T CAT CCg g/BHQ/-3') (all sequences are available at http://emice-stage.nci.nih.gov/).
Statistical analyses
Each group was compared using t-test or Chi-square test (Preacher, 2001). Values are considered statistically significant at P < 0.05. Quantitative variables are expressed as means ± standard deviation while categorical variables are expressed as numbers (%).
Results
c-MYC expression sensitizes prostate cells to the effects of loss of one or both copies of the p53 tumor suppressor gene (TSG)
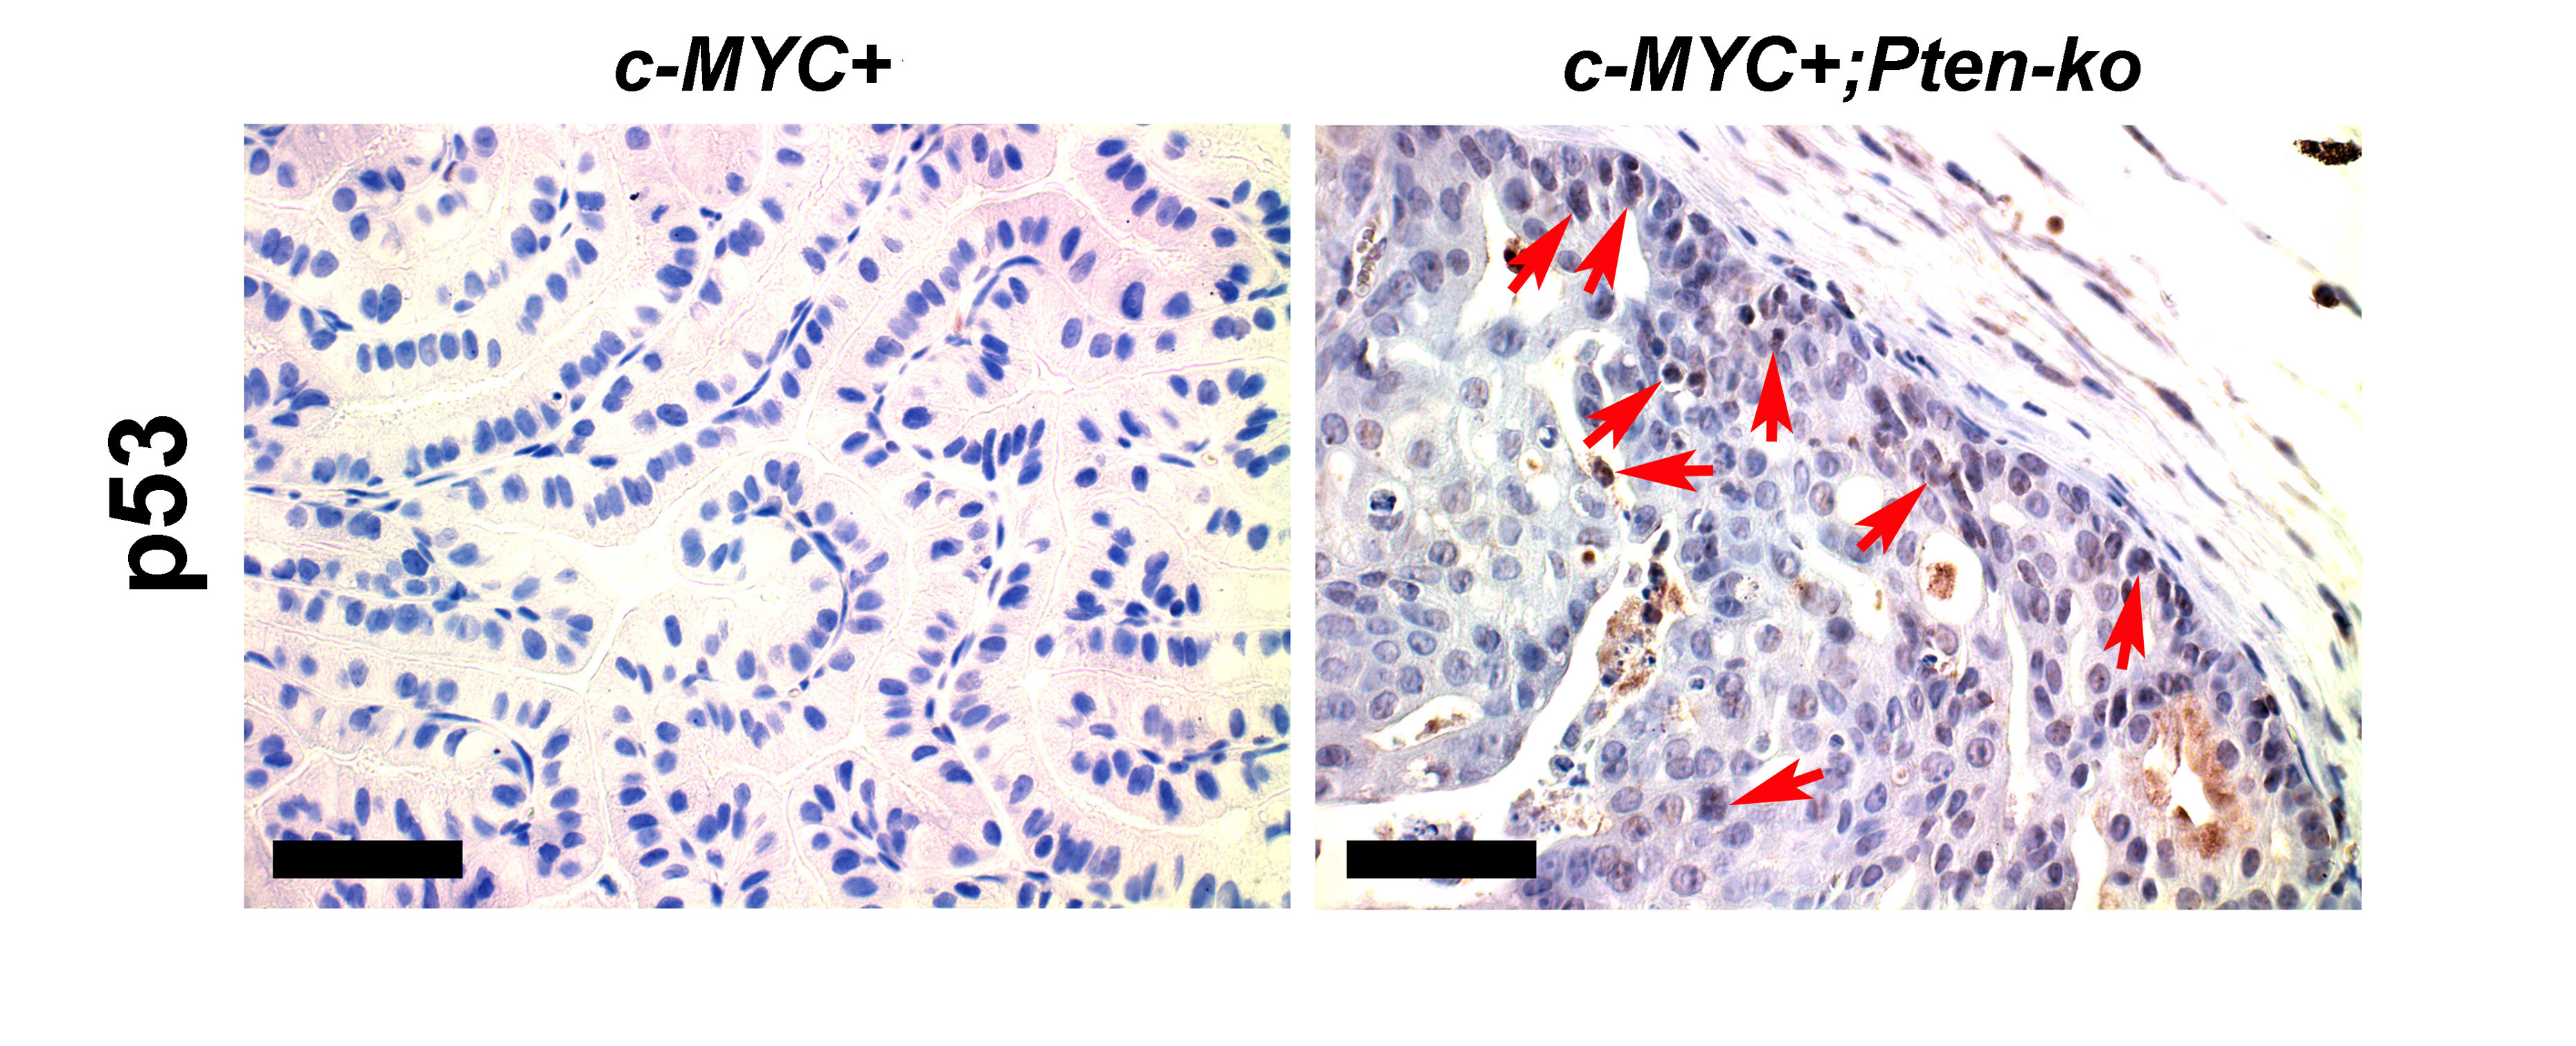
Our primary goal was to generate a focal, stepwise model of prostate cancer that closely resembles the human disease and in which we can investigate the relative frequencies of TSG (Pten and p53) loss at various stages of progression. We have previously shown that focal c-MYC expression in Pten heterozygous mice leads to efficient generation of PIN lesions associated with downregulation of Pten protein expression (Kim et al., 2009). Progression of these c-MYC+;Pten-negative lesions is restrained by an apoptotic response concurrent with activation of the p53 pathway (Kim et al., 2009). To further explore the role of p53 in this model, we first assessed the effects of concurrent loss of p53 and overexpression of c-MYC. We generated cohorts of conditional, compound mutant mice as follows: PbCre4;Z-MYC;p53f/+ (c-MYC+;p53-het), PbCre4;Z-MYC;p53f/f (c-MYC+;p53-ko), PbCre4;p53f/+ (p53-het) and PbCre4;p53f/f (p53-ko), where “het” refers to heterozygous and “ko” refers to knockout. In agreement with a previous report (Chen et al., 2005), p53 deficiency in the mouse prostate by itself did not cause any noticeable abnormalities (Figures 1, 2A and 3). However, concurrent c-MYC expression and heterozygous or homozygous p53 deletion led to the age-dependent development of low grade PIN (LGPIN) and high grade PIN (HGPIN) (Figures 1, 2A and 3). Some HGPIN lesions in c-MYC+;p53-ko mice showed evidence of microinvasion but still retained Pten protein expression (Figure 3B). There was an additive increase in proliferation in cells with concurrent reduction of p53 dosage and c-MYC expression without a significant change in apoptosis (Figure 3C). This contrasts with c-MYC+;Pten-ko prostates which show elevated rates of apoptosis (Kim et al., 2009). Thus c-MYC expression cooperates modestly with p53 loss in the prostate but the lesions do not rapidly progress to invasive cancer. Notably, we have shown that the level of c-MYC expression in our c-MYC+ prostate model is not sufficient to activate the p53 pathway (Kim et al., 2009) (see also Figure S1), possibly explaining the lack of selective pressure to lose p53 upon c-MYC expression.
Figure 1. Summarized pathology of mouse prostates with alterations in c-MYC, Pten and/or p53.

Pathology summary of prostate-specific, conditional mouse models of prostate cancer with alterations in c-MYC, Pten and/or p53, based on this report and three published studies (Chen et al., 2005; Kim et al., 2009; Wang et al., 2003). The pathological diagnoses are indicated with solid colors when they occur with 100% incidence; otherwise, shown as gradient colors. All the reports utilized the same prostate-specific Cre line (PbCre4, (Wu et al., 2001)). Het = conditional heterozygous mutant, ko = conditional knockout, N/S = numbers not specified.
Figure 2. Summary of pathology of mouse prostates.

Graphs show histopathology findings in each group of mutant mouse prostates. Genotypes, the number of mice (N) examined and ages (in weeks) when analyzed are indicated.
Figure 3. Modest cooperation between focal c-MYC expression and p53 haploinsufficiency or deficiency in the mouse prostates.

(A and B) H&E images showing the pathology in mutant mouse prostates. Note focal high grade PIN in c-MYC+;p53-het mouse prostates (`c' and `d' in A) and PIN with microinvasion (arrows) in c-MYC+;p53-ko prostate (`a' and `d' in B). Note breach in SMA, smooth muscle actin indicative of microinvasion in `b' and `e'. Panels `c' and `f' in B show Pten expression by immunofluorescence. Scale bars: 100μm. (C) Cellular proliferation and apoptosis in the mouse prostates are quantitated following immunohistochemistry for phospho-histone H3 (pHH3) and activated Caspase 3, respectively. N=3–5 per group. *P < 0.05.
Pten and p53 restrain the progression of c-MYC-initiated prostate cancer
The results from analysis of c-MYC+;p53-mutant mice shown above and our previously reported analysis of c-MYC+;Pten-mutant mice (Kim et al., 2009) suggest that retention of wild type Pten or p53 restrains the progression of c-MYC-initiated prostate cancer cells with mutation in either the p53 or Pten TSGs. We sought formal proof of this by examining tumor progression in conditional c-MYC+;Pten/p53 compound mutant mice where only one of either the Pten or p53 alleles is wild type. Indeed, while control Pten-het;p53-ko mice without c-MYC overexpression only developed HGPIN with a 33% incidence in mice monitored up to 50 weeks of age (Figures 1, 2B, and 4), c-MYC+;Pten-het;p53-ko mice developed aggressive prostate adenocarcinoma as early as 10 weeks of age (Figures 1, 2B and 4). These tumors were associated with downregulation of the wild type Pten expression (Figure 4C) and were metastatic to the lymph nodes as verified by staining for androgen receptor (AR) and cytokeratin 8 (Figure 4B, panels `c–e'). Similarly, c-MYC+;Pten-ko;p53-het mice developed aggressive prostate adenocarcinoma while the control Pten-ko;p53-het mice developed HGPIN and well-differentiated prostate cancer (Figures 1, 2 and 4), consistent with the reported phenotype of Pten-ko mice (Wang et al., 2003). In all cases in these c-MYC+;Pten-het;p53-ko and c-MYC+;Pten-ko;p53-het compound mutant mice, development of aggressive tumors was associated with loss of the corresponding wild type Pten or p53 allele as determined by gene copy number assessment using c-MYC and Pten immunofluorescence-guided Laser Capture Microdissection (Table 1; see also Figure 7E panels b and c). These results indicate potent synergy between c-MYC expression and loss of Pten/p53 that appears to be largely mediated by accelerating loss of the wild type Pten or p53 allele. In this regard, it is interesting to note that even in the prostate lesions of c-MYC+;Pten-ko (i.e. PbCre4;Z-MYC;Ptenf/f) mutant mice, we found evidence for loss of 1 or both copies of the wild type p53 alleles (Figure 7E, panels “b” and “c” and Table S2).
Figure 4. Additional deletion of either one or two copies of Pten accelerates tumor formation and leads to lymph node metastases.

(A) H&E stains. Examples of rare, focal HGPIN in old Pten-het;p53-ko mouse prostate (age=50 weeks) are shown in panels `a–d'. (B) H&E stains of sections from c-MYC+;Ptenhet;p53-ko mice show aggressive cancers (panels `a' and `b') with lymph node metastases (panels `c–e'). `c,d,e' show H&E, staining for androgen receptor (AR) and cytokeratin 8 (CK8) in lymph node (insets are higher magnification images). (C) Immunofluorescent detection of focal (a) or diffuse (b) loss of Pten expression (arrows) in mice with the indicated genotypes. (D) H&E stained sections show HGPIN/well-differentiated cancer and moderately-differentiated cancer in Pten-ko;p53-het (a) and c-MYC+;Pten-ko;p53-het (b) mouse prostates, respectively. Scale bars: 100μm.
Table 1.
Pten expression status and gene copy number quantitation of Pten and p53 in mutant mouse prostate samples.
| Mouse ID (age) | Sample # | Pathology | Pten IHC | Pten Copy # | Normalized Qty (Ren) | p53 Copy # | Normalized Qty (p53) |
|---|---|---|---|---|---|---|---|
|
| |||||||
| c-MYC+;Pten-het;p53-ko | |||||||
|
| |||||||
| 7352 (16wks) | S55 | PIN | - | 0 | 0.1156 | 0* | ND |
| S56 | PIN | - | 0 | 0.2928 | 0* | ND | |
| S58 | Cancer | - | 0 | 0.0446 | 0* | ND | |
|
| |||||||
| 7345 (17wks) | S52 | PIN | - | 0 | 0.1534 | 0* | ND |
| S53 | PIN | - | 0 | 0.2352 | 0* | ND | |
| S54 | Cancer | - | 0 | 0.007 | 0* | ND | |
|
| |||||||
| 151 (19wks) | S51 | PIN | + | 1 | 0.6712 | 0* | ND |
| S49 | PIN | - | 0 | 0.1732 | 0* | ND | |
| S50 | Cancer | - | 0 | 0.1482 | 0* | ND | |
|
| |||||||
| c-MYC+;Pten-ko;p53-het | |||||||
|
| |||||||
| 547 (16wks) | S70 | PIN | ND | 0* | ND | 0 | 0.2315 |
| S69 | Cancer | ND | 0* | ND | 0 | 0.098 | |
|
| |||||||
| 593 (18wks) | S100 | PIN | ND | 0* | ND | 1 | 0.3003 |
| S101 | PIN | ND | 0* | ND | 1 | 0.4117 | |
| S102 | PIN | ND | 0* | ND | 1 | 0.2942 | |
|
| |||||||
| c-MYC+;Pten-het;p53-het | |||||||
|
| |||||||
| 7312 (10wks) | S19 | PIN | - | 0 | 0.0015 | 0 | 0.0448 |
|
| |||||||
| 8150 (16wks) | S1 | Cancer | - | 0 | 0.3333 | 1 | 0.5797 |
| S2 | PIN | - | 1 | 0.6062 | 1 | 0.6318 | |
| S3 | PIN | - | 1 | 0.6087 | 1 | 0.7103 | |
| S4 | Cancer | - | 0 | 0.3283 | 1 | 0.5631 | |
| S5 | PIN | + | 1 | 0.9152 | 1 | 0.7202 | |
| S6 | PIN | + | 1 | 1.0263 | 1 | 0.5593 | |
| S7 | PIN | + | 1 | 0.9161 | 1 | 0.6605 | |
| S8 | PIN | + | 1 | 1.0027 | 1 | 0.5276 | |
| S10 | PIN | + | 1 | 1.3528 | 1 | 0.9262 | |
|
| |||||||
| 561 (17wks) | S96 | PIN | - | 1 | 0.483 | 1 | 0.4282 |
| S97 | PIN | - | 1 | 0.5407 | 1 | 0.4322 | |
| S98 | PIN | - | 0 | 0.3992 | 1 | 0.3146 | |
| S99 | PIN | - | 0 | 0.4241 | 1 | 0.3983 | |
|
| |||||||
| 355 (18wks) | S83 | PIN | - | 0 | 0.3536 | 1 | 0.3051 |
| S84 | PIN | - | 1 | 1.6025 | 1 | 0.3974 | |
|
| |||||||
| 243 (23wks) | S82 | PIN | - | 0 | 0.3355 | 0 | 0.236 |
|
| |||||||
| 8184 (24wks) | S11 | PIN | - | 0 | 0.2316 | 1 | 0.751 |
| S12 | PIN | - | 1 | 0.9762 | 1 | 0.6265 | |
| S13 | PIN | - | 1 | 0.8407 | 1 | 0.6842 | |
| S14 | PIN | - | 1 | 0.7727 | 1 | 0.7652 | |
| S15 | PIN | - | 1 | 0.7679 | 1 | 0.701 | |
| S16 | PIN | - | 1 | 0.6586 | 1 | 0.7117 | |
| S17 | PIN | - | 1 | 0.5308 | 1 | 0.7464 | |
| S78 | PIN | - | 0 | 0.2545 | 0 | 0.157 | |
| S79 | PIN | - | 0 | 0.2557 | 1 | 0.3114 | |
| S80 | PIN | - | 0 | 0.2463 | 1 | 0.3972 | |
| S81 | Cancer | - | 0 | 0.3272 | 0 | 0.2112 | |
|
| |||||||
| 7367 (26wks) | S28 | PIN | + | 1 | 0.4922 | 1 | 0.32 |
| S29 | PIN | - | 1 | 0.5657 | 1 | 0.483 | |
| S30 | PIN | - | 0 | 0.3419 | 0 | 0.1239 | |
| S31 | PIN | - | 0 | 0.3549 | 0 | 0.2659 | |
| S32 | PIN | - | 0 | 0.2626 | 1 | 0.3308 | |
| S34 | PIN | - | 1 | 0.552 | 1 | 0.3014 | |
| S35 | PIN | + | 1 | 0.7529 | 0 | 0.2411 | |
| S36 | PIN | - | 0 | 0.4428 | 1 | 0.3726 | |
| S38 | PIN | + | 1 | 0.5998 | 1 | 0.3149 | |
| S39 | PIN | - | 0 | 0.4191 | 1 | 0.2928 | |
| S41 | PIN | + | 1 | 0.4396 | 1 | 0.4553 | |
| S42 | PIN | - | 0 | 0.3313 | 1 | 0.6036 | |
| S76 | PIN | - | 1 | 0.3464 | 0 | 0.2705 | |
| S77 | PIN | - | 0 | 0.3299 | 0 | 0.2451 | |
|
| |||||||
| 411 (27wks) | S93 | PIN | - | 1 | 0.4076 | 1 | 0.3423 |
| S94 | PIN | - | 0 | 0.4472 | 1 | 0.3562 | |
| S95 | PIN | - | 0 | 0.4099 | 1 | 0.3082 | |
|
| |||||||
| 7379 (38wks) | S43 | Cancer | - | 0 | 0.0376 | 0 | 0.0159 |
| S44 | Cancer | - | 0 | 0.0168 | 0 | 0.0078 | |
| S45 | Cancer | - | 0 | 0.0815 | 0 | 0.018 | |
| S47 | PIN | - | 0 | 0.2102 | 0 | 0.1327 | |
|
| |||||||
| 8409 (39wks) | S22 | Cancer | - | 0 | 0.0001 | 0 | 0.1290 |
| S23 | Cancer | - | 0 | 0.0009 | 0 | 0.0690 | |
| S24 | Cancer | - | 0 | 0.0003 | 0 | 0.0691 | |
| S25 | Cancer | - | 0 | 0.1867 | 0 | 0.2615 | |
|
| |||||||
| 109 (40wks) | S86 | PIN | - | 0 | 0.2649 | 0 | 0.2491 |
| S87 | PIN | - | 0 | 0.0777 | 0 | 0.0779 | |
| S88 | Cancer | - | 0 | 0.0054 | 0 | 0.0076 | |
| S89 | Cancer | - | 0 | 0.0348 | 0 | 0.0223 | |
| S90 | PIN | - | 0 | 0.1058 | 0 | 0.0563 | |
| S91 | PIN | - | 0 | 0.0825 | 0 | 0.0771 | |
| S92 | PIN | - | 0 | 0.1826 | 0 | 0.1242 | |
Gene copy number was determined by qPCR of DNA isolated from immunofluorescence-guided microdissected PIN and cancer lesions.
Copy number based on genotype. ND = not determined. Wks = weeks. IHC=immunohistochemistry.
Figure 7. A preference for loss of Pten prior to loss of p53 in c-MYC-initiated mouse prostate cancer.

(A and C) Adjacent sections from c-MYC+;Pten-het;p53-het mouse prostates were stained for Pten/SMA, Hematoxylin (H) or c-MYC. PIN and cancer foci were microdissected by LCM and DNA isolated. Arrows indicate microdissected glands. Lesions S3 and S4 (e) both have loss of Pten protein expression but only S4 shows loss of Pten DNA copy number. Scale bars: 500μm. (B) Graph showing percent loss of Pten protein expression in abnormal prostatic lesions (N = 60 lesions, including 48 PINs and 12 cancers) analyzed (`a', black bar) and percent of lesions that also lost the wild type Pten DNA copy (N = 51) (`b', black bar). (D) Comparison of the frequency of loss of Pten or p53 wild type alleles. Note that Pten loss is significantly more frequent than p53 loss in PIN but not cancer lesions. *Chi-square test, P < 0.05. (E) Heatmap representations of loss of either Pten or p53 loss (black bars) in each sample (PIN and cancer) based on the copy number analysis in Table 1. Boxes under the black line indicate cancer samples, while the remaining samples are PIN. Number of microdissected lesions analyzed: c-MYC+;Pten-het;p53-het, N=60. c-MYC+;Pten-het;p53-ko, N=9 and c-MYC+;Pten-ko;p53-het, N=5.
Higher rate of loss of Pten compared to p53 in conditional c-MYC+;Pten-het;p53-het mice during prostate tumorigenesis
The heterogeneous focal nature of c-MYC expression in our model provides us with an opportunity to examine, within the same prostate glands, the evolution of PIN lesions to carcinoma and the choice made by incipient neoplastic cells between loss of Pten and loss of p53 during tumor evolution. To facilitate this analysis, we generated and monitored tumor progression in c-MYC+;Pten-het;p53-het and control Pten-het;p53-het mice. In the absence of c-MYC expression heterozygous deletion of Pten and p53 resulted only in PIN with a low penetrance (Figures 1, 2C and 5). However, in c-MYC+;Pten-het;p53-het mice with concurrent focal c-MYC expression, we observed focal heterogeneous lesions including PIN, well-differentiated, moderately-differentiated and poorly-differentiated prostate adenocarcinoma (Figures 1, 2C and 5). The lesions appear to start focally, the neoplastic cells are luminal, AR-positive, without neuroendocrine differentiation and the invasive process is distinctly clear (Figures 5 and 6). Remarkably the PIN and cancer lesions that develop in these animals showed heterogeneous morphology (Figure 5C) suggesting that the lesions contain distinct combinations of genetic abnormalities. Thus this model captures one of the key features of human prostate cancer, i.e. histopathological heterogeneity.
Figure 5. c-MYC+;Pten-het;p53-het mice develop heterogeneous prostate cancer.

(A) Gross images of prostates of Pten-het;p53-het (a) and c-MYC+;Pten-het;p53-het (b) mice. (B) H&E stains show representative pathology of the mouse prostates. Note that only older (33–46 weeks) Pten-het;p53-het mouse prostates developed mPIN lesions (arrows in `a') while focal invasive (arrow in `b') or poorly differentiated cancer developed in c-MYC+;Pten-het;p53-het mouse prostates. Inset in `b' shows high power image of focal invasion. (C) Heterogeneity in mPIN/cancer lesions of c-MYC+;Pten-het;p53-het mouse prostates. Note lesions marked with arrows and arrowheads showing distinct histology. (`b' and `c' are enlarged portions of the gland shown in `a' while `e' and `f" are enlarged portions of gland shown in `d'). Scale bars: 1cm in “A”, 100μm in “B” and “C”.
Figure 6. Androgen receptor and synaptophysin expression in mouse prostate tumors.

Top, Androgen receptor, (AR) expression is present as brown nuclear and nuclear/cytoplasmic staining in mutant mouse prostate tumors. Control is a sample without primary antibody. Bottom, Neuroendocrine marker synaptophysin expression (brown) is grossly absent in mouse prostate tumors. Control is a MYC/Pim1-expressing tumor used as a positive control. Scale bars, 100μm.
To determine the rates at which Pten and p53 are lost during the progression of these c-MYC-initiated lesions, we used immunofluorescence-guided LCM followed by gene copy number analysis. We stained serial sections from c-MYC+;Pten-het;p53-het mice for c-MYC, Pten and H&E for LCM (Figure 7). All lesions analyzed demonstrated c-MYC expression. We determined Pten and p53 gene copy numbers by qPCR with DNA isolated following LCM from a total of 60 PIN and cancer foci (Tables 1 and S1). Overall, Pten copy loss was observed in 60% of the PIN and cancer lesions while p53 was lost in 40% of the lesions (Table 1, Figure 7E). Notably, the rate of Pten copy number loss is significantly higher than that of p53 loss in PIN lesions (50% vs. 29.2%), while cancer lesions showed equivalent rates of Pten and p53 loss (Table 1, Figure 7D). Furthermore, samples with p53 loss were subsumed in those with Pten loss with two exceptions (samples S35 and S76 in Table 1). These results indicate a higher rate of Pten loss compared to p53 loss during mouse prostate tumor progression.
We were also able to correlate loss of Pten protein expression in the same prostatic glands to loss of Pten copy number (Figure 7A, B). There were more lesions with loss of Pten expression than with Pten loss of copy number (Figure 7B). Thus, only 70.6% (36/51) of the lesions with loss of Pten expression showed evidence for loss of Pten copy number as well (Figure 7B). For example, in Figure 7A, while both lesions S3 and S4 displayed loss of Pten expression, only S4 also showed loss of Pten gene copy. While it is difficult to completely exclude the possibility of stromal contamination of LCM material, these results may also indicate the fact that loss of Pten protein precedes genetic loss of Pten DNA, through epigenetic mechanisms including promoter methylation (Cheung et al., 2004; Wang et al., 2007) or post-transcriptional/-translational control of Pten mRNA/protein (Sansal & Sellers, 2004).
Discussion
Our model of prostate cancer based on conditional focal c-MYC expression in the mouse prostate epithelium recapitulates several salient aspects of the human disease. First, all the three genes we focused on, i.e. c-MYC, Pten and p53 are frequently involved in human prostate cancer, with c-MYC overexpression being the most early and most frequent alteration of the three genes (Gurel et al., 2008; Taylor et al., 2010). Second, c-MYC+ cells in this model expand over time to form a field of histologically normal, c-MYC-overexpressing cells that are sensitized to the effects of further tumorigenic mutations, specifically loss of one or both alleles of Pten or p53. The fact that histologically normal-appearing tissue may harbor cancer-promoting alterations raises questions about the appropriateness of using so-called “normal adjacent prostate” as a control in molecular studies aimed at deciphering differences between cancer and normal tissues. Third, in the c-MYC+;Pten-het;p53-het model, PIN and cancer lesions arise focally and are histologically heterogeneous, even within the same glands. This most likely reflects the genetic heterogeneity of lesions, as c-MYC+;Pten-deficient lesions are histologically quite distinct from c-MYC+;p53-deficient lesions. Fourth the tumors that arise in this model are adenocarcinomas like the majority of human prostate cancers, retaining androgen receptor expression with no evidence of significant neuroendocrine differentiation.
The c-MYC+;Pten-het;p53-het model provided a unique opportunity to examine the rate at which distinct TSGs are lost during prostate tumor progression. The heterozygosity in Pten and p53 facilitates analysis of TSG pathway inactivation, making it more likely that the tumors will select loss of the wild type TSG allele as a means of inactivating the pathway, rather than mutations in other components of the pathway that may have the same functional outcome. Indeed, our finding that advanced tumors in this model uniformly show loss of Pten and p53 genes validates this approach. In human tumors, evidence for a preferred order in which mutations in cancer genes develop during clonal progression have been deduced by examining the mutation frequencies for various genes at different stages of tumor progression and the rate in which mutations in specific genes co-occur (Fearon & Vogelstein, 1990); (Yeang et al., 2008).
Using, LCM we examined a large number of PIN and cancer lesions for status of the wild type Pten and p53 alleles in c-MYC+;Pten-het;p53-het mice and found clear evidence for a preference for the loss of Pten prior to p53. Examination of human samples supported with this conclusion. These results indicate that while the mutations involved in tumor initiation may arise stochastically, the nature of the subsequent genetic alterations selected for during clonal evolution may be constrained by the nature of the preceding mutation. Thus, c-MYC overexpressing cells tend to lose Pten over p53 because loss of Pten provides greater selective advantage to the tumor cell than p53 loss (Figure 8). Additionally, c-MYC overexpression in our model does not activate p53, meaning there is no pressure on the c-MYC+ cells to inactivate the p53 pathway. Once Pten is lost however, the p53 pathway is strongly activated (Chen et al., 2005; Kim et al., 2009). In the context of c-MYC overexpression in our model, we have shown that the p53 response is shifted from senescence to apoptosis because c-MYC represses the p53 target gene p21Cip1 (Kim et al., 2009). Thus Pten loss, even though it provides several advantages to the tumor cell also activates a tumor-restraining barrier in the form of p53 activation. This provides selective pressure for inactivation of p53. Indeed we found that advanced prostate cancers in c-MYC+;Pten-het;p53-het mice show almost uniform evidence of loss of the wild type p53 allele.
Figure 8. Model for loss ofn Pten and p53 in c-MYC-initiated prostate cancer.

c-MYC expression in the prostatic epithelium provokes a mild increase in proliferation and apoptosis. A majority of the c-MYC-expressing cells show no histological abnormality. At this stage, the p53 pathway is not activated. Next, c-MYC-expressing cells preferentially lose the Pten tumor suppressor leading to increased proliferation and progression to cancer. However, at this stage apoptosis is also evident due to activation of p53 pathway upon Pten loss. Selective pressure to avoid apoptosis promotes loss of p53, allowing cells to overcome apoptosis, resulting in development of aggressive prostate cancer.
It is important to point out that our Z-MYC model differs from other prostate-Myc transgenic models that have been analyzed. For example, De Marzo and colleagues (Iwata et al., 2010) recently analyzed Lo-Myc and Hi-Myc transgenic mice developed by the Sawyers group (Ellwood-Yen et al., 2003) and deduced that MYC overexpression leads to an immediate change in cellular morphology consistent with transformation. We do not see a similar effect in our prostate Z-MYC model, possibly due to differences in expression level or genetic strain differences.
Our study has not directly addressed the cell of origin of the tumors in this model. Our previous analysis of the PBCre4;Z-MYC model has shown that c-MYC is induced focally in the prostatic luminal epithelial cell compartment (Kim et al., 2009). The specific identity of the cell of origin of the tumors that develop in this model awaits further study. Nonetheless, it may be possible, once the rules governing the timing and rate at which mutations occur during tumor progression are understood, to exploit them in individualized chemopreventive or therapeutic strategies to the detriment of the tumor cell. For example, c-MYC+;Pten-deficient tumor cells are under pressure to avoid a strong p53-dependent apoptotic response, and this knowledge could be exploited. Such efforts will be crucially dependent on the use of accurate in vivo models of human cancer like the c-MYC+;Pten-het;p53-het mouse model described here.
Supplementary Material
Acknowledgements
We would like to thank the members of the Abdulkadir Lab for helpful discussions. This work was supported by grants CA094858 and CA123484 (SAA) from the National Cancer Institute of the National Institutes of Health.
Abbreviations
- PIN
prostatic intraepithelial neoplasia
- LCM
laser-captured microdissection
- qPCR
quantitative polymerase chain reaction
- BHQ
Black Hole Quencher
Footnotes
Disclosure of Potential Conflicts of Interest
The authors declare no conflict of interest.
References
- Abdulkadir SA, Carbone JM, Naughton CK, Humphrey PA, Catalona WJ, Milbrandt J. Hum Pathol. 2001a;32:935–9. doi: 10.1053/hupa.2001.27102. [DOI] [PubMed] [Google Scholar]
- Abdulkadir SA, Qu Z, Garabedian E, Song SK, Peters TJ, Svaren J, Carbone JM, Naughton CK, Catalona WJ, Ackerman JJ, Gordon JI, Humphrey PA, Milbrandt J. Nat Med. 2001b;7:101–7. doi: 10.1038/83231. [DOI] [PubMed] [Google Scholar]
- Andreoiu M, Cheng L. Hum Pathol. 41:781–93. doi: 10.1016/j.humpath.2010.02.011. [DOI] [PubMed] [Google Scholar]
- Bookstein R, MacGrogan D, Hilsenbeck SG, Sharkey F, Allred DC. Cancer Res. 1993;53:3369–73. [PubMed] [Google Scholar]
- Brooks JD, Bova GS, Ewing CM, Piantadosi S, Carter BS, Robinson JC, Epstein JI, Isaacs WB. Cancer Res. 1996;56:3814–22. [PubMed] [Google Scholar]
- Carver BS, Tran J, Gopalan A, Chen Z, Shaikh S, Carracedo A, Alimonti A, Nardella C, Varmeh S, Scardino PT, Cordon-Cardo C, Gerald W, Pandolfi PP. Nat Genet. 2009;41:619–24. doi: 10.1038/ng.370. [DOI] [PMC free article] [PubMed] [Google Scholar]
- Chen Z, Trotman LC, Shaffer D, Lin HK, Dotan ZA, Niki M, Koutcher JA, Scher HI, Ludwig T, Gerald W, Cordon-Cardo C, Pandolfi PP. Nature. 2005;436:725–30. doi: 10.1038/nature03918. [DOI] [PMC free article] [PubMed] [Google Scholar]
- Cheng L, Song SY, Pretlow TG, Abdul-Karim FW, Kung HJ, Dawson DV, Park WS, Moon YW, Tsai ML, Linehan WM, Emmert-Buck MR, Liotta LA, Zhuang Z. J Natl Cancer Inst. 1998;90:233–7. doi: 10.1093/jnci/90.3.233. [DOI] [PubMed] [Google Scholar]
- Cheung TH, Lo KW, Yim SF, Chan LK, Heung MS, Chan CS, Cheung AY, Chung TK, Wong YF. Gynecol Oncol. 2004;93:621–7. doi: 10.1016/j.ygyno.2004.03.013. [DOI] [PubMed] [Google Scholar]
- Chi SG, deVere White RW, Meyers FJ, Siders DB, Lee F, Gumerlock PH. J Natl Cancer Inst. 1994;86:926–33. doi: 10.1093/jnci/86.12.926. [DOI] [PubMed] [Google Scholar]
- Dinjens WN, van der Weiden MM, Schroeder FH, Bosman FT, Trapman J. Int J Cancer. 1994;56:630–3. doi: 10.1002/ijc.2910560504. [DOI] [PubMed] [Google Scholar]
- Dong JT, Li CL, Sipe TW, Frierson HF., Jr. Clin Cancer Res. 2001;7:304–8. [PubMed] [Google Scholar]
- Effert PJ, McCoy RH, Walther PJ, Liu ET. J Urol. 1993;150:257–61. doi: 10.1016/s0022-5347(17)35458-7. [DOI] [PubMed] [Google Scholar]
- Ellwood-Yen K, Graeber TG, Wongvipat J, Iruela-Arispe ML, Zhang J, Matusik R, Thomas GV, Sawyers CL. Cancer Cell. 2003;4:223–38. doi: 10.1016/s1535-6108(03)00197-1. [DOI] [PubMed] [Google Scholar]
- Fearon ER, Vogelstein B. Cell. 1990;61:759–67. doi: 10.1016/0092-8674(90)90186-i. [DOI] [PubMed] [Google Scholar]
- Feilotter HE, Nagai MA, Boag AH, Eng C, Mulligan LM. Oncogene. 1998;16:1743–8. doi: 10.1038/sj.onc.1200205. [DOI] [PubMed] [Google Scholar]
- Fenic I, Franke F, Failing K, Steger K, Woenckhaus J. J Pathol. 2004;203:559–66. doi: 10.1002/path.1545. [DOI] [PubMed] [Google Scholar]
- Fernandez-Marcos PJ, Abu-Baker S, Joshi J, Galvez A, Castilla EA, Canamero M, Collado M, Saez C, Moreno-Bueno G, Palacios J, Leitges M, Serrano M, Moscat J, Diaz-Meco MT. Proc Natl Acad Sci U S A. 2009;106:12962–7. doi: 10.1073/pnas.0813055106. [DOI] [PMC free article] [PubMed] [Google Scholar]
- Greene DR, Wheeler TM, Egawa S, Weaver RP, Scardino PT. Br J Urol. 1991;68:499–509. doi: 10.1111/j.1464-410x.1991.tb15394.x. [DOI] [PubMed] [Google Scholar]
- Grizzle WE, Myers RB, Arnold MM, Srivastava S. J Cell Biochem Suppl. 1994;19:259–66. [PubMed] [Google Scholar]
- Groszer M, Erickson R, Scripture-Adams DD, Lesche R, Trumpp A, Zack JA, Kornblum HI, Liu X, Wu H. Science. 2001;294:2186–9. doi: 10.1126/science.1065518. [DOI] [PubMed] [Google Scholar]
- Gurel B, Iwata T, Koh CM, Jenkins RB, Lan F, Van Dang C, Hicks JL, Morgan J, Cornish TC, Sutcliffe S, Isaacs WB, Luo J, De Marzo AM. Mod Pathol. 2008;21:1156–67. doi: 10.1038/modpathol.2008.111. [DOI] [PMC free article] [PubMed] [Google Scholar]
- Han B, Mehra R, Lonigro RJ, Wang L, Suleman K, Menon A, Palanisamy N, Tomlins SA, Chinnaiyan AM, Shah RB. Mod Pathol. 2009;22:1083–93. doi: 10.1038/modpathol.2009.69. [DOI] [PMC free article] [PubMed] [Google Scholar]
- Iwata T, Schultz D, Hicks J, Hubbard GK, Mutton LN, Lotan TL, Bethel C, Lotz MT, Yegnasubramanian S, Nelson WG, Dang CV, Xu M, Anele U, Koh CM, Bieberich CJ, De Marzo AM. PLoS One. 2010;5:e9427. doi: 10.1371/journal.pone.0009427. [DOI] [PMC free article] [PubMed] [Google Scholar]
- Jonkers J, Meuwissen R, van der Gulden H, Peterse H, van der Valk M, Berns A. Nat Genet. 2001;29:418–25. doi: 10.1038/ng747. [DOI] [PubMed] [Google Scholar]
- Kim J, Eltoum IE, Roh M, Wang J, Abdulkadir SA. PLoS Genet. 2009;5:e1000542. doi: 10.1371/journal.pgen.1000542. [DOI] [PMC free article] [PubMed] [Google Scholar]
- Konishi N, Hiasa Y, Hayashi I, Matsuda H, Tsuzuki T, Ming T, Kitahori Y, Shiraishi T, Yatani R, Shimazaki J. Jpn J Cancer Res. 1995;86:57–63. doi: 10.1111/j.1349-7006.1995.tb02988.x. [DOI] [PMC free article] [PubMed] [Google Scholar]
- McCall P, Witton CJ, Grimsley S, Nielsen KV, Edwards J. Br J Cancer. 2008;99:1296–301. doi: 10.1038/sj.bjc.6604680. [DOI] [PMC free article] [PubMed] [Google Scholar]
- McMenamin ME, Soung P, Perera S, Kaplan I, Loda M, Sellers WR. Cancer Res. 1999;59:4291–6. [PubMed] [Google Scholar]
- Mellon K, Thompson S, Charlton RG, Marsh C, Robinson M, Lane DP, Harris AL, Horne CH, Neal DE. J Urol. 1992;147:496–9. doi: 10.1016/s0022-5347(17)37287-7. [DOI] [PubMed] [Google Scholar]
- Mentor-Marcel R, Lamartiniere CA, Eltoum IE, Greenberg NM, Elgavish A. Cancer Res. 2001;61:6777–82. [PubMed] [Google Scholar]
- Mirchandani D, Zheng J, Miller GJ, Ghosh AK, Shibata DK, Cote RJ, Roy-Burman P. Am J Pathol. 1995;147:92–101. [PMC free article] [PubMed] [Google Scholar]
- Navone NM, Troncoso P, Pisters LL, Goodrow TL, Palmer JL, Nichols WW, von Eschenbach AC, Conti CJ. J Natl Cancer Inst. 1993;85:1657–69. doi: 10.1093/jnci/85.20.1657. [DOI] [PubMed] [Google Scholar]
- Nesslinger NJ, Shi XB, deVere White RW. Cancer Res. 2003;63:2228–33. [PubMed] [Google Scholar]
- Preacher K. 2001.
- Qian J, Hirasawa K, Bostwick DG, Bergstralh EJ, Slezak JM, Anderl KL, Borell TJ, Lieber MM, Jenkins RB. Mod Pathol. 2002;15:35–44. doi: 10.1038/modpathol.3880487. [DOI] [PubMed] [Google Scholar]
- Roh M, Kim J, Song C, Wills M, Abdulkadir SA. Genesis. 2006;44:447–53. doi: 10.1002/dvg.20235. [DOI] [PubMed] [Google Scholar]
- Sansal I, Sellers WR. J Clin Oncol. 2004;22:2954–63. doi: 10.1200/JCO.2004.02.141. [DOI] [PubMed] [Google Scholar]
- Schmitz M, Grignard G, Margue C, Dippel W, Capesius C, Mossong J, Nathan M, Giacchi S, Scheiden R, Kieffer N. Int J Cancer. 2007;120:1284–92. doi: 10.1002/ijc.22359. [DOI] [PubMed] [Google Scholar]
- Sircar K, Yoshimoto M, Monzon FA, Koumakpayi IH, Katz RL, Khanna A, Alvarez K, Chen G, Darnel AD, Aprikian AG, Saad F, Bismar TA, Squire JA. J Pathol. 2009;218:505–13. doi: 10.1002/path.2559. [DOI] [PubMed] [Google Scholar]
- Slaughter DP, Southwick HW, Smejkal W. Cancer. 1953;6:963–8. doi: 10.1002/1097-0142(195309)6:5<963::aid-cncr2820060515>3.0.co;2-q. [DOI] [PubMed] [Google Scholar]
- Suzuki H, Freije D, Nusskern DR, Okami K, Cairns P, Sidransky D, Isaacs WB, Bova GS. Cancer Res. 1998;58:204–9. [PubMed] [Google Scholar]
- Taylor BS, Schultz N, Hieronymus H, Gopalan A, Xiao Y, Carver BS, Arora VK, Kaushik P, Cerami E, Reva B, Antipin Y, Mitsiades N, Landers T, Dolgalev I, Major JE, Wilson M, Socci ND, Lash AE, Heguy A, Eastham JA, Scher HI, Reuter VE, Scardino PT, Sander C, Sawyers CL, Gerald WL. Cancer Cell. 2010;18:11–22. doi: 10.1016/j.ccr.2010.05.026. [DOI] [PMC free article] [PubMed] [Google Scholar]
- Villers A, McNeal JE, Freiha FS, Stamey TA. Cancer. 1992;70:2313–8. doi: 10.1002/1097-0142(19921101)70:9<2313::aid-cncr2820700917>3.0.co;2-t. [DOI] [PubMed] [Google Scholar]
- Voeller HJ, Sugars LY, Pretlow T, Gelmann EP. J Urol. 1994;151:492–5. doi: 10.1016/s0022-5347(17)35000-0. [DOI] [PubMed] [Google Scholar]
- Wang L, Wang WL, Zhang Y, Guo SP, Zhang J, Li QL. Hepatol Res. 2007;37:389–396. doi: 10.1111/j.1872-034X.2007.00042.x. [DOI] [PubMed] [Google Scholar]
- Wang S, Gao J, Lei Q, Rozengurt N, Pritchard C, Jiao J, Thomas GV, Li G, Roy-Burman P, Nelson PS, Liu X, Wu H. Cancer Cell. 2003;4:209–21. doi: 10.1016/s1535-6108(03)00215-0. [DOI] [PubMed] [Google Scholar]
- Wang SI, Parsons R, Ittmann M. Clin Cancer Res. 1998;4:811–5. [PubMed] [Google Scholar]
- Wu X, Wu J, Huang J, Powell WC, Zhang J, Matusik RJ, Sangiorgi FO, Maxson RE, Sucov HM, Roy-Burman P. Mech Dev. 2001;101:61–9. doi: 10.1016/s0925-4773(00)00551-7. [DOI] [PubMed] [Google Scholar]
- Yeang CH, McCormick F, Levine A. Faseb J. 2008;22:2605–22. doi: 10.1096/fj.08-108985. [DOI] [PubMed] [Google Scholar]
- Yoshimoto M, Cunha IW, Coudry RA, Fonseca FP, Torres CH, Soares FA, Squire JA. Br J Cancer. 2007;97:678–85. doi: 10.1038/sj.bjc.6603924. [DOI] [PMC free article] [PubMed] [Google Scholar]
Associated Data
This section collects any data citations, data availability statements, or supplementary materials included in this article.