

Abstract
TGFβ superfamily ligands, including activin and myostatin, modulate body composition, islet function, and glucose homeostasis. Their bioactivity is controlled by the antagonists follistatin (FST) and follistatin like-3 (FSTL3). The hypothesis tested was that FST and FSTL3 have distinct roles in regulating body composition, glucose homeostasis and islet function through regulation of activin and myostatin bioactivity. Three genetic mutant mouse lines were created. FSTL3 knockout (FSTL3 KO), a mouse line producing only the FST288 isoform (FST288-only) and a double mutant (2xM) in which the lines were crossed. FST288-only males were lighter that WT littermates while FSTL3 KO and 2xM males had reduced perigonadal fat pad weights. However, only 2xM mice had increased whole body fat mass and decreased lean mass by qNMR. Fasting glucose levels in FSTL3 WT and KO mice were lower than FST mice in younger animals but were higher in older mice. Serum insulin and pancreatic insulin content in 2xM mice was significantly elevated over other genotypes. Nevertheless, 2xM mice were relatively insulin resistant and glucose intolerant compared to FST288-only and WT mice. Fractional islet area and proportion of β-cells/islet were increased in FSTL3 KO and 2xM, but not FST288-only mice. Despite their larger size, islets from FSTL3 KO and 2xM mice were not functionally enhanced compared to WT mice. These results demonstrate that body composition and glucose homeostasis are differentially regulated by FST and FSTL3 and that their combined loss is associated with increased fat mass and insulin resistance despite elevated insulin production.
Introduction
Obesity results from caloric consumption that exceeds utilization, the excess being stored primarily as lipid in adipocytes. Although the precise mechanisms are still debated (1), obesity is often associated with insulin resistance, type 2 diabetes, fatty liver disease and metabolic syndrome (2), creating one of the most pressing medical issues in terms of morbidity, mortality, and health care expenditures.
Activin and myostatin are members of the TGFβ superfamily that have critical activities during embryonic development, but also have emerging roles regulating fat and muscle mass along with glucose homeostasis in adults (3, 4). Activin promotes proliferation and inhibits differentiation of primary preadipocytes (5) and preadipocyte cell lines (6, 7) and also enhances glucose stimulated insulin secretion (GSIS) (8, 9). Myostatin regulates both muscle and fat mass and also modulates glucose homeostasis (4, 10, 11). The bioactivity of activin and myostatin is regulated by the high affinity antagonists follistatin (FST) and follistatin like-3 (FSTL3) (12). FST is translated as three protein isoforms that differ biochemically, as well as in their distribution and actions (12). The FST288 isoform binds to cells and is found primarily in or associated with tissues whereas the FST315 isoform is found primarily in the circulation and the FST303 isoform in the gonads (13). On the other hand, only one isoform of FSTL3 is synthesized that does not bind to cell surfaces and has been purified from mouse and human serum in a complex with myostatin (15). FST and FSTL3 are synthesized in a partially overlapping set of tissues suggesting that they have some shared and some distinct biological actions (13, 14).
FST was recently identified as an adipokine with reduced mRNA and secreted protein in human fat biopsy cultures from obese relative to normal weight subjects (16). Moreover, FST neutralized the inhibitory actions of myostatin on adipocyte differentiation (16, 17) suggesting that altered FST levels might regulate fat mass in vivo. We recently demonstrated that FSTL3 null mice have a metabolic phenotype that included enlarged islets, β-cell hyperplasia and enhanced glucose tolerance and insulin sensitivity, along with reduced perigonadal visceral fat pad weight, suggesting that increased activin and/or myostatin bioactivity resulting from FSTL3 deletion specifically altered an abdominal visceral fat depot that is associated with enhanced glucose homeostasis (18).
FST null mice are perinatally lethal (19) so it has not been possible to investigate potential roles for FST in regulating adult body composition and glucose homeostasis. To explore the hypothesis that FST and FSTL3 differentially regulate adiposity and glucose homeostasis, we have now created a mouse model in which only the tissue-binding FST288 isoform could be synthesized (FST288-only mice; (20)). In addition, we have crossed the FST288-only and FSTL3 KO lines to obtain double mutant mice(2xM) and evaluated the effects of losing FST, FSTL3, or both antagonists on glucose homeostasis, adiposity, and muscle mass. Our results demonstrate that some phenotypes can be attributed to loss of one of the two antagonists while other phenotypes show compensation with increased magnitude of the effect when both antagonists are deleted. Interestingly, the reduction of perigonadal visceral fat is present in both FSTL3 KO and 2xM mice that have opposite glucose tolerance and insulin sensitivity characteristics, suggesting that this visceral fat pad might not be directly linked to insulin sensitivity. These results are consistent with the hypothesis that FST and FSTL3 play important, partially non-overlapping roles in regulating body composition and glucose homeostasis.
Methods and Procedures
Mouse genotypes and analysis of whole body and organ phenotypes
Global FSTL3 KO mice were produced as previously described (18) and maintained in the original 129S4/SvJae × C57BL/6J × FVB mixed background. FST288-only mice were created as previously described (19) and were maintained in the 129S4/SvJae × C57BL/6J mixed background. The 2xM line was created by crossing these two single mutant lines and is also in the mixed background. To control for the mixed backgrounds of these lines, most studies utilized WT and homozygote littermates selected from heterozygous breeding pairs. To differentiate between background effects and phenotypes due only to the mutated gene, FSTL3 KO mice were backcrossed onto the C57BL6 background for 10 generations (C57-FSTL3 WT and KO). Sufficient animals were available for body weight, organ weight and body composition experiments (Figs 1 and 2), although preliminary analysis of other phenotypes indicate that alterations observed in mixed background FSTL3 KO mice are faithfully recapitulated in the homogeneous C57 background. Animal use protocols were approved by Baystate Medical Center's IACUC. Body weight and organ analyses were conducted on males representing all 7 genotypes ranging in age from 2-12 (mean = 9) months.
Figure 1.

Analysis of body and organ weights.
A) Body weights of males used for studies over the past 4 years representing a range of ages from 2-15 months and a mean of 9 months that was not different between genotypes (see Supplemental Figure 1 for distribution). FST288-only mice weighed significantly less than WT littermates as well as FSTL3 WT and KO mice. C57 FSTL3 WT and KO males were significantly lighter than mixed background FSTL3 WT and KO mice. N = 60, 56, 51, 71, 129, 53, and 44 for FST WT, 288, 2xM, FSTL3 WT and KO, and C57 FSTL3 WT and KO respectively. B) Quadriceps weight for subset of males from 1A normalized by body weight and expressed as a ratio. No differences were detected. N = 28, 10, 18, 38, 67,11, 11 for FST WT, 288, 2xM, FSTL3 WT and KO, and C57 FSTL3 WT and KO respectively. C) Liver weight divided by body weight in subset of males from 1A. No differences were detected. N = 35, 40, 51, 31, 36, 41, 40 for FST WT, 288, 2xM, FSTL3 WT and KO, and C57 FSTL3 WT and KO respectively. D) Weight of perigonadal visceral fat pad normalized to body weight. Fat pad weight was reduced in FSTL3 KO, 2xM, and C57-FSTL3 KO compared to their WT controls, but not in FST288-only mice. 2xM effects are not additive but rather are equal to single mutant lines. N = 32, 37, 34, 33, 67, 22, 23 for FST WT, 288, 2xM, FSTL3 WT and KO, and C57 FSTL3 WT and KO respectively. E) Pancreas weights normalized to body weight. Pancreas weights were significantly elevated in FST288-only and 2xM lines, but not in FSTL3 KO mice in either background. At least some of this weight may represent increased fat stores within the pancreas of these two lines. N = 42, 46, 50, 34, 67, 23, 28 for FST WT, 288, 2xM, FSTL3 WT and KO, and C57 FSTL3 WT and KO respectively. * = p < 0.05; ** = p < 0.01; *** = p < 0.001.
Figure 2.

Analysis of whole body composition by qNMR.
Body composition was analyzed by quantitative NMR (qNMR) in males ranging from 2-12 months of age. A) Fat mass was normalized to body weight and expressed as percent. No differences between single mutants and their WT littermates were detected but significantly increased abdominal fat was observed in 2xM mice. C57-FSTL3 WT and KO males, in which the FSTL3 KO mutation was bred into the C57BL6/j background, had significantly less body fat than the mixed background FSTL3 WT and KO mice. B) Lean mass was normalized to body weight and expressed as percent. 2xM mice had significantly less muscle than the other genotypes. C57-FSTL3 KO males had significantly greater lean mass compared to mixed background FSTL3 KO males. C) Body weights for mice in A and B. No differences in mean BW or range was present between the genotypes. D) Age of mice analyzed in A and B. There were no significant differences in mean age for any genotype and the range completely overlapped, indicating that these mice were age-matched for this analysis. N = 20, 27, 33, 13, 14, 37, and 30 for FST WT, 288, 2xM, FSTL3 WT, KO, C57-FSTL3 WT and C57-FSTL3 KO respectively. * = p < 0.05; ** = p < 0.01; *** = p < 0.001.
Whole body composition analysis by qNMR
An Echo MRI-100 (Echo Model Systems, Houston TX) was used to analyze body composition by quantitative NMR on males ranging in age from 2-12 months. The mean and distribution of both age and weight were not different between the genotypes.
Analysis of serum glucose and insulin
Random glucose measurements were made during the day while fasting measurements were made in the morning after an overnight fast. Glucose was quantitated using a handheld glucometer and a drop of tail blood while insulin was assessed by ultrasensitive ELISA with mouse insulin standard (Crystal Chem Inc, Downers Grove IL).
Glucose and insulin tolerance tests (GTT and ITT)
Individual experiments were designed with groups of age-matched males of different genotypes as previously described (18).
Islet analysis
Because we previously detected maximal differences in islet size in 9 month old FSTL3 KO vs. WT mice (18), we focused on males that were 9 +/- 3 months. H&E stained pancreas sections representing the largest portion of the pancreas containing a major duct and >15 islets was analyzed. Inclusion of additional sections for some specimens did not alter the combined results. Islet areas were determined and summed for the entire section and fractional area calculated by dividing by total pancreas area for that section. To calculate β-cell mass, fractional area was multiplied by pancreas weight. Proliferation of β-cells was determined by administering BrdU (Zymed; 10ul/g) to males that were sacrificed 6 hours later with pancreata processed as described above except that sections were stained for BrdU (Anti-BrdU, Accurate Chemical). Data is expressed as % total β-cells positive for BrdU. To analyze change in islet area with age, the area of all islets > 50 um was summed for 3 sections/pancreas taken at least 100 um apart. For islet composition studies, adjacent sections were stained for insulin or glucagon as previously described (18) with the number of α- and β-cells in each islet expressed as a % of total cells in that islet. The percentage/animal was the mean from all analyzed islets from its pancreas.
Islet Isolation
Collagenase P enzyme solution (1.2-1.4 mg/mL; Roche Diagnostics Corporation, Indianapolis, IN) was injected to fully distend the donor pancreas. After digestion, islets were gradient purified and then handpicked. Cells were cultured with RPMI-1640 solution with 10% heat-inactivated fetal bovine serum and 1% penicillin-streptomycin (RPMI-1640, FBS and P-S all from Mediatech, Inc. Manassas, VA) in a 5% CO2 incubator. Islets from 4 separate isolations were utilized.
Glucose Stimulated Insulin Secretion Assay
Islets were equilibrated in low glucose solution (2.8mM) for one hour. Ten size matched islets (in triplicate samples) were placed in 12um Millicell Cell Culture PCF inserts (Millipore Corporation, Burlington, MA) in 24 well plates. Fresh, low glucose solution was added for 2 hours followed by moving the insert with the islets into high glucose solution (16.7mM) for 2 hours. Insulin secretion was determined by ELISA (Mercodia, Winston Salem, NC) and raw data transformed as fold-difference from the average control in low glucose so that experimental replicates could be combined. The stimulation index was calculated from the raw data and a value >1 indicated functional islets.
Statistics
Results were analyzed by ANOVA (with Bonferroni post hoc test) and results with p < 0.05 were considered significant.
Results
Regulation of body weight and fat mass by FST and FSTL3
Alteration or elimination of FST and/or FSTL3 would be expected to reduce body and muscle weight based on results from myostatin overexpression and administration experiments (21). We therefore analyzed these parameters in a large cohort of males representing FST288-only mice and their WT littermates, FSTL3 KO mice and their WT littermates, double mutant (2xM) mice, and FSTL3 WT and KO mice in the C57Bl6 background. These mice ranged in age from 2-15 months with an overlapping distribution (Supplementary Figure 1) and a mean of 9 months that was not significantly different between genotypes. Body weights of FST288-only males were reduced by 17% (p < 0.01) compared to their WT littermates (Figure 1A). In contrast, body weights of FSTL3 KO mice were not different from their WT littermates, in agreement with previous observations (18, 22). Body weights for 2xM males were not different from FST288-only or FST WT males but were significantly lower than FSTL3 KO or WT males, suggesting that loss of FST315 and FST303 isoforms has a greater effect on body weight than loss of FSTL3. However, there may be some contribution from the FSTL3 background since C57 FSTL3 WT and KO mice are both significantly lighter than mixed background FSTL3 KO mice and not different from FST or 2xM mice. Nevertheless, the reduced body weight of FST288-only mice appears to be induced by the genetic modification.
No significant difference in quadriceps weight between the genotypes was detected (Fig 1B). Similarly, there was no significant difference in liver weights (Fig 1C). Perigonadal fat pad mass was reduced by 25% (p < 0.05) 2xM mice, similar in magnitude to that observed in FSTL3 KO mice compared to their WT littermates. (Fig 1D). This reduced perigonadal fat pad weight was faithfully reproduced, and even exaggerated, in FSTL3 KO mice in the C57 background indicating that this phenotype is due to the genetic mutation and not the mixed background. These results also demonstrate that loss of FSTL3 alters visceral fat accumulation but the magnitude is not increased in the 2xM line, indicating that there is no compensation and that this is an FSTL3-mediated phenotype. Pancreas weights were increased by 38% (p < 0.05) in FST288-only and 2xM mice relative to FST WT and FSTL3 WT and KO in both backgrounds (Fig 1E), indicating that this phenotype is regulated by FST but not FSTL3.
A group of males (2-12 month, mean 8-9 months) from all three mutant lines were analyzed by qNMR for body composition. Fat mass as percent of body mass was not different in single mutant animals compared to their WT littermates but was significantly increased by 33% in 2xM males compared to both single mutants and WT controls. Fat mass was not different between C57-FSTL3 WT and KO males, but was significantly reduced in the C57 background compared to the mixed background and similar to FST288 WT and FST288-only males (Fig 2A). Consistent with these observations, lean mass was decreased by 15% in 2xM mice relative to other genotypes while lean mass was increased by 6% in C57-FSTL3 KO mice compared to C57 WT mice (Fig 2B). Mean body weights and ages, as well as their respective distributions, were not different between the genotypes for this group of males (Fig 2C and D). These results indicate that whole body fat or lean mass is only affected by loss of both antagonists, suggesting that FSTL3 and FST compensate for each other in regulating activin and myostatin's effects on fat and/or lean mass.
Differential effects on glucose homeostasis in single and double mutants
Reduced visceral fat is associated with improved glucose homeostasis in animal models and humans (23, 24). To determine if reduced perigonadal fat pad weight had similar effects on single and double mutant mice, we analyzed random glucose levels in young (< 6 months) and older (> 6 months) mice. There were no differences in random glucose levels in males < 6 months of age (data not shown) but as the mice aged, random glucose levels increased for both FSTL3 WT and KO mice such that after 6 months, they were significantly elevated above FST288-only and 2xM males (Fig 3A). This was not due entirely to increased body weight since 2xM males weighed the same as FSTL3 WT and KO males but had reduced random glucose levels (Fig 3B). Fasting glucose was significantly lower in 2xM and FSTL3 KO males at < 6 months compared to FST WT or FST288-only whereas in older males (> 6 months), fasting glucose was significantly elevated in 2xM and FSTL3 WT males relative to both FST WT and 288-only males (Fig 3D). Young 2xM males were again distinct since their body weights were not different from FST WT and 288-only mice (Fig 3E) but their fasting glucose was not different from FSTL3 WT and KO mice. Fasting glucose in older mice may be more dependent on body weight since the body weights for FST288-only males > 6 months of age were significantly lower than other genotypes (Fig 3F) resulting in largely the same pattern as fasting glucose (3D) for these same animals. Nevertheless, like random glucose, fasting glucose increased in FSTL3 WT, KO, and 2xM mice as they aged. Random serum insulin concentrations were nearly 3-fold greater in 2xM males relative to FST WT and 288-only males and nearly 2-fold elevated relative to FSTL3 KO males (Fig 3G). However, while the body weights of 2xM males in which insulin levels were measured was greater than FST WT and 288-only males, they were not different from FSTL3 WT and KO males. Thus, circulating insulin levels are not dependent merely on body weight.
Figure 3.

Glucose homeostasis in WT and mutant males of different ages. A) Random glucose concentrations in males > 6 months of age. While there was no difference between FST288-only and FST WT or between FSTL3 KO and WT mice, both FSTL3 lines were significantly greater than either FST line and 2xM mice. N = 7, 9, 9, 17, 16 for FST WT, 288, 2xM, FSTL3 WT and KO respectively. B) Body weights for mice in 3A. Lower random glucose in FST lines may reflect reduced body weights compared to FSTL3 lines but 2xM mice were as heavy as FSTL3 mice but had random glucose levels like FST lines. C) Fasting glucose in young (< 6 month) FSTL3 WT, KO, and 2xM males is significantly lower than FST mice indicating that in younger mice, glucose homeostasis is enhanced in these lines relative to FST lines. N = 15, 7, 5, 28, 30 for FST WT, 288, 2xM, FSTL3 WT and KO, respectively. D) Body weights for mice in 3C showing that the weights of FSTL3 lines were greater than FST lines despite the lower fasting glucose. Thus, differences in body weights do not explain the glucose differences. E) Fasting glucose in older (> 6 months) males had the opposite pattern from younger males with FSTL3 WT and 2xM mice being greater than FST288 mice, suggesting that glucose tolerance is reduced in older FSTL3 and 2xM mice relative to FST288 mice where fasting glucose levels do not change as they age. N = 32, 31, 25, 9, 11 for FST WT, 288, 2xM, FSTL3 WT and KO, respectively. F) Body weights for mice in 3E suggesting that the elevation in fasting glucose in older FSTL3 WT, KO and 2xM mice might be related to increased body weight as they age relative to FST mice. G) Random circulating insulin levels in all males showing that serum insulin concentrations are elevated in 2xM mice relative to FST WT, FST288-only and FSTL3 KO mice. N = 13, 17, 21, 9, and 13 for FST WT, 288, 2xM, FSTL3 WT and KO, respectively. H) Body weights for mice in 3G showing that body weight alone cannot explain the serum insulin levels. * = p < 0.05; ** = p < 0.01; *** = p < 0.001.
Double mutant mice are insulin resistant and glucose intolerant
The increased fasting glucose and random insulin levels suggested that 2xM mice were relatively insulin resistant compared to FST WT and FST288-only mice. Interestingly, we had previously demonstrated that FSTL3 KO mice were more glucose tolerant and insulin sensitive than FSTL3 WT mice (18). To directly assess glucose tolerance in FST WT, FST288-only and 2xM mice, we compared groups of age matched young (< 6 months) and old (> 6 months) males using glucose tolerance tests (GTTs). Young 2xM mice were glucose intolerant relative to FST WT mice but not different from FST288-only males (Fig 4A). In older mice, FST WT and FST288-only males responded identically to glucose administration while 2xM males were significantly more glucose intolerant (Fig 4B). In insulin tolerance tests (ITTs), younger 2xM males were relatively insulin resistant compared to FST WT and FST288-only mice (Fig 4C) but this difference was not significant in older 2xM mice (Fig 4D). Thus, FST WT and FST288-only mice are distinct from FSTL3 WT, FSTL3 KO and 2xM mice in terms of glucose tolerance and insulin sensitivity, suggesting that FST and FSTL3 act through different mechanisms to regulate glucose homeostasis. Interestingly, serum insulin values at the 15 minute time point of the GTT were 3-fold higher in 2xM males compared to FST WT or FST288-only males suggesting that their β-cells were functionally enhanced (Fig 4E). This was supported by the finding that the 2xM mouse pancreas contained significantly more insulin compared to the other genotypes (Fig 4F).
Figure 4.
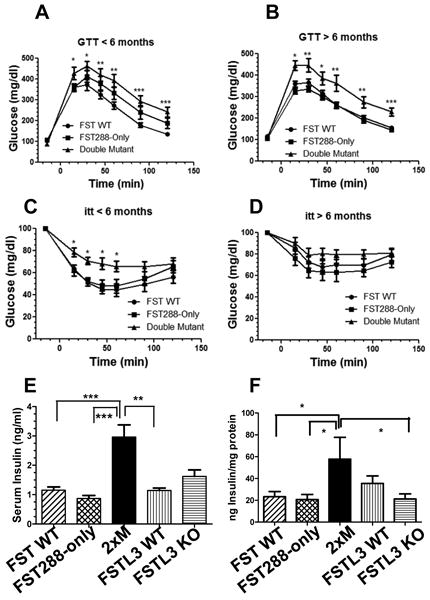
Dynamic glucose testing in WT and mutant males. A) GTT in younger (< 6 months) age and weight matched males. No difference between FST288 only and FST WT males was detected in response to administered glucose but 2xM mice were significantly less glucose tolerant. N = 14, 9, 10 for FST WT, 288-only and 2xM, respectively. B) GTT in age matched males > 6 months of age. Again, 2xM males are significantly less glucose tolerant compared to FST WT or 288-only males. 2xM mice are significantly heavier than FST mice at this age (33 vs. 45 g; and see Fig 3F and 3H). N = 17, 19, 11 for FST WT, 288-only and 2xM, respectively. C) ITT in weight matched younger (< 6 months) males showing relative insulin resistance in 2xM males compared to FST WT and 288-only even at these younger ages. N = 22, 13, and 9 for FST WT, 288-only and 2xM, respectively. D) ITT in older males (> 6 months) showing reduced response to insulin in 2xM mice compared to FST WT or FST288-only mice but this difference is no longer significant. However, at this age, 2xM mice are significantly heaver (45.1 vs. 37.3g, p < 0.01) than FST WT or FST288-only males. N = 9, 8, and 6 for FST WT, 288-only and 2xM, respectively. E) Serum insulin concentrations in older (> 6 month) males at the 15 minute time point of GTT showing significantly greater insulin secretion in 2xM mice compared to FST WT, 288-only, and FSTL3 WT mice. Insulin levels during GTT were previously shown to be elevated in FSTL3 KO mice relative to their WT littermates (18) and was confirmed here. N = 12, 16, 14, 4, and 4 for FST WT, 288, 2xM, FSTL3 WT and KO, respectively. F) Insulin content of pancreata from 9 month old males showing significantly elevated insulin content in 2xM mice relative to FST WT, 288-only and FSTL3 KO mice. N = 5-10. * = p < 0.05; ** = p < 0.01; *** = p < 0.001.
FST and FSTL3 differentially regulate islet size and composition but not function of isolated islets
Differential glucose tolerance and insulin sensitivity among the mutant lines suggested that loss of FST and/or FSTL3 may alter islet size and/or function. Because we previously identified larger islets in FSTL3 KO mice relative to their WT controls (18), we first determined if this also occurred in FST288 and 2xM lines in males of comparable age (6-12 months). Fractional islet area was not different between FST WT and FST288-only islet size (Fig 5A). However, 2xM islet area was more than 2-fold greater than FST WT and FSTL3 WT, and equal to the 2-fold increase in islet area in FSTL3 KO islets compared to their WT littermates. Thus, islet area is regulated largely by FSTL3 while FST does not add to this phenotype. However, in a subset of specimens for which pancreas weight was available, β-cell mass was not different between the genotypes (Fig 5B), suggesting that while islets were larger in FSTL3 KO and 2xM mice, the number of islets was reduced so that overall mass was not increased. While there was no difference in β-cell proliferation between FST WT and FST288 mice, nor between FSTL3 WT and KO mice, proliferation was significantly greater in FSTL3 lines compared to FST lines and intermediate for 2xM mice, suggesting genetic background differences might be modulating proliferation rates but this was not affected by FST or FSTL3 status (Fig 5C).
Figure 5.

Islet morphometrics in older males. A) Fractional islet area was determined from pancreas sections from 8-10 month old males. Islet area was significantly greater in 2xM and FSTL3 KO mice compared to FSTL3 WT and FST WT mice suggesting islet expansion in these lines. N = 9, 11, 10, 14, and 13 for FST WT, 288, 2xM, FSTL3 WT and KO, respectively. B) b-cell mass was not different between the genotypes. N = 4, 5, 5, 7, and 9 for FST WT, 288, 2xM, FSTL3 WT and KO, respectively. C) Proliferation of b-cells as determined by BrdU incorporation. The overall proliferation rate was higher in FSTL3 WT and KO mice relative to FST WT and 288-only mice but there was no difference between 2xM or FSTL3 KO mice that might account for increased islet area relative to FSTL3 WT. N = 5, 5, 6, 4, and 8 for FST WT, 288, 2xM, FSTL3 WT and KO, respectively. * = p < 0.05; ** = p < 0.01.
To determine if the larger islet size was due to alterations during development, or was precipitated during adult life, mean islet area was analyzed between 3 and 13 months of age in overall weight matched males. Islet area was positively and significantly related to age in FSTL3 KO (r2 = 0.82; p < 001), FST288-only (r2 = 0.41; p < 0.05) and 2xM (r2 = 0.58; p < 0.01) but not for either WT strain (Fig 6A). In both FSTL3 KO (r2 = 0.52; p < 0.01) and 2xM mice (r2 = 0.60; p < 0.01), the relative percentage of β-cells increased with age (Fig 6B) while the percentage of α-cells decreased (Fig 6C). However, no relationship was observed for either WT line or in FST288-only mice. These results demonstrate that the increased islet size and β-cell fraction in older FSTL3 KO and 2xM mice arises after 3 months of age and consists of an increase in the proportion of β-cells that are not derived through an increase in β-cell proliferation.
Figure 6.

Change in islet size and composition with age. A) Mean islet area was determined for males ranging from 3-13 months. Mean islet area was significantly positively associated with age for FSTL3 KO, FST288-only and 2xM mice but not for FSTL3 WT or FST WT, indicating that increased islet area developed as the animals aged and was not present before 3 months of age. N = 12, 11, 12, 9, and 12 for FST WT, 288, 2xM, FSTL3 WT and KO, respectively. B) Relative proportion of β-cells in islets from 8-10 month old males showing that the β-cell fraction significantly increased with age for both FSTL3 KO and 2xM lines but not for either WT or the FST288-only line. This suggests that the larger islets in 2xM and FSTL3 KO mice have more β-cells but they do not apparently arise via proliferation (see Fig 5C). N = 11, 15, 13, 13, and 15 for FST WT, 288, 2xM, FSTL3 WT and KO, respectively. C) Relative proportion of a-cells showing a significantly lower fraction of α-cells in FSTL3 KO and 2xM lines and not in the other lines, as expected from the β-cell increase. N = 11, 14, 10, 11, and 13 for FST WT, 288, 2xM, FSTL3 WT and KO, respectively. D) No differences in mean body weight were detected for the mice in A-C.
To determine if the enlarged islets in 2xM and FSTL3 mice were more functional, islets from each genotype were isolated and examined by GSIS in young (3 months) and old (9 months) males. No difference in insulin secretion was observed in low (2.8 mM) glucose (Fig 7A) while in high (16.7 mM) glucose, older FST288-only islets secreted significantly less insulin than old FST WT islets, but no increase in GSIS was observed in the larger FSTL3 KO or 2xM islets at either age (Fig 7B). Thus, the enhanced glucose tolerance in FSTL3 KO mice compared to WT littermates (18) does not appear to be due to more functional islets despite their larger size and loss of FST isoforms may lead to decreased β-cell function in older males.
Figure 7.

Functional analysis of islets from young and old males of each genotype. Islet function in younger (3 months of age) or older (9 months of age) males representing each genotype was assessed by GSIS. A) In low (2.8 mM) glucose, no differences in insulin secretion were detected. B) When islets were transferred to high glucose, significantly more insulin was secreted by older FST WT islets compared to older FST288-only islets but no other significant differences were identified. Therefore, changes in islet function among the genotypes does not appear to account for the alterations in glucose homeostasis. N = 3 experiments from 3 different isolations. * = p < 0.05.
Discussion
We previously demonstrated that deletion of FSTL3 resulted in increased islet size, β-cell hyperplasia and enhanced glucose tolerance and insulin sensitivity (18). Interestingly, the perigonadal visceral fat pad weight was reduced compared to WT littermates (18), suggesting that ligands regulated by FSTL3, primarily myostatin and activin, influence both glucose homeostasis and fat distribution. In this study we tested the hypothesis that circulating FST also regulates these ligands, but not necessarily in the same way. Moreover, by crossing these mutant lines to delete both circulating antagonists, we hypothesized that we would uncover activities where one antagonist compensates for loss of the other. If the two antagonists, FST and FSTL3, perform identical roles, it would be expected that the single mutants would be identical to 2xM mice. On the other hand, if they have distinct roles, their phenotypes would not overlap. Moreover, if they compensate for each other, the phenotype of the 2xM mice should be more severe or distinct from either single mutant. As summarized in Table 1, each of these possibilities was identified. Reduced body weight was only observed in FST288-only mice. Reduced perigonadal fat weight was observed in FSTL3 and 2xM mice but no enhancement was observed in 2xM mice. Islet area and β-cell proportion was increased in FSTL3 KO and 2xM mice but no change was seen in FST288-only mice. Glucose tolerance and insulin sensitivity was enhanced in FSTL3 KO mice, unchanged in FST288-only mice, and reduced in 2xM mice. This change of insulin sensitivity in 2xM mice may reflect the increased fat mass caused by the sustained increase in activin and myostatin bioactivity resulting from loss of both antagonists. Taken together, these phenotypes suggest that regulation of activin and myostatin by the two antagonists differs depending on tissue and whether the primary influence is endocrine or autocrine/paracrine in nature. Additional studies examining individual tissue responses to activin and myostatin, as well as to loss of individual or combined antagonists, are required to determine the mechanisms involved.
Table 1.
Summary of phenotypes in FSTL3 KO, FST288-only, and 2xM mouse lines compared to WT littermates (FSTL3 KO and FST288-only) or to the other genotypes (2xM).
| Phenotype | FSTL3 KO | FST288-only | Double Mutant (2xM) |
|---|---|---|---|
| Body Weight | NC | < WT | < FSTL3 WT, KO |
| Quadriceps Weight | NC | NC | NC |
| Perigonadal Fat Pad Weight | < WT | < WT | < Both WT |
| Whole Body Fat Mass | NC | NC | > single mutants |
| Whole Body Lean Mass | NC | NC | < single mutants |
| Random Glucose (older) | >FST | < FSTL3 | = FST, < FSTL3 |
| Fasting Glucose (older) | > FST | <FSTL3 | >FST, = FSTL3 |
| Random Insulin | NC | NC | > FST, FSTL3 |
| Glucose Tolerance (GTT) | Enhanced1 | NC | Reduced Vs. FST |
| Insulin Sensitivity (ITT) | Enhanced1 | NC | Reduced Vs. FST |
| Insulin During GTT | NC | NC | >FST, FSTL3 |
| Pancreas Insulin Content | NC | NC | >FST, FSTL3 |
| Fractional Islet Area | >WT | NC | >FST, = FSTL3 |
| β-cell Mass | NC | NC | NC |
| Islet Area Vs. Age | Increases | Increases | Increases |
| β-cell Proportion Vs. Age | Increases | NC | Increases |
| GSIS | NC | Reduced in older mice | NC |
NC = no change;
= previously published in (18)
Because global deletion of Fst is neonatally lethal, preventing determination of adult roles for FST, we modified the Fst locus so that only the FST288 isoform found primarily in or on cells and tissues could be synthesized, while the circulating FST315 isoform and the gonadal FST303 isoforms could not be produced (20, 25, 26). While FST288-only mice were significantly lighter than their WT littermates or FSTL3 WT, KO or 2xM mice, there was no detectable change in muscle mass that might be expected from increased myostatin bioactivity. In contrast, Fst (+/-) heterozygotes have normal body weight but reduced muscle mass reflecting increased myostatin and activin bioactivity (22). In other words, two modified Fst alleles (FST288-only mice) producing only the FST288 isoform are sufficient for regulating myostatin and activin's effects on muscle mass whereas loss of one normal Fst allele (Fst +/-) is not. Thus, regulation of muscle mass must occur largely at the tissue level through autocrine or paracrine actions rather than through inhibition of activin and myostatin in the circulation. This explains why complete loss of FSTL3, an antagonist purified from blood bound to myostatin (15), did not alter quadriceps weight or whole body lean mass (this study and (18, 22).
It remains unclear why body weight is reduced in the FST288-only mice. No change was uncovered in quadriceps or liver weight in any genotype while whole body lean and fat mass and gonadal fat pad mass were identical to WT mice. Perhaps the FST288 isoform is not sufficient to completely support normal embryonic development and more subtle aspects of the musculo-skeletal defects seen in FST KO mice (19) remains in FST288-only adults.
Whole body qNMR scanning revealed significantly increased fat mass and decreased lean mass in the 2xM line relative to either single mutant and their WT littermates, suggesting that both FST and FSTL3 contribute to regulation of whole body adiposity and muscle mass and that one antagonist can compensate for loss of the other. This contrasts with regulation of individual fat pad weights since the perigonadal fat pad weight was reduced in FSTL3 KO and 2xM lines, but not in FST288-only mice, and the effects were not additive in the 2xM males. These observations suggest that the FST and FSTL3 antagonists differentially regulate total adiposity as well as lipid accumulation in specific fat pads. Whether this reflects differences in sensitivity to activin versus myostatin remains to be determined.
It is currently thought that reducing visceral fat mass can lead to increased insulin sensitivity, which might occur via surgical resection (23, 24) or from treatments that redistribute lipid from visceral to subcutaneous stores such as TZDs (27). Our results demonstrate that removing FSTL3 leads to reduced perigonadal fat pad weight, a visceral fat depot (27), but with differing effects on glucose homeostasis. In FSTL3 KO mice, the reduced gonadal fat mass is associated with enhanced glucose tolerance and insulin sensitivity (18). On the other hand, reduced gonadal fat pad weight is associated with insulin resistance and glucose intolerance in 2xM mice. These data suggest that the relationship between this visceral fat depot and glucose homeostasis is more complex than currently thought. Insulin sensitivity in 2xM mice might be dominated by the increase in total fat mass detected by qNMR rather than dependent on the gonadal visceral fat pad. Another possibility is that 2xM mice are primarily driven by hyperinsulinemia from an early age which leads to downregulation of the insulin signaling pathway to avoid hyperglycemia. However, no enhancement of 2xM or FSTL3 KO islet GSIS was observed indicating that the altered phenotypes involve more than islet function.
Other phenotypes were differentially altered by loss of FST, FSTL3, or both antagonists. Enlarged islets with increased β-cell representation was detected in FSTL3 KO and 2xM mice whereas no change was induced in the FST288-only mouse. On the other hand, pancreas weight was increased in FST288-only mice compared to WT littermates and this was not seen in FSTL3 KO or 2xM mice. This suggests that islet size and composition is influenced to a greater degree by FSTL3 than FST. FSTL3 may be produced within the islet compartment whereas FST may derive from non-islet cells. Thus, autocrine regulation of activin and myostatin activity within islets by FSTL3 may be important for influencing islet size and composition such as might occur during compensation for physiological or pathophysiological increases in demand for insulin. While this is supported by the enhanced glucose tolerance uncovered in FSTL3 KO mice (18) it is not consistent with the relative insulin resistance and glucose intolerance of the 2xM line or the lack of enhanced GSIS in cultured 2xM and FSTL3 KO islets. Perhaps the increased adiposity in 2xM mice offsets the enhanced glucose tolerance of FSTL3 KO mice.
In this study we have documented at least four different outcomes for 2xM mice, from an intermediate phenotype between the two single mutants, the same phenotype as both mutants, the same phenotype as only one single mutant, or the appearance of a phenotype that is not found in either single mutant. We also identified alterations in adiposity or glucose homeostasis that are associated with one single mutant and not seen in the others. It is therefore likely that regulation of activin and myostatin bioactivity by FST and FSTL3 in altering muscle and fat mass as well as glucose homeostasis is complex and tissue-specific. Nevertheless, our results support the concept that FST and FSTL3 have important physiological roles in regulating glucose homeostasis as well as whole body fat and lean mass. Taken together with the observation that FST secretion is reduced in obese human subjects (16) our results suggest that altered FST and/or FSTL3 may be important for regulating body composition in humans as well.
Supplementary Material
Acknowledgments
The authors are grateful for the critical contributions of Drs. Melissa Thomas (Massachusetts General Hospital) and Susan Bonner-Weir (Joslin Diabetes Center). We also appreciate the extensive technical assistance with histological experiments from Brooke Bentley (PVLSI). This work was supported by a National Institutes of Health/NIDDK grant 5 R01 DK075058 and the Center for Excellence in Apoptosis Research at UMass/PVLSI.
Footnotes
Disclosure: The authors have no interests to disclose.
Supplementary Material is available at WWW.nature.com/obesity.
References
- 1.Kim SH, Reaven G. Obesity and insulin resistance: an ongoing saga. diabetes. 2010;59(9):2105–6. doi: 10.2337/db10-0766. [DOI] [PMC free article] [PubMed] [Google Scholar]
- 2.Samuel VT, Petersen KF, Shulman GI. Lipid-induced insulin resistance: unravelling the mechanism. The Lancet. 2010;375(9733):2267–77. doi: 10.1016/S0140-6736(10)60408-4. [DOI] [PMC free article] [PubMed] [Google Scholar]
- 3.Brown ML, Schneyer A. Emerging roles for TGFb family in b-cell homeostasis. Trends in Endocrinology and Metabolism. 2010;21(7):441–448. doi: 10.1016/j.tem.2010.02.008. [DOI] [PMC free article] [PubMed] [Google Scholar]
- 4.Guo T, Jou W, Chanturiya T, Portas J, Gavrilova O, McPherron AC. Myostatin inhibition in muscle, but not adipose tissue, decreases fat mass and improves insulin sensitivity. PLoS ONE. 2009;4(3):e4937. doi: 10.1371/journal.pone.0004937. [DOI] [PMC free article] [PubMed] [Google Scholar]
- 5.Zaragosi LE, Wdziekonski B, Villageois P, et al. Activin A Plays a Critical Role in Proliferation and Differentiation of Human Adipose Progenitors. diabetes. 2010 doi: 10.2337/db10-0013. [DOI] [PMC free article] [PubMed] [Google Scholar]
- 6.Hirai S, Yamanaka M, Kawachi H, Matsui T, Yano H. Activin A inhibits differentiation of 3T3-L1 preadipocyte. Mol Cell Endocrinol. 2005;232(1-2):21–6. doi: 10.1016/j.mce.2005.01.001. [DOI] [PubMed] [Google Scholar]
- 7.Magnusson B, Svensson PA, Carlsson LM, Sjoholm K. Activin B inhibits lipolysis in 3T3-L1 adipocytes. Biochem Biophys Res Commun. 2010;395(3):373–6. doi: 10.1016/j.bbrc.2010.04.022. [DOI] [PubMed] [Google Scholar]
- 8.Florio P, Luisi S, Marchetti P, et al. Activin A stimulates insulin secretion in cultured human pancreatic islets. J Endocrinol Invest. 2000;23(4):231–4. doi: 10.1007/BF03343713. [DOI] [PubMed] [Google Scholar]
- 9.Shibata H, Yasuda H, Sekine N, Mine T, Totsuka Y, Kojima I. Activin A increases intracellular free calcium concentrations in rat pancreatic islets. FEBS Lett. 1993;329(1-2):194–8. doi: 10.1016/0014-5793(93)80220-o. [DOI] [PubMed] [Google Scholar]
- 10.McPherron AC, Lee SJ. Suppression of body fat accumulation in myostatin-deficient mice. J Clin Invest. 2002;109(5):595–601. doi: 10.1172/JCI13562. [DOI] [PMC free article] [PubMed] [Google Scholar]
- 11.McPherron AC, Lawler AM, Lee SJ. Regulation of skeletal muscle mass in mice by a new TGF-beta superfamily member. Nature. 1997;387(6628):83–90. doi: 10.1038/387083a0. [DOI] [PubMed] [Google Scholar]
- 12.Sidis Y, Mukherjee A, Keutmann H, Delbaere A, Sadatsuki M, Schneyer A. Biological activity of follistatin isoforms and follistatin-like-3 is dependent on differential cell surface binding and specificity for activin, myostatin, and bone morphogenetic proteins. Endocrinology. 2006;147(7):3586–97. doi: 10.1210/en.2006-0089. [DOI] [PubMed] [Google Scholar]
- 13.Schneyer AL, Wang Q, Sidis Y, Sluss PM. Differential Distribution of Follistatin Isoforms: Application of a New FS315-Specific Immunoassay. J Clin Endocrinol Metab. 2004;89(10):5067–75. doi: 10.1210/jc.2004-0162. [DOI] [PubMed] [Google Scholar]
- 14.Tortoriello DV, Sidis Y, Holtzman DA, Holmes WE, Schneyer AL. Human follistatin-related protein: a structural homologue of follistatin with nuclear localization. Endocrinology. 2001;142(8):3426–34. doi: 10.1210/endo.142.8.8319. [DOI] [PubMed] [Google Scholar]
- 15.Hill JJ, Davies MV, Pearson AA, et al. The myostatin propeptide and the follistatin-related gene are inhibitory binding proteins of myostatin in normal serum. J Biol Chem. 2002;277(43):40735–41. doi: 10.1074/jbc.M206379200. [DOI] [PubMed] [Google Scholar]
- 16.Flanagan JN, Linder K, Mejhert N, et al. Role of follistatin in promoting adipogenesis in women. J Clin Endocrinol Metab. 2009;94(8):3003–9. doi: 10.1210/jc.2008-2005. [DOI] [PMC free article] [PubMed] [Google Scholar]
- 17.Lin J, Arnold HB, la-Fera MA, Azain MJ, Hartzell DL, Baile CA. Myostatin knockout in mice increases myogenesis and decreases adipogenesis. Biochem Biophys Res Commun. 2002;291(3):701–6. doi: 10.1006/bbrc.2002.6500. [DOI] [PubMed] [Google Scholar]
- 18.Mukherjee A, Sidis Y, Mahan A, et al. FSTL3 deletion reveals roles for TGF-beta family ligands in glucose and fat homeostasis in adults. Proc Natl Acad Sci U S A. 2007;104(4):1348–53. doi: 10.1073/pnas.0607966104. [DOI] [PMC free article] [PubMed] [Google Scholar]
- 19.Matzuk MM, Lu N, Vogel HJ, Sellheyer K, Roop DR, Bradley A. Multiple defects and perinatal death in mice deficient in follistatin. Nature. 1995;374:360–3. doi: 10.1038/374360a0. [DOI] [PubMed] [Google Scholar]
- 20.Kimura F, Sidis Y, Bonomi L, Xia Y, Schneyer A. The follistatin-288 isoform alone is sufficient for survival but not for normal fertility in mice. Endocrinology. 2010;151(3):1310–9. doi: 10.1210/en.2009-1176. [DOI] [PMC free article] [PubMed] [Google Scholar]
- 21.Zimmers TA, Davies MV, Koniaris LG, et al. Induction of cachexia in mice by systemically administered myostatin. Science. 2002;296(5572):1486–8. doi: 10.1126/science.1069525. [DOI] [PubMed] [Google Scholar]
- 22.Lee SJ, Lee YS, Zimmers TA, et al. Regulation of Muscle Mass by Follistatin and Activins. Mol Endocrinol. 2010 doi: 10.1210/me.2010-0127. [DOI] [PMC free article] [PubMed] [Google Scholar]
- 23.Thorne A, Lonnqvist F, Apelman J, Hellers G, Arner P. A pilot study of long-term effects of a novel obesity treatment: omentectomy in connection with adjustable gastric banding. Int J Obes Relat Metab Disord. 2002;26(2):193–9. doi: 10.1038/sj.ijo.0801871. [DOI] [PubMed] [Google Scholar]
- 24.Gabriely I, Ma XH, Yang XM, et al. Removal of visceral fat prevents insulin resistance and glucose intolerance of aging: an adipokine-mediated process? diabetes. 2002;51(10):2951–8. doi: 10.2337/diabetes.51.10.2951. [DOI] [PubMed] [Google Scholar]
- 25.Sidis Y, Mukherjee A, Keutmann H, Delbaere A, Sadatsuki M, Schneyer A. Biological Activity of Follistatin Isoforms and Follistatin like-3 are Dependent on Differential Cell Surface Binding and Specificity for Activin, Myostatin and BMP's. Endocrinology. 2006;147:3586–97. doi: 10.1210/en.2006-0089. [DOI] [PubMed] [Google Scholar]
- 26.Sugino K, Kurosawa N, Nakamura T, et al. Molecular heterogeneity of follistatin, an activin-binding protein. J Biol Chem. 1993;68:15579–87. [PubMed] [Google Scholar]
- 27.Tran TT, Kahn CR. Transplantation of adipose tissue and stem cells: role in metabolism and disease. Nat Rev Endocrinol. 2010;6(4):195–213. doi: 10.1038/nrendo.2010.20. [DOI] [PMC free article] [PubMed] [Google Scholar]
Associated Data
This section collects any data citations, data availability statements, or supplementary materials included in this article.