Abstract
Metabolic stability measurements are a critical component of preclinical drug development. Available measurement strategies rely on chromatography and mass spectrometry, which are expensive and labor-intensive. We have developed a general method to determine the metabolic stability of virtually any compound by quantifying cofactors in the mechanism of cytochrome P450 enzymes using fluorescence intensity measurements. While many previous studies have shown that simple measurements of cofactor depletion do not correlate with substrate conversion (i.e., metabolic stability) in P450 systems, the present work employs a reaction engineering approach to simplify the overall rate equation, thus allowing the accurate and quantitative determination of substrate depletion from simultaneous measurements of NADPH and oxygen depletion. This method combines the accuracy and generality of chromatography with the ease, throughput, and real-time capabilities of fluorescence.
Cytochrome P450 enzymes catalyze the majority of first-pass drug metabolism and are involved in the metabolism of approximately 75% of currently prescribed drugs.1 As a result, determining whether a drug candidate is subject to P450 catalysis, and the rate at which it reacts with all or individual P450s, known as its metabolic stability, is a critical step in the optimization of promising lead compounds for drug development.2 The successful advancement of bioactive early-screen hits to viable lead compounds requires the multi-dimensional optimization of drug efficacy and pharmacokinetic properties, including metabolic stability.3 Indeed, the simultaneous optimization of drug-like properties and efficacy is crucial to prevent costly late-stage attrition.4
Currently, the favored method for measuring metabolic stability employs liquid chromatography coupled mass spectrometry (LCMS/MS).5 This sophisticated instrumentation is necessary to successfully quantify a diverse array of compounds within the heterogeneous liver extracts that mimic in vivo drug metabolism. Although recent advances in high-throughput chromatographic systems coupled with liquid-handling robots have drastically increased the throughput of LCMS/MS,6 this approach is burdened by high equipment costs, difficult assay development, and the inherent sequential nature of chromatographic measurements.1,7 Fluorescence measurements are ideally suited to quantify an analyte of interest within a heterogeneous system. Fluorescence measurements can be taken in parallel with multiple replicates, require much less expensive equipment than LCMS/MS, and are non-destructive such that time-course data rather than endpoints can be acquired.
Alternatives to LCMS/MS, including fluorescence-based methods, have so far proven inadequate because they yield only qualitative estimates of substrate conversion rates (except for fluorescent substrates, which comprise a limited set of relevant compounds). The inhibition of metabolism of fluorogenic8a–c or luminogenic8d reporter substrates by a test compound is often used as an indirect indicator of the P450 reactivity of that compound. However, the complexity of P450-substrate binding interactions can lead to marked variations in test-compound inhibition with the reporter substrate used.10
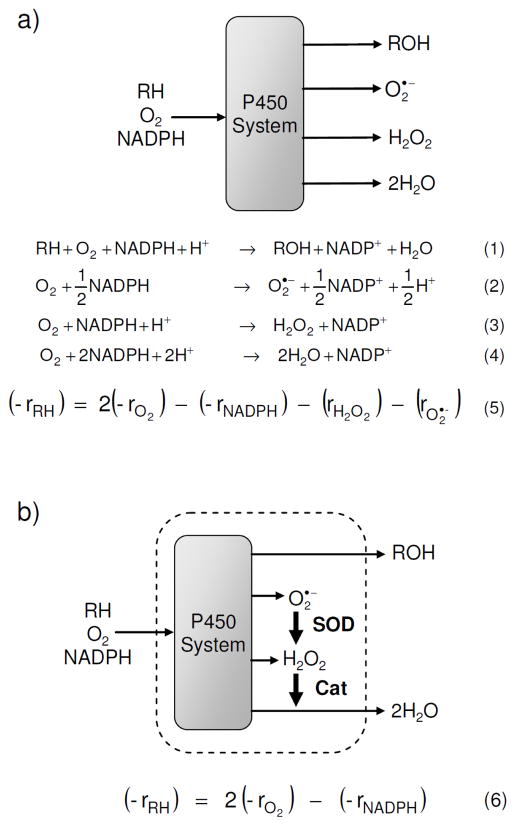
Several groups have attempted to correlate the rate of oxygen depletion, measured via qualitative methods, with P450 reactivity.9,11 It is clear, however, from a kinetic analysis of the P450 system, shown in Scheme 1a and derived in the Supporting Information, that P450-mediated oxygen depletion is not necessarily coupled to test-compound depletion. Indeed, it is well known that simple measurements of cofactor depletion do not correlate well with metabolic stability.12 Additionally, several recent reports have described various systems linking indicators of catalysis to easily assayed signal outputs.13 All of these analytical systems offer valuable information but lack the rigorous accuracy needed for preclinical drug development.
Scheme 1.
Schematic of the P450 system, relevant reactions, and overall rate equation for metabolic stability, (−rRH), (a) before, and (b) after the addition of the antioxidant enzymes superoxide dismutase and catalase. Reaction 1 represents the general oxidation of a substrate, RH, to a product, ROH, while Reactions 2–4 represent uncoupling pathways. A full derivation of the rate equations can be found in the Supporting Information.
Clearly, a general and accurate method to quantify metabolic stability using only fluorescence measurements would constitute a highly useful tool for drug discovery. The inherent scalability of such a method could readily provide the increase in throughput necessary to advance metabolic stability measurements forward in the drug discovery process, allowing multi-dimensional optimization of pharmacokinetic properties at earlier stages in drug development.
We have developed the Metabolizing Enzyme Stability Assay Plate (MesaPlate), a simple and general system to quantify metabolic stability using fluorescence intensity measurements to determine the concentration of species in the P450 reaction mechanism. These concentration measurements are then used to solve the overall rate equation for substrate depletion. Due to the large number of side products generated by P450 enzymes, and the high reactivity of hydrogen peroxide and superoxide, it is impractical to measure all of the species that appear in the overall rate equation. (Scheme 1a). Instead, we took a more efficient approach by simplifying the rate equation with the addition of superoxide dismutase and catalase. These antioxidant enzymes act together to convert two of the side products, superoxide and hydrogen peroxide, into the third side product, water, without using additional reducing equivalents. Both of these reactions are diffusion-limited and are extremely fast relative to all other reactions in the system; thus, the net rates of superoxide production (rO2·−) and of hydrogen peroxide production (rH2O2) are negligible. Therefore, the rate of substrate oxidation (−rRH), which equals the metabolic stability, can be calculated using Equation 6 shown in Scheme 1 from the depletion rates of NADPH (−rNADPH) and oxygen (−rO2), which can be simultaneously quantified with fluorescence intensity measurements using the intrinsic fluorescence of NADPH and a commercially available oxygen probe.14 See Supporting Information for a detailed derivation of the rate equation.
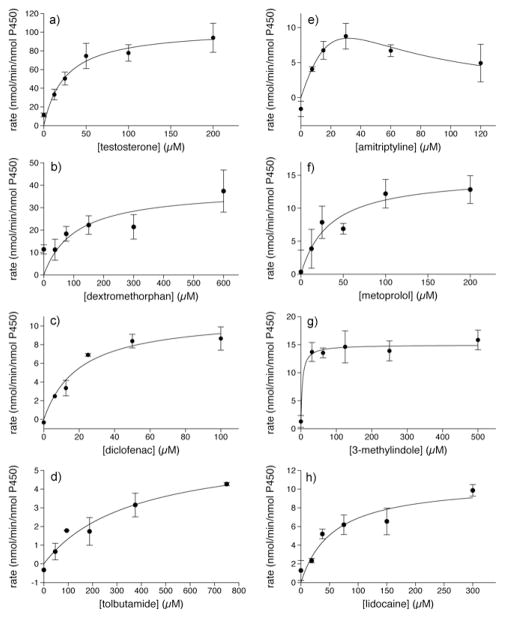
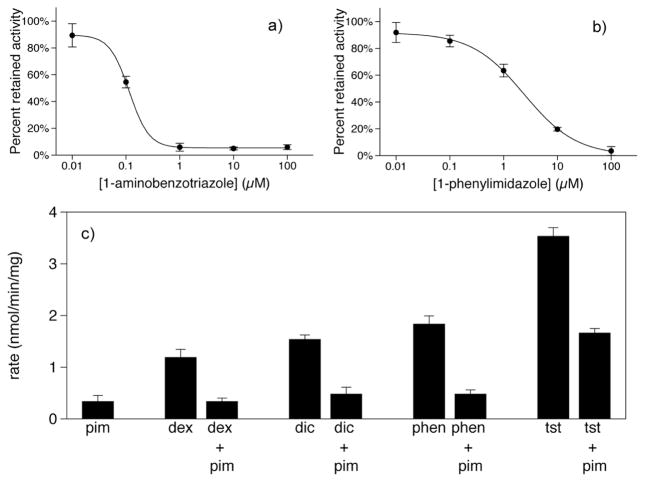
Proof of concept experiments were conducted with Baculosomes, a model P450 system. Representative NADPH and oxygen depletion data for the CYP3A4 oxidation of testosterone are shown in the Supporting Information. Metabolic stability data for several P450 isoforms are shown in Figure 1 as a function of substrate concentration. Except for the oxidation of amitriptyline by CYP2D6, which is known to display substrate inhibition,16 all data sets fit well to the Michaelis-Menten equation as shown by Eadie-Hofstee plots in the Supporting Information. In addition, the calculated catalytic constants and measured rates compare favorably with traditional chromatographic assays (Table 1, 2). To demonstrate the measurement of P450 inhibition, the reversible and irreversible inhibition of CYP3A4-catalyzed testosterone metabolism is shown in Figure 2a,b. The calculated IC50 values of 2.39±0.01 μM and 0.12±0.01 μM for 1-phenylimidazole and 1-aminobenzotriazole, respectively, compare well with literature values of 2.7 μM17 and 0.58 μM.18 To demonstrate the MesaPlate with a more pharmaceutically relevant system, isoform-specific substrates were incubated with pooled human liver microsomes in the presence or absence of 1-phenylimidazole (Fig 2c). A clear trend is observed where the measured rate of P450 oxidation is much lower in the presence of inhibitor, demonstrating the utility of the MesaPlate for identifying substrates and inhibitors within the heterogeneous, in vivo-like environment of human liver microsomes.
Figure 1.
Measured rates of oxidation of (a) testosterone and (b) dextromethorphan by CYP3A4; (c) diclofenac and (d) tolbutamide by CYP2C9; (e) amitriptyline and (f) metoprolol by CYP2D6; and (g) 3-methylindole and (h) lidocaine by CYP1A2. Data for the CYP2D6 oxidation of amitriptyline were fit to substrate inhibition kinetics, while all others were fit to Michaelis-Menten kinetics.
Table 1.
Comparison of catalytic constants kcat and KM determined from the MesaPlate and reported in the literature.15
| Isoform | Substrate | MesaPlate | Literature | ||
|---|---|---|---|---|---|
| kcat (min−1) | KM (μM) | kcat (min−1) | KM (μM) | ||
| CYP3A4 | Testosteronea | 118 ± 8 | 31 ± 7 | 105 | 24 |
| CYP3A4 | Dextromethorphana | 38 ± 8 | 106 ± 64 | 27 | 210 |
| CYP2C9 | Diclofenac | 11 ± 1 | 20 ± 7 | 29 | 5 |
| CYP2C9 | Tolbutamide | 6 ± 1 | 366 ± 154 | 10 | 103 |
Literature values for overall substrate depletion were calculated from published data on multiple product formation as described in Supporting Information.
Table 2.
Comparison of metabolic stabilities measured with the MesaPlate and with chromatography
| Isoform | Substrate | Conc. (μM) | MesaPlate | Chromatography |
|---|---|---|---|---|
| −rRHa | −rRHa | |||
| CYP2D6 | Amitriptyline | 60 | 6.7 ± 0.8 | 3.8 ± 0.4 |
| CYP2D6 | Metoprolol | 100 | 12.2 ± 2.2 | 9.8 ± 2.3 |
| CYP1A2 | 3-methylindole | 500 | 15.8 ± 1.8 | 10.7 ± 0.8 |
| CYP1A2 | lidocaine | 300 | 9.9 ± 0.6 | 9.7 ± 1.2 |
nmol/min/nmol P450
Figure 2.
Inhibition of CYP3A4-catalyzed testosterone metabolism in Baculosomes by (a) the irreversible inhibitor, 1-aminobenzotriazole, and (b) the reversible inhibitor, 1-phenylimidazole. Data were fit to a four-parameter logistic equation. Metabolic stability results (c) for human liver microsomes showing inhibition by 1-phenylimidazole (pim) of CYP2D6 metabolism of dextromethorphan (dex), CYP2C9 metabolism of diclofenac (dic), CYP1A2 metabolism of phenacetin (phen), and CYP3A4 metabolism of testosterone (tst).
It is important to emphasize that NADPH and oxygen depletion rates alone cannot generally be used to calculate metabolic stability. Without the addition of superoxide dismutase and catalase, the pseudo-steady state assumptions needed to generate Equation 6 are not valid. For example, applying Equation 6 to data sets in the literature19 that include rates of NADPH and oxygen depletion measured in the absence of superoxide dismutase and catalase yields incorrect values for metabolic stability. These incorrect values result from a significant accumulation of reactive oxygen species, evidenced by the large reported rates of peroxide generation. In such cases, Equation 5 would accurately calculate metabolic stability but would require additional measurements. In addition, the techniques used in these previous reports (e.g., electrochemical and endpoint colorimetric assays) are not amenable to high-throughput studies. Thus the addition of antioxidant enzymes simplifies the reaction system such that Equation 6 is valid and NADPH and oxygen depletion rates can be used to quantify the rate of substrate depletion in a straightforward manner. Much of this method’s value derives from its simplicity when compared to alternate approaches.
Test compounds exhibiting strong UV absorbance or fluorescence could potentially interfere with the measured signal from the fluorescent reporters used in this study. However, the MesaPlate should still be suitable for use with fluorescent compounds because it is possible to distinguish the spectral contributions from overlapping fluorophores using well-known techniques.20 Moreover, based on an analysis of the optical properties of the top 30 bestselling drugs,21 only one compound would be expected to exhibit interference (see Supporting Information for full details).
In conclusion, we have developed a simple and broadly applicable high-throughput method to measure metabolic stability based on P450 metabolism. This technology, based on fluorescence intensity measurements of species present in all P450-catalyzed reactions, promises to provide valuable decision-making information at earlier stages of drug development. In addition to screening a larger number of test compounds, the MesaPlate could also be used to screen more P450 isoforms. Including naturally occurring P450 mutants would provide more accurate information on the metabolic capabilities and limitations of relevant subpopulations, or of specific individuals, an essential objective in the growing field of personalized medicine.22 Moreover, laboratory evolution techniques favored to engineer P450 enzymes suffer from similar problems as lead optimization, where rapid assays and high throughput are often necessary.23 Thus, the MesaPlate is anticipated to provide a useful tool in protein engineering efforts to harness and improve the synthetic capabilities of P450 enzymes.
Supplementary Material
Acknowledgments
This work was supported by the National Science Foundation and the National Institutes of Health.
Footnotes
Supporting Information Available: Experimental materials and methods, derivations of rate equations, supporting figures and calculations, and an analysis of the optical properties of the top 30 bestselling drugs are included in the supporting information. This information is available free of charge via the Internet at http://pubs.acs.org.
References
- 1.Wienkers LC, Heath TG. Nat Rev Drug Discov. 2005;4:825. doi: 10.1038/nrd1851. [DOI] [PubMed] [Google Scholar]
- 2.Bjornsson TD, et al. Drug Metab Dispos. 2003;31:815. doi: 10.1124/dmd.31.7.815. [DOI] [PubMed] [Google Scholar]
- 3.(a) MacCoss M, Baillie TA. Science. 2004;303:1810. doi: 10.1126/science.1096800. [DOI] [PubMed] [Google Scholar]; (b) Bleicher KH, Bohm HJ, Muller K, Alanine AI. Nat Rev Drug Discov. 2003;2:369. doi: 10.1038/nrd1086. [DOI] [PubMed] [Google Scholar]
- 4.Gribbon P, Sewing A. Drug Discov Today. 2005;10:17. doi: 10.1016/S1359-6446(04)03275-1. [DOI] [PubMed] [Google Scholar]
- 5.Youdim KA, Saunders KC. J Chromatogr B. 2010;878:1326. doi: 10.1016/j.jchromb.2010.02.013. [DOI] [PubMed] [Google Scholar]
- 6.Xu RD, Manuel M, Cramlett J, Kassel DB. J Chromatogr A. 2010;1217:1616. doi: 10.1016/j.chroma.2010.01.009. [DOI] [PubMed] [Google Scholar]
- 7.Foti RS, Wienkers LC, Wahlstrom JL. Comb Chem High T Scr. 2010;13:145. doi: 10.2174/138620710790596718. [DOI] [PubMed] [Google Scholar]
- 8.(a) Crespi CL, Miller VP, Penman BW. Anal Biochem. 1997;248:188. doi: 10.1006/abio.1997.2145. [DOI] [PubMed] [Google Scholar]; (b) Crespi CL, Stresser DM. J Pharmacol Toxicol. 2000;44:325. doi: 10.1016/s1056-8719(00)00112-x. [DOI] [PubMed] [Google Scholar]; (c) Stresser DM, Turner SD, Blanchard AP, Miller VP, Crespi CL. Drug Metab Dispos. 2002;30:845. doi: 10.1124/dmd.30.7.845. [DOI] [PubMed] [Google Scholar]; (d) Veith H, Southall N, Huang RL, James T, Fayne D, Artemenko N, Shen M, Inglese J, Austin CP, Lloyd DG, Auld DS. Nat Biotechnol. 2009;27:1050. doi: 10.1038/nbt.1581. [DOI] [PMC free article] [PubMed] [Google Scholar]
- 9.Olry A, Schneider-Belhaddad F, Heintz D, Werck-Reichhart D. Plant J. 2007;51:331. doi: 10.1111/j.1365-313X.2007.03140.x. [DOI] [PubMed] [Google Scholar]
- 10.(a) Cohen LH, Remley MJ, Raunig D, Vaz ADN. Drug Metab Dispos. 2003;31:1005. doi: 10.1124/dmd.31.8.1005. [DOI] [PubMed] [Google Scholar]; (b) Kenworthy KE, Bloomer JC, Clarke SE, Houston JB. Brit J Clin Pharmaco. 1999;48:716. doi: 10.1046/j.1365-2125.1999.00073.x. [DOI] [PMC free article] [PubMed] [Google Scholar]; (c) Wang RW, Newton DJ, Liu N, Atkins WM, Lu AYH. Drug Metab Dispos. 2000;28:360. [PubMed] [Google Scholar]
- 11.(a) Zitova A, Hynes J, Kollar J, Borisov SM, Klimant I, Papkovsky DB. Anal Biochem. 2010;397:144. doi: 10.1016/j.ab.2009.10.029. [DOI] [PubMed] [Google Scholar]; (b) Chang G, Morigaki K, Tatsu Y, Hikawa T, Goto T, Imaishi H. Anal Chem. 2011 doi: 10.1021/ac103059k. [DOI] [PubMed] [Google Scholar]
- 12.Ansede J, Thakker D. J Pharm Sc. 2004;93:239. doi: 10.1002/jps.10545. [DOI] [PubMed] [Google Scholar]
- 13.(a) Cravatt BF, Wright AT, Song JD. J Am Chem Soc. 2009;131:10692. doi: 10.1021/ja9037609. [DOI] [PMC free article] [PubMed] [Google Scholar]; (b) Dunn AR, Hays AMA, Goodin DB, Stout CD, Chiu R, Winkler JR, Gray HB. J Am Chem Soc. 2002;124:10254. doi: 10.1021/ja0271678. [DOI] [PubMed] [Google Scholar]; (c) Niemeyer CM, Rabe KS, Spengler M, Erkelenz M, Muller J, Gandubert VJ, Hayen H. Chembiochem. 2009;10:751. doi: 10.1002/cbic.200800750. [DOI] [PubMed] [Google Scholar]; (d) Zhang K, El Damaty S, Fasan R. J Am Chem Soc. 2011;133:3242. doi: 10.1021/ja109590h. [DOI] [PubMed] [Google Scholar]
- 14.(a) Lakowicz JR. Principles of fluorescence spectroscopy. 3. Springer; New York: 2006. [Google Scholar]; (b) O’donovan C, Hynes J, Yashunski D, Papkovsky DB. J Mat Chem. 2005;15:2946. [Google Scholar]
- 15.(a) Yu AM, Haining RL. Drug Metab Dispos. 2001;29:1514. [PubMed] [Google Scholar]; (b) Krauser JA, Guengerich FP. J Biol Chem. 2005;280:19496. doi: 10.1074/jbc.M501854200. [DOI] [PubMed] [Google Scholar]; (c) Kumar V, Rock DA, Warren CJ, Tracy TS, Wahlstrom JL. Drug Metab Dispos. 2006;34:1903. doi: 10.1124/dmd.106.010249. [DOI] [PMC free article] [PubMed] [Google Scholar]
- 16.Venkatakrishnan K, Greenblatt DJ, von Moltke LL, Schmider J, Harmatz JS, Shader RI. J Clin Pharmacol. 1998;38:112. doi: 10.1002/j.1552-4604.1998.tb04399.x. [DOI] [PubMed] [Google Scholar]
- 17.Fowler SM, Riley RJ, Pritchard MP, Sutcliffe MJ, Friedberg T, Wolf CR. Biochemistry. 2000;39:4406. doi: 10.1021/bi992372u. [DOI] [PubMed] [Google Scholar]
- 18.Emoto C, Murase S, Sawada Y, Iwasaki K. Drug Metab Pharmacokinet. 2005;20:351. doi: 10.2133/dmpk.20.351. [DOI] [PubMed] [Google Scholar]
- 19.(a) Gorsky LD, Koop DR, Coon MJ. J Biol Chem. 1984;259:6812. [PubMed] [Google Scholar]; (b) Loida PJ, Sligar SG. Biochemistry. 1993;32:11530. doi: 10.1021/bi00094a009. [DOI] [PubMed] [Google Scholar]; (c) Fang X, Kobayashi Y, Halpert JR. FEBS Lett. 1997;416:77. doi: 10.1016/s0014-5793(97)01173-3. [DOI] [PubMed] [Google Scholar]
- 20.(a) Dickinson ME, Bearman G, Tille S, Lansford R, Fraser SE. Biotechniques. 2001;31:1272. doi: 10.2144/01316bt01. [DOI] [PubMed] [Google Scholar]; (b) Traylor MJ, Chai J, Clark DS. Arch Biochem Biophys. 2011;505:186. doi: 10.1016/j.abb.2010.10.002. [DOI] [PMC free article] [PubMed] [Google Scholar]; (c) Zimmermann T, Rietdorf J, Girod A, Georget V, Pepperkok R. Febs Lett. 2002;531:245. doi: 10.1016/s0014-5793(02)03508-1. [DOI] [PubMed] [Google Scholar]
- 21.Bartholow M. Pharmacy Times. 2010;10 [Google Scholar]
- 22.(a) Ingelman-Sundberg M. Trends Pharmacol Sci. 2004;25:193. doi: 10.1016/j.tips.2004.02.007. [DOI] [PubMed] [Google Scholar]; (b) Woodcock J. Clin Pharmacol Ther. 2007;81:164. doi: 10.1038/sj.clpt.6100063. [DOI] [PubMed] [Google Scholar]
- 23.(a) Gillam EMJ. Chem Res Toxicol. 2008;21:220. doi: 10.1021/tx7002849. [DOI] [PubMed] [Google Scholar]; (b) Glieder A, Farinas ET, Arnold FH. Nat Biotechnol. 2002;20:1135. doi: 10.1038/nbt744. [DOI] [PubMed] [Google Scholar]; (c) Lewis JC, Arnold FH. Chimia. 2009;63:309. [Google Scholar]; (d) Peters MW, Meinhold P, Glieder A, Arnold FH. J Am Chem Soc. 2003;125:13442. doi: 10.1021/ja0303790. [DOI] [PubMed] [Google Scholar]; (e) Wong TS, Arnold FH, Schwaneberg U. Biotechnol Bioeng. 2004;85:351. doi: 10.1002/bit.10896. [DOI] [PubMed] [Google Scholar]
Associated Data
This section collects any data citations, data availability statements, or supplementary materials included in this article.


