

Abstract
Oligodendrocyte precursor cells (OPCs) express NMDA receptors (NMDARs) and form synapses with glutamatergic neurons throughout the CNS. Although glutamate influences the proliferation and maturation of these progenitors in vitro, the role of NMDAR signaling in oligodendrogenesis and myelination in vivo is not known. Here, we investigated the consequences of genetically deleting the obligatory NMDAR subunit NR1 from OPCs and their oligodendrocyte progeny in the CNS of developing and mature mice. NMDAR-deficient OPCs proliferated normally, achieved appropriate densities in gray and white matter, and differentiated to form major white matter tracts without delay. OPCs also retained their characteristic physiological and morphological properties in the absence of NMDAR signaling and were able to form synapses with glutamatergic axons. However, expression of calcium-permeable AMPA receptors (AMPARs) was enhanced in NMDAR-deficient OPCs. These results suggest that NMDAR signaling is not used to control OPC development but to regulate AMPAR-dependent signaling with surrounding axons, pointing to additional functions for these ubiquitous glial cells.
Introduction
Glia in the mammalian CNS express neurotransmitter receptors that may enable these cells to rapidly adapt to the changing needs of surrounding neurons. Indeed, glutamate and GABA receptor signaling in glia has been implicated in processes as diverse as synaptic plasticity, functional hyperemia, and cell differentiation (Belachew and Gallo, 2004; Perea et al., 2009; Attwell et al., 2010). Nevertheless, the consequences of this signaling in vivo are essentially unknown. Because many therapeutics used to treat neurological disorders and limit injury during stroke act on neurotransmitter receptors (Müller et al., 1995; Hoyte et al., 2004; Zarate et al., 2010), it is important to evaluate the roles of neurotransmitter signaling to glia in both physiological and pathological contexts.
The CNS contains an abundant class of progenitor cells that express the chondroitin sulfate proteoglycan NG2 and the α receptor for platelet derived growth factor (PDGFαR) (Nishiyama, 2007). These NG2+ glial cells are often referred to as oligodendrocyte precursor cells (OPCs), because they generate oligodendrocytes (OLs) during early postnatal development (Nishiyama, 2007). OPCs remain abundant in the adult CNS and retain the ability to differentiate into OLs (Rivers et al., 2008; Kang et al., 2010) and can regenerate OLs after they have been destroyed through chemical or autoimmune-mediated demyelination (Franklin and ffrench-Constant, 2008; Tripathi et al., 2010). However, in chronic stages of disease in multiple sclerosis, axons remain demyelinated despite the presence of these progenitors near lesions (Chang et al., 2000), highlighting the need for a greater understanding of the factors that regulate OPC differentiation in vivo.
In all brain regions examined, OPCs express ionotropic glutamate receptors and form synapses with axons of glutamatergic neurons (Bergles et al., 2010), suggesting that OPC behavior may be influenced by neuronal activity (Barres and Raff, 1993). In support of this hypothesis, glutamate alters the proliferation, differentiation, and migration of OPCs in vitro (Gallo et al., 1996; Gudz et al., 2006). Both OPCs and OLs express functional NMDA receptors (NMDARs) (Káradóttir et al., 2005; Ziskin et al., 2007) that can induce intracellular Ca2+ transients (Micu et al., 2006), raising the possibility that signaling through these receptors modulates OPC physiology and controls myelination. Although NMDAR signaling influences the survival, migration, and differentiation of neuronal progenitors during development and shapes the physiological properties of mature neurons in the adult CNS (Komuro and Rakic, 1993; Ikonomidou et al., 1999; Malenka and Bear, 2004; Nacher and McEwen, 2006), the in vivo role of NMDAR signaling in OPCs has not been determined.
To evaluate the function of NMDAR signaling in OL lineage cells, we genetically deleted the NMDAR subunit NR1 from OPCs and their OL progeny in mice. Removal of NMDARs did not alter the survival of OPCs, their proliferation and migration, or their ability to develop into OLs during postnatal development. Moreover, myelination of major fiber tracts in the CNS proceeded normally, and these mice did not exhibit behaviors associated with myelin deficiency, indicating that NMDAR activation in OL lineage cells does not play a critical role in regulating oligodendrogenesis or myelination in vivo.
Materials and Methods
Breeding and experimental procedures for transgenic mice.
NR1flox/flox mice have been described previously (Fukushima et al., 2009). In these mice, exons 19–20 (putative transmembrane segment M4) of the gene for the NR1 subunit (Grin1) are flanked by LoxP sites. Olig1cre/+ mice were obtained from Dr. David Rowitch (University of California, San Francisco, San Francisco, CA) and have been described previously (Lu et al., 2002); in these mice, Cre recombinase was knocked into one allele of the Olig1 gene locus. PDGFαR–CreER bacterial artificial chromosome (BAC) transgenic mice have been described previously (Kang et al., 2010).
For inducible ablation of NMDARs within a cohort of OPCs and their progeny, NR1flox/flox mice were bred to PDGFαR–CreER as well as Z/EG reporter mice (Novak et al., 2000), which allows visualization of cells in which Cre was active. For electrophysiology experiments, PDGFαR–CreER;NR1+/+;Z/EG (P-NR1+/+) and PDGFαR–CreER;NR1flox/flox;Z/EG (P-NR1fl/fl) mice were given a single 1 mg intraperitoneal injection of 4-hydroxy-tamoxifen (4HT) during the third or fourth postnatal week and were analyzed 10–35 d after injection as indicated in text. For analysis of cell morphology and differentiation capacity, P-NR1+/+ and P-NR1fl/fl mice were given a single 0.1 mg subcutaneous injection of 4HT at P4 and were analyzed at P30. Some mice in these experiments were also given intraperitoneal injections of bromodeoxyuridine (BrdU) (10 mg/kg) twice daily for 2 d at P20.
For constitutive ablation of NMDARs within the oligodendrocyte lineage, Olig1cre/cre;NR1flox/+ mice were bred to Olig1+/+;NR1flox/+ mice to obtain both Olig1cre/+; NR1flox/flox (O-NR1fl/fl) and Olig1cre/+; NR1+/+ (O-NR1+/+) littermate offspring. To assess the extent and specificity of Cre activity, O-NR1+/+ and O-NR1fl/fl mice were bred to Z/EG reporter mice. For electrophysiology experiments, O-NR1+/+ and O-NR1fl/fl mice were bred to NG2–DsRed BAC transgenic mice (Ziskin et al., 2007; Zhu et al., 2008) to accurately identify OPCs in acute brain slices. For analysis of cell proliferation, O-NR1+/+ and O-NR1fl/fl mice aged P7 and P14 were given a single intraperitoneal injection of BrdU (300 mg/kg) 2 h before perfusion.
In all experiments, both male and female mice were used, and the number of males and females in each analysis group was balanced. All experiments were performed in strict accordance with protocols approved by the Animal Care and Use Committee at Johns Hopkins University.
Acute brain slice preparation.
Mice were anesthetized with isoflurane and decapitated; their brains were dissected into an ice-cold N-methyl-d-glucamine (NMDG)-based solution containing the following (in mm): 135 NMDG, 1 KCl, 1.2 KH2PO4, 20 choline bicarbonate, 10 glucose, 1.5 MgCl2, and 0.5 CaCl2, pH 7.4 (310 mOsm). Coronal forebrain slices (250 μm thick) were prepared using a vibratome equipped with sapphire blade in ice-cold NMDG-based cutting solution. After sectioning, slices were transferred to artificial cerebral spinal fluid (ACSF) containing the following (in mm): 119 NaCl, 2.5 KCl, 2.5 CaCl2, 1.3 MgCl2, 1 NaH2PO4, 26.2 NaHCO3, and 11 glucose (290 mOsm, maintained at 37°C for 30 min and at room temperature thereafter). Both NMDG solution and ACSF were bubbled continuously with 95% O2/5% CO2. All experiments were performed at room temperature.
Electrophysiology.
OPCs, Pre-OLs, and OLs were visualized with an upright microscope (Carl Zeiss Axioskop FS2) equipped with both differential interference contrast (DIC) optics and filter sets for Discosoma red (DsRed) (HQ:TRITC 41002c; Chroma Technology) and GFP (Brightline, GFP-A-Basic-ZHE; Semrock). Whole-cell recordings from OPCs, Pre-OLs, and OLs were made under visual control using both GFP and DsRed fluorescence and infrared (IR)-DIC as a guide. For hypertonic solution and UV uncaging experiments, the electrode solution consisted of the following (in mm): 100 CsCH3SO3H (cesium methansulfonate, CsMeS), 20 tetraethylammonium (TEA) chloride, 20 HEPES, 1 MgCl2, 10 EGTA, 2 sodium ATP, and 0.2 sodium GTP, pH 7.3 (295 mOsm). For experiments performed in current-clamp mode, CsMeS was replaced with KCH3SO3H (potassium methansulfonate, KMeS) in the electrode solution, and TEA was omitted. Pipette resistance was 3.4–4.2 MΩ, and recordings were made without series resistance compensation. Hypertonic solution (HS) (normal ACSF containing 500 mm sucrose; 850–900 mOsm) was focally delivered through a glass pipette (resistance, 1–1.5 MΩ) using a pressure application system (Pressure System IIc; Toohey Company) as described previously (De Biase et al., 2010). For glutamate uncaging experiments, 4-methoxy-7-nitroindolinyl (MNI)–l-glutamate (500 μm; Tocris Cookson) was locally perfused over the slice with a wide-bore glass pipette. Photolysis was accomplished with a 1 ms flash of UV light from a Stabilite 2017 argon laser (Spectra Physics) in a 100 μm circle centered on the cell body. d-Serine (30 μm; Sigma-Aldrich), a co-agonist at the NMDA receptor glycine binding site, was included in the ACSF during experiments aimed at detecting NMDAR-mediated currents. For AMPAR rectification experiments, spermine (100 μm; Tocris Cookson) was included in the recording pipette. The following agents were applied by addition to the superfusing ACSF: tetrodotoxin (TTX) [voltage-gated sodium channel (NaV) antagonist, 1 μm; Ascent Scientific]; gabazine (SR-95531 [2-(3-carboxypropyl)-3-amino-6-(4-methoxyphenyl)pyridazinium bromide]) (GABA receptor antagonist, 5 μm; Tocris Cookson); CPP [3-((R,S)-2-carboxypiperazine-4-yl)-propyl-1-phosphonic acid] (NMDA receptor antagonist, 5 or 20 μm for uncaging; Tocris Cookson); 2,3-dihydroxy-6-nitro-7-sulfamoyl-benzo(f)quinoxaline (NBQX) (competitive AMPA/kainate receptor antagonist, 5 or 50 μm for uncaging; Tocris Cookson); GYKI 53655 [1-(4-aminophenyl)-3-methylcarbamyl-4-methyl7,8-methylenedioxy-3,4-dihydro-5H-2,3-benzodiazepine] (AMPA selective, noncompetitive antagonist, 100 μm; IVAX); and 7-chlorokynurenic acid (NMDAR antagonist acting at the glycine site, 50 μm; Tocris Cookson).
Electrophysiology analysis.
Responses were recorded using a MultiClamp 700A amplifier (Molecular Devices), filtered at 3 kHz, digitized at 50 kHz, and recorded to disk using pClamp9.2 software (Molecular Devices). Data were analyzed offline using Clampfit (Molecular Devices), Origin (OriginLab), and MiniAnalysis (Synaptosoft) software. Membrane resistance and membrane capacitance were calculated from a 10 mV depolarizing step (holding potential, −80 mV). The amplitude of NaV was calculated from a 70 mV depolarizing step (holding potential, −80 mV) performed before and after application of TTX and within 2 min of initiating whole-cell recording. Resting membrane potential was measured within 30 s of establishing whole-cell recording (KMeS-based internal solution). The response to HS was quantified by counting the number of evoked miniature EPSCs (mEPSCs) (>5 pA amplitude, <1 ms rise time as measured in MiniAnalysis software, within 15 s of stimulus onset) during two successive puffs (separated by at least 1.5 min). For clarity, slow alterations in holding current observed during HS application were subtracted from baseline using pClamp software. For experiments in P-NR1+/+ and P-NR1fl/fl mice in which EGFP+ cells may be OPCs, Pre-OLs, or OLs, basic membrane properties were used to categorize the stage of cell differentiation as described previously (De Biase et al., 2010). Specifically, cells with NaV current and <35 pF capacitance were considered to be OPCs, cells with or without NaV current with >35 pF capacitance and >500 MΩ membrane resistance were considered Pre-OLs, and cells that lacked NaV currents with <500 MΩ membrane resistance were considered OLs.
Immunohistochemistry.
Mice were deeply anesthetized with sodium pentobarbital (100 mg/kg) and perfused transcardially with 4% paraformaldehyde in 0.1 m sodium phosphate buffer. Brain tissue was isolated and postfixed in this solution for 6–18 h at 4°C, then washed in phosphate buffer, cryoprotected in 30% sucrose, and sectioned at 30–60 μm thickness on a cryostat (Microm). Free-floating sections were permeabilized/blocked with 0.3% Triton X-100 and 5% normal donkey serum in 0.1 m sodium phosphate buffer for 2 h at room temperature or 4°C overnight. Sections were incubated with primary antibodies prepared in permeabilizing/blocking solution for 4 h at room temperature or 4°C overnight. Sections were incubated with secondary antibodies in 5% normal donkey serum in 0.1 m sodium phosphate buffer for 2 h at room temperature. For immunolabeling with CC1 antibody, sections were treated with LAB solution (Polysciences) for 10–15 min before blocking. For visualization of cells with incorporated BrdU, sections were incubated with 2N HCl at 37°C for 30 min, washed twice with 0.1M borate buffer for 5 min, and were then permeabilized/immunostained as outlined above. Control sections incubated with secondary antibody alone did not result in labeling of cells. Primary antibodies used included the following: rabbit anti-NG2 (1:500; gift from Dr. Stallcup, Burnham Institute, La Jolla, CA), rabbit anti-GFP (1:500; gift from Dr. Huganir, Johns Hopkins University, Baltimore, MD), chicken anti-GFP (1:500; Aves), goat anti-GFP (1:500; Frontier Institute, Denver, CO), rabbit anti-PDGFαR (1:500; gift from Dr. Stallcup, Burnham Institute), rat anti-PDGFαR (1:500; BD Biosciences Pharmingen), guinea pig anti-GFAP (1:500; Advanced ImmunoChemical), rabbit anti-GFAP (1:500; Sigma), mouse anti-myelin basic protein (MBP) (1:1000; Sternberger Monoclonals), ALDH1 (1:100; UC Davis/NeuroMab, Davis, CA), mouse anti-NeuN (1:500; Millipore), CC1 (1:50; anti-APC/Ab-7; Calbiochem), guinea pig anti-Olig2 (1:10,000; gift from Dr. Ben Novitch, University of California, Los Angeles, Los Angeles, CA), and rabbit anti-Olig2 (1:500; Millipore). Secondary antibodies (raised in donkey) used included the following: Alexa Fluor 488- (Invitrogen), Cy2-, Cy3-, or Cy5-conjugated secondary antibodies to rabbit, mouse, goat, or guinea pig (1:500; Jackson ImmunoResearch).
Image acquisition and analysis.
For evaluation of MBP immunostaining, quantification of oligodendrocyte lineage cell density, and cell proliferation analysis, fluorescence images were collected on a AxioImager M1 microscope (Carl Zeiss). For analysis of cell differentiation capacity in P-NR1+/+/P-NR1fl/fl mice and extent of Cre expression in O-NR1+/+/O-NR1fl/fl mice, fluorescence images were acquired with an LSM 510 Meta confocal microscope (Carl Zeiss) or an LSM 710 Meta confocal microscope (Carl Zeiss). For morphological analysis of OPCs in P-NR1+/+/P-NR1fl/fl mice, stacks of confocal images (0.3 μm z-interval) of EGFP+PDGFαR+ cortical OPCs were imported into Imaris software for 3D morphological reconstruction and quantification. For analysis of Cre expression in O-NR1+/+/O-NR1fl/fl mice (bred to Z/EG reporter), six O-NR1+/+ mice (P30–P55) and one O-NR1fl/fl (P55) mouse were examined. To evaluate colocalization between BrdU and PDGFαR or Olig2, three O-NR1fl/fl and three O-NR1+/+ mice were examined at P7, and six O-NR1fl/fl and five O-NR1+/+ mice were examined at P14. In the differentiation capacity analysis, to evaluate colocalization between EGFP and PDGFαR or CC1, six P-NR1fl/fl and four P-NR1+/+ mice were examined. In all histological analysis, at least four brain sections from each mouse were analyzed.
Western blot analysis.
O-NR1fl/fl and O-NR1+/+ mice age P24–P26 and P55–P58 were deeply anesthetized with isoflurane and perfused transcardially with ice-cold PBS. Mouse cortical tissue was carefully microdissected and flash frozen in 2-methyl butane chilled with dry ice. Tissue samples were then homogenized in RIPA buffer (Boston BioProducts) using a hand-held homogenizer. Protein concentration was determined using Bio-Rad protein assay. For MBP and 2′, 3′-cyclic nucleotide 3′-phosphodiesterase (CNP) immunoblots, protein samples were denatured in Laemli's SDS sample buffer containing β-mercaptoethanol. For detection of myelin associated glycoprotein (MAG), protein samples were prepared in a non-denaturing Laemli's sample buffer (Boston BioProducts). Twenty micrograms of each sample were separated on a 12% Tris HCl gel (Bio-Rad) and transferred to a PVDF membrane. Membranes were blocked in 0.1% Tween 20 TBS containing 5% nonfat milk for 1 h before incubation with primary antibodies. Primary antibodies were diluted in the same solution as follows: anti-CNP (1:200, clone 11-5B; Millipore), anti-MBP (1:1000, clone smi99; Covance), anti-MAG (1:300, clone 513; Millipore), and anti-β-actin (1:1000, clone 20-33; Sigma). Anti-mouse or anti-rabbit secondary antibodies conjugated to IRDye 680 or 800 were incubated for 1 h before scanning the membrane on a LI-COR Odyssey imager. Images were analyzed using the Odyssey infrared imaging system application software version 3.0. Protein expression was normalized to β-actin.
Electron microscopic analysis.
O-NR1fl/fl and O-NR1+/+ mice aged P24–P26 and P55–P57 were anesthetized with pentobarbital and perfused transcardially with 4% paraformaldehyde/2.5% glutaraldehyde in 0.1 m phosphate buffer. Brain tissue was isolated and postfixed in this solution for 4 h at 4°C and then washed in phosphate buffer. Brains were treated with 2% OsO4 for 1 h. After washes in water, samples were incubated in 2% uranyl acetate for 30 min. After dehydration using 50, 70, 90, and 100% ethanol and 100% propylene oxide, samples were embedded in Epon 812 resin (Ted Pella). Ultrathin sections were obtained using a Leica Ultracut UCT and stained with 2% uranyl acetate and lead citrate. Electron micrographs were taken with an H-7100 electron microscope (Hitachi). NIH Image J software was used to measure the diameter of axons and their myelin sheaths.
Statistics.
Data are expressed as mean ± SEM throughout, and statistical significance was determined using the Mann–Whitney test with a cutoff value of 0.05 and Kruskal–Wallis ANOVA with sequential Bonferroni's correction for multiple comparisons.
Results
Postnatal removal of NMDA receptors from OPCs and their OL progeny in vivo
NMDARs are formed through the heteromeric assembly of NR1 and NR2 or NR3 subunits. The NR1 subunit contains the binding site for glycine/d-serine, and without this subunit functional NMDARs cannot be formed (Forrest et al., 1994). To determine whether NMDAR expression within the OL lineage is required for OPC survival and OL generation in vivo, we bred mice in which exons 19–20 of the NR1 gene (Grin1) are flanked by loxP sites (NR1flox/flox mice) (Fukushima et al., 2009) to mice expressing inducible Cre recombinase (CreER) under control of the PDGFαR promoter (PDGFαR–CreER mice) (Kang et al., 2010) as well as the Z/EG reporter (Novak et al., 2000) (Fig. 1A). In triple transgenic mice, injection of 4HT should activate Cre within a cohort of OPCs and induce EGFP expression and NR1 excision. Indeed, when control (PDGFαR–CreER;NR1+/+;Z/EG) or inducible knock-out (PDGFαR–CreER;NR1flox/flox;Z/EG) mice, hereafter referred to as P-NR1+/+ and P-NR1fl/fl, respectively, were injected with 4HT (0.1 mg) at P4 and examined at P30, EGFP+ cells were found throughout the forebrain (Fig. 1B); some of these cells remained PDGFαR+ OPCs (Fig. 1D), but many had differentiated into mature CC1+ oligodendrocytes (see Fig. 3A), consistent with previous results (Kang et al., 2010).
Figure 1.
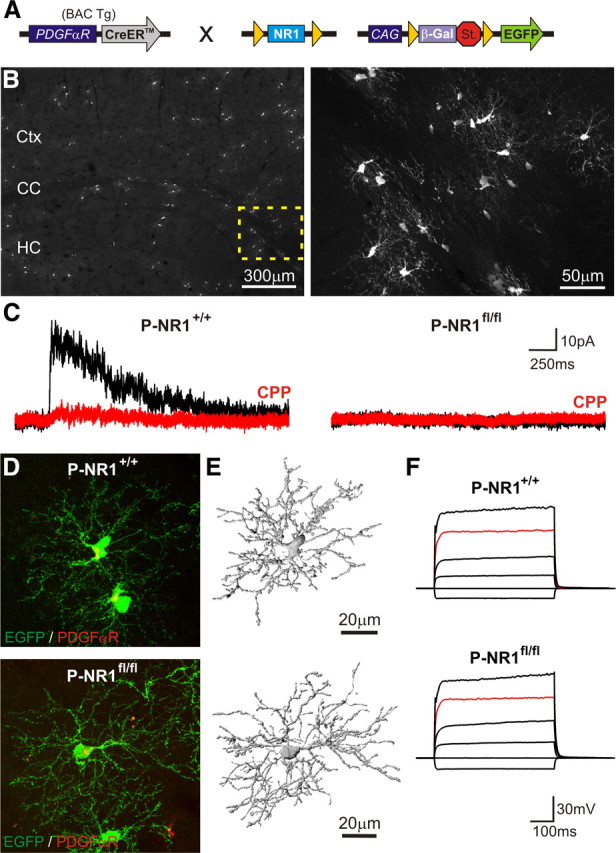
Inducible ablation of NMDARs from postnatal OPCs does not alter cell morphology or basic membrane properties. A, Genetic strategy used to disrupt NMDAR expression within a cohort of postnatal OPCs. St., Stop. B, Extent of Cre activity in P-NR1+/+ mice as revealed by EGFP expression in forebrain. The region of corpus callosum highlighted by the dashed box is shown at higher magnification in the right panel. Mice were injected with 0.1 mg of 4HT at P4 and examined at P30. HC, Hippocampus; Ctx, cortex. C, Response of callosal OPCs in acute brain slices from P-NR1+/+ and P-NR1fl/fl mice to photolysis of caged glutamate (MNI–l-glutamate, 500 μm). Currents were elicited at a holding potential of 40 mV and in the presence of antagonists for AMPA/kainate receptors (50 μm NBQX, 100 μm GYKI 53655) and voltage-gated sodium channels (1 μm TTX). NMDAR-mediated currents (sensitive to CPP, 20 μm) were not observed in OPCs in P-NR1fl/fl mice (n = 14 cells). Mice were injected with 4HT at P16–P30 and recorded 10–15 d after injection. D, EGFP+PDGFαR+ cortical OPCs from P-NR1+/+ (top) and P-NR1fl/fl (bottom) mice; mice injected with 4HT at P4 and examined at P30. E, 3D reconstruction of OPCs shown in D. F, Response of representative callosal OPCs in P-NR1+/+ and P-NR1fl/fl mice to depolarization. Red trace, Injection of 640 pA. Mice were P40–P45 and were >19 d after 4HT injection.
Figure 3.
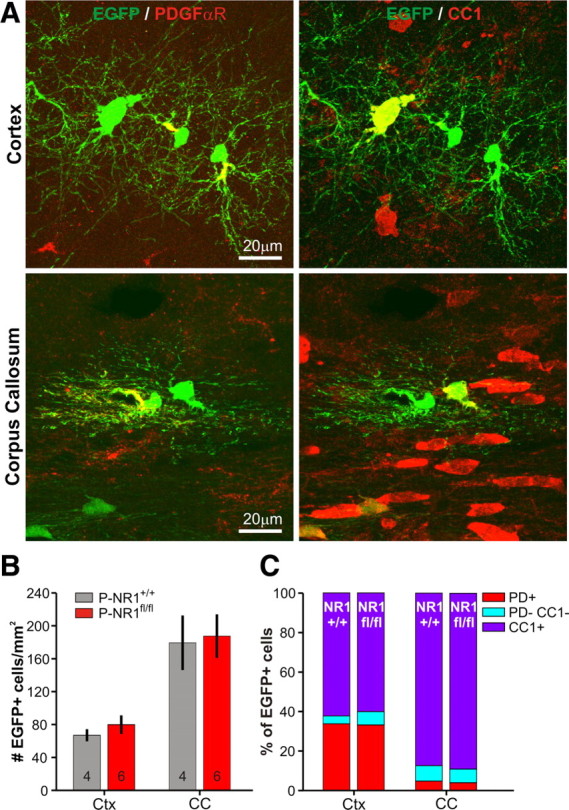
OPCs generate oligodendrocytes efficiently in the absence of NMDARs. A, Immunostaining for EGFP, PDGFαR (pseudocolored red), and CC1 in the cortex and corpus callosum illustrating the strategy used to identify PDGFαR+ OPCs and CC1+ mature oligodendrocytes in P-NR1+/+ and P-NR1fl/fl mice. Mice were injected with 4HT at P4 and examined at P30. B, Density of EGFP+ cells in Ctx and CC; n for each group indicated at the base of the column. The density of EGFP+ cells was not significantly different between genotypes (Ctx, p = 0.46; CC, p = 0.75) but was significantly different between brain regions (Ctx vs CC, p = 0.0003). C, The identity of EGFP+ cells in P-NR1+/+ and P-NR1fl/fl mice expressed as a percentage of the total number of EGFP+ cells. PD, PDGFαR. The percentage of EGFP+ cells that had become mature oligodendrocytes (CC1+) was not significantly different between genotypes (Ctx, p = 0.24; CC, p = 1) but was significantly different between brain regions (Ctx vs CC, p = 0.0002).
To confirm that Cre activity was sufficient to eliminate functional NMDARs within these cells, fluorescence-guided whole-cell recordings were made from EGFP+ OPCs in the corpus callosum (CC) of mice injected with 4HT (1 mg) during the third or fourth postnatal week and examined 10–15 d later. Local photolysis of caged glutamate (MNI–l-glutamate) elicited transient inward currents in all OPCs from both P-NR1+/+ (n = 15 cells) or P-NR1fl/fl mice (n = 14 cells), indicating that glutamate receptors were expressed. Although outward currents sensitive to the NMDAR antagonist CPP (20 μm) were observed in the majority of OPCs in P-NR1+/+ mice (10 of 15 cells, n = 3 mice), CPP-sensitive currents were not observed in OPCs from P-NR1fl/fl mice (0 of 14 cells, n = 3 mice) (Fig. 1C). These results indicate that this genetic strategy is effective at preventing the formation of functional NMDARs in OPCs.
NMDAR-deficient OPCs display normal morphological and physiological properties
NMDAR activation has been shown to influence neurite outgrowth and spine morphogenesis in developing neurons (Ponimaskin et al., 2007). OPCs elaborate numerous, highly branched processes and make contact with surrounding axons (Butt et al., 1999; Dawson et al., 2003; Bergles et al., 2010), but the factors governing OPC process extension are unknown. To determine whether NMDAR signaling influences OPC morphology, P-NR1+/+ and P-NR1fl/fl mice were injected with 4HT (0.1 mg) at P4 and examined at P30. Morphological reconstructions of isolated EGFP+PDGFαR+ OPCs in the cortex (Ctx) (Fig. 1D,E) revealed no significant differences in total process length (P-NR1+/+, 2233 ± 204 μm, n = 3 cells; P-NR1fl/fl, 2328 ± 285 μm, n = 3 cells; p = 1.0) or number of branch points (P-NR1+/+, 334 ± 13, n = 3 cells; P-NR1fl/fl, 308 ± 24, n = 3 cells; p = 0.66) between OPCs in P-NR1+/+ and P-NR1fl/fl mice, suggesting that NMDAR activation does not play a prominent role in determining the extent of outgrowth or branching of OPC processes.
To determine whether NMDAR deletion resulted in changes in the membrane properties of OPCs, we recorded from OPCs in the corpus callosum of P-NR1+/+ and P-NR1fl/fl mice aged P40–P45 (>19 d after 4HT administration). Callosal OPCs typically exhibit a small membrane capacitance (Cm, ∼12–35pF), a negative resting membrane potential (Vm, approximately −90 mV), and a moderate membrane resistance (Rm, ∼100–1000 MΩ) (Ziskin et al., 2007; De Biase et al., 2010). None of these membrane properties were significantly altered in NMDAR-deficient OPCs (P-NR1+/+ Cm, 21 ± 2 pF; P-NR1fl/fl Cm, 23 ± 1 pF, p = 0.06, n = 19–24 cells; P-NR1+/+ Vm, −87 ± 1 mV; P-NR1fl/fl Vm, −86 ± 0.5 mV, p = 0.29, n = 5–10 cells; P-NR1+/+ Rm, 503 ± 417 MΩ, P-NR1fl/fl Rm, 286 ± 132 MΩ, p = 0.43, n = 5–10 cells). Callosal OPCs also express NaV channels and display complex voltage responses to injection of depolarizing current (Ziskin et al., 2007; De Biase et al., 2010). All recorded OPCs possessed NaV currents (P-NR1+/+, 29 of 29 cells; P-NR1fl/fl, 15 of 15 cells), and NMDAR-deficient OPCs exhibited comparable responses to depolarization (Fig. 1F); however, there was a small but significant reduction in NaV current density in OPCs from P-NR1fl/fl mice (P-NR1fl/fl, 10 ± 1 pA/pF; P-NR1+/+, 17 ± 1 pA/pF; p = 0.002, n = 15–29 cells). Together, these data indicate that NMDAR signaling does not play a prominent role in regulating the membrane properties of OPCs.
OPCs generate oligodendrocytes efficiently in the absence of NMDARs
Maturation of OPCs into myelinating OLs is accompanied by dramatic alterations in their morphological and physiological properties (De Biase et al., 2010; Kukley et al., 2010), changes that are thought to enable successful maturation (Gallo et al., 1996; Knutson et al., 1997). To evaluate whether these progressive changes in membrane properties are maintained in the absence of NMDARs, P-NR1+/+ and P-NR1fl/fl mice were injected with 4HT during the third postnatal week, and whole-cell patch-clamp recordings were performed from EGFP+ cells in the corpus callosum 24–26 d after injection. In accordance with previous results (Sontheimer et al., 1989; Ziskin et al., 2007; De Biase et al., 2010), OPCs, premyelinating oligodendrocytes (Pre-OLs), and OLs in control mice exhibited stereotyped responses to depolarization: OPCs displayed nonlinear responses attributable to activation of voltage-activated conductances and intermediate Rm, Pre-OLs exhibited larger membrane potential shifts attributable to their higher Rm, and OLs had a low Rm and displayed a prolonged “tail current” after cessation of current injection (Fig. 2A,B). Pre-OLs and OLs from P-NR1+/+ mice also showed increased Cm and positive shifts in Vm relative to OPCs (Fig. 2C,D), as described previously (De Biase et al., 2010; Kukley et al., 2010). Similar physiological changes were observed in Pre-OLs and OLs from P-NR1fl/fl mice (Fig. 2A–D), suggesting that NMDAR activation does not play an essential role in triggering the physiological changes that these cells undergo during maturation.
Figure 2.

Membrane properties of differentiating OL lineage cells are preserved in the absence of NMDARs. A, Response of representative OPCs, Pre-OLs, and OLs from P-NR1+/+ mice (top) and P-NR1fl/fl mice (bottom) to depolarization. Resting potential of each cell is indicated to the left. Red trace, Injection of 320 pA. Green trace, Injection of 40 pA. Gray trace, Injection of 1000 pA. B–D, Rm, Cm, and Vm of OPCs, Pre-OLs, and OLs in P-NR1+/+ and P-NR1fl/fl mice. In both genotypes, Pre-OLs exhibited increased Rm and OLs exhibited decreased Rm relative to OPCs. In both genotypes, Pre-OLs and OLs displayed increased Cm and positive shifts in Vm relative to OPCs.
During early postnatal development, NMDAR signaling is thought to promote the survival of immature neurons (Ikonomidou et al., 1999; Adams et al., 2004) and play a role in guiding the differentiation of neural progenitors (Nacher and McEwen, 2006). To determine whether NMDAR activation similarly impacts the survival of OPCs or their capacity to generate OLs, P-NR1+/+ and P-NR1fl/fl mice were injected with 4HT (0.1 mg) at P4 and examined at P30 (Fig. 3A). In accordance with the prominent generation of OLs in white matter at this age, the density of EGFP+ cells was significantly higher in corpus callosum than cortex (CC vs Ctx, p = 0.0003), and a greater proportion of EGFP+ cells were immunopositive for CC1, a marker of mature OLs (CC vs Ctx, p = 0.0002) (Fig. 3B,C). However, neither the density of EGFP+ cells (Ctx, p = 0.46; CC, p = 0.75) (Fig. 3B) nor the percentage of EGFP+CC1+ cells (Ctx, p = 0.24; CC, p = 1.0) (Fig. 3C) varied between P-NR1+/+ (n = 4) and P-NR1fl/fl (n = 6) mice. Furthermore, when mice were injected with BrdU before analysis, the number of EGFP+BrdU+ cells in cortex and corpus callosum did not differ between P-NR1+/+ and P-NR1fl/fl mice (Ctx, p = 0.22; CC, p = 0.6). These data indicate that NMDAR signaling is not essential for OPC survival or differentiation. Furthermore, because NR1 excision does not occur in all OPCs using this inducible approach, NMDAR-deficient and NMDAR-containing OPCs coexist within the same tissue; therefore, these data also indicate that NMDAR-deficient OPCs are not at a competitive disadvantage, in terms of survival and maturation, compared with neighboring OPCs that engage in NMDAR signaling.
Genetic deletion of NMDARs from the entire oligodendrocyte lineage
NMDAR-deficient OPCs in P-NR1fl/fl mice did not exhibit overt deficits; however, these experiments do not address whether NMDAR signaling in embryonic or early postnatal ages is involved in OPC development. Moreover, while comparable numbers of CC1+ OLs were generated from NMDAR-deficient OPCs in these mice, the capacity of these OLs to generate myelin is difficult to assess quantitatively using this approach. Therefore, we genetically deleted NR1 from the entire OL lineage by breeding NR1flox/flox mice to mice in which Cre recombinase was knocked into one allele of the Olig1 gene locus (Lu et al., 2002) (Olig1cre/+ mice) (Fig. 4A, inset). The transcription factor Olig1 is expressed embryonically by progenitors that give rise to the OL lineage (Ligon et al., 2006); thus, in Olig1cre/+; NR1flox/flox mice, Cre-mediated removal of NR1 should occur shortly after specification of OL lineage cells, preventing expression of functional NMDARs in all OPCs and OLs throughout life. Olig1cre/+; NR1flox/flox mice were bred to Z/EG reporter mice to determine the extent and specificity of Cre-mediated recombination (Fig. 4A). In both control (Olig1cre/+;NR1+/+;Z/EG) and constitutive NR1 knock-out (Olig1cre/+; NR1flox/flox;Z/EG) mice at P30, EGFP was expressed by PDGFαR+, NG2+, and Olig2+ cells throughout the cortex and corpus callosum (Fig. 4B–D), confirming that Cre-mediated recombination occurred in the majority of OL lineage cells (Lu et al., 2002). In addition, EGFP was also expressed by many cortical astrocytes, as well as rare neurons (data not shown), as described previously (Samanta et al., 2007). Control (Olig1cre/+;NR1+/+) and NR1 knock-out (Olig1cre/+; NR1flox/flox) mice in this constitutive NMDAR ablation approach are hereafter referred to as O-NR1+/+ and O-NR1fl/fl mice, respectively.
Figure 4.
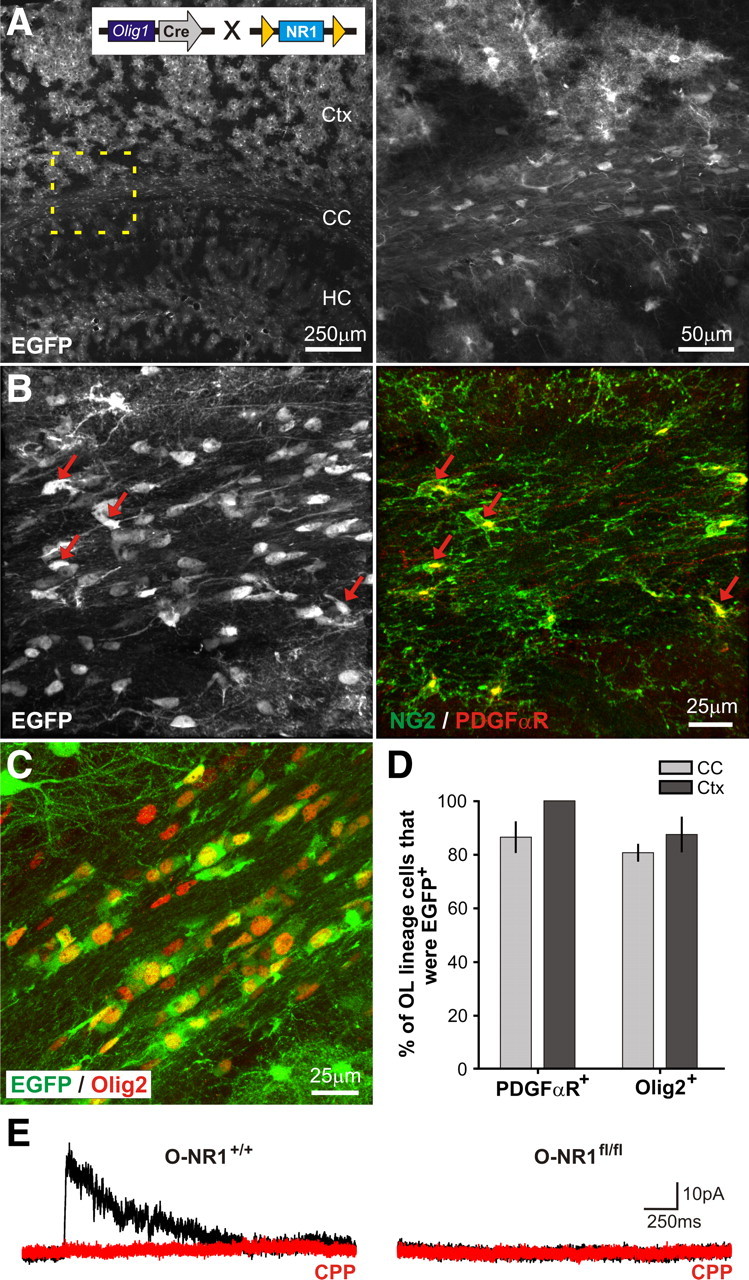
Constitutive ablation of NMDARs from the entire oligodendrocyte lineage. A, Extent of Cre activity in O-NR1+/+ mice (bred to Z/EG reporter mice) as revealed by EGFP expression in the forebrain. HC, Hippocampus. The region of corpus callosum highlighted by the dashed box is shown at higher magnification at right. Inset shows the genetic strategy used to delete the NR1 subunit from oligodendrocyte lineage cells. B, Immunostaining for EGFP, PDGFαR, and NG2 (pseudocolored green) reveals that the majority of OPCs in corpus callosum were EGFP+. Red arrows highlight several examples. C, EGFP expression within Olig2+ oligodendrocyte lineage cells in the corpus callosum of O-NR1+/+ mice. D, Graph showing the percentage of PDGFαR+ or Olig2+ cells that expressed EGFP in the corpus callosum and cortex of O-NR1+/+ mice (mice were P30). E, NMDAR-mediated currents recorded from OPCs in the corpus callosum of young adult (P20–P40) O-NR1+/+ and O-NR1fl/fl mice (bred to NG2–DsRed mice). Currents were elicited by UV uncaging of MNI–l-glutamate (500 μm) at a holding potential of 40 mV in antagonists of AMPA/kainate receptors (50 μm NBQX, 100 μm GYKI 53655) and voltage-gated sodium channels (1 μm TTX). CPP-sensitive currents were not observed in OPCs in O-NR1fl/fl mice (n = 10 cells).
To determine whether NMDAR expression was prevented within the OL lineage, responses to glutamate were examined in callosal OPCs from O-NR1+/+ and O-NR1fl/fl mice. Both lines of mice were crossed to NG2–DsRed mice (Ziskin et al., 2007) to allow accurate, fluorescence-guided whole-cell recording from OPCs in acute brain slices. Local photolysis of caged glutamate (MNI–l-glutamate) elicited transient inward currents in all OPCs from both O-NR1+/+ (n = 9 cells) and O-NR1fl/fl (n = 10 cells) mice, indicating that glutamate receptors were expressed. Although outward currents sensitive to CPP (20 μm) were observed in the majority of OPCs in O-NR1+/+ mice (7 of 9 cells, n = 2 mice) (Fig. 4E), CPP-sensitive currents were not observed in OPCs from O-NR1fl/fl mice (0 of 10 cells, n = 3 mice), indicating that this genetic strategy is effective at preventing the formation of functional NMDARs in OL progenitors.
Early NMDAR deletion does not alter the survival or basic membrane properties of OPCs
Despite the absence of NMDARs in OL lineage cells, O-NR1fl/fl mice were viable, survived into adulthood, and did not exhibit behaviors associated with hypomyelination, such as tremors, ataxia, or seizures (Filley, 2001). Moreover, these mice did not display gross anatomical abnormalities in either the forebrain or cerebellum. To determine whether NMDAR removal affected the viability of OL lineage cells, the distribution of PDGFαR+ OPCs and Olig2+ OL lineage cells was examined during early postnatal periods (P7–P8, P13–P14). In both the cortex and corpus callosum of O-NR1fl/fl mice, the density of OL lineage cells was unaltered (Fig. 5), suggesting that both the survival and migration of OPCs remains intact. However, OPCs are highly proliferative during development (Psachoulia et al., 2009) and can compensate for profound reductions in cell number to establish normal cell density and patterns of myelination (Kessaris et al., 2006). To determine whether a deficit in OPC or OL survival was masked by enhanced proliferation of these progenitors, BrdU incorporation by OL lineage cells was examined in early postnatal O-NR1+/+ and O-NR1fl/fl mice. OPC proliferation did not differ significantly different between the two genotypes (P7–P8: Ctx, p = 0.66; CC, p = 1.0; P13–P14: Ctx, p = 0.11; CC, p = 0.86) (Fig. 6), indicating that NMDAR activation is not critical for OPC survival.
Figure 5.

NMDAR-deficient OPCs achieve normal densities. A, Representative images of PDGFαR+ (top) and Olig2+ cells (bottom) in the corpus callosum of early postnatal (P7–P14) O-NR1+/+ mice. B, Graph showing the density of PDGFαR+ cells in the Ctx and CC of P7 O-NR1+/+ and O-NR1fl/fl mice. Differences between genotypes are not significant (Ctx, p = 1; CC, p = 1), whereas differences between brain regions are significant (Ctx vs CC, p = 0.005). C, Graph showing the density of Olig2+ cells in the cortex and corpus callosum of P14 O-NR1+/+ and O-NR1fl/fl mice. Differences between genotype are not significant (Ctx, p = 1; CC, p = 0.38), whereas differences between brain regions are significant (Ctx vs CC, p = 0.0007). B, C, n indicated at the base of each column.
Figure 6.
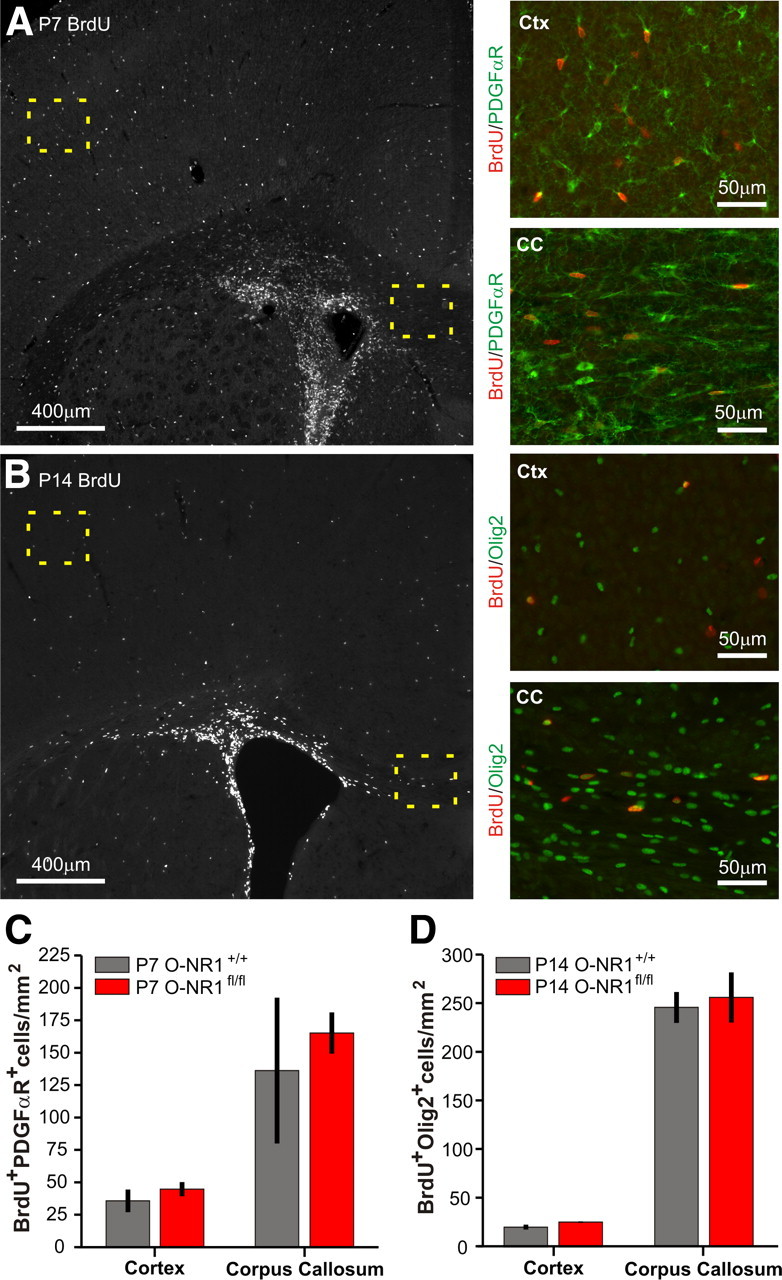
OPC proliferation is unaltered by removal of NMDARs. A, BrdU labeling of proliferating cells in representative forebrain section of early postnatal (P7–P8) O-NR1+/+ mouse. Regions of Ctx and CC highlighted by dashed boxes are shown at higher magnification at right and illustrate coimmunostaining for BrdU and OPC marker PDGFαR. B, BrdU labeling of proliferating cells in representative forebrain section of P13–P14 O-NR1+/+ mouse. Regions of Ctx and CC highlighted by dashed boxes are shown at higher magnification at right and illustrate coimmunostaining for BrdU and oligodendrocyte lineage marker Olig2. C, Quantification of proliferating PDGFαR+ cells in P7–P8 O-NR1+/+ and O-NR1fl/fl mice (n = 3 mice per genotype). Differences between genotypes were not significant (Ctx, p = 0.66; CC, p = 1) but differences between brain regions were significant (Ctx vs CC, p = 0.03). D, Quantification of proliferating Olig2+ cells in P13–P14 O-NR1+/+ (n = 6) and O-NR1fl/fl (n = 4) mice. Differences between genotypes were not significant (p = 0.11; CC, p = 0.86), but differences between brain regions were significant (Ctx vs CC, p = 0.0008).
To determine whether embryonic NMDAR deletion altered the membrane properties of OPCs, fluorescence-guided whole-cell recordings were made from DsRed+ OPCs in the corpus callosum, cortex, and hippocampus of O-NR1+/+ and O-NR1fl/fl mice (P40–45). Consistent with observations in P-NR1fl/fl mice, callosal OPCs from O-NR1fl/fl mice exhibited normal Cm, Vm, and Rm (O-NR1+/+ Cm, 21 ± 1 pF; O-NR1fl/fl Cm, 21 ± 1 pF, p = 0.89, n = 32–44 cells; O-NR1+/+ Vm, −88 ± 1 mV; O-NR1fl/fl Vm, −87 ± 1 mV, p = 0.39, n = 6–11 cells; O-NR1+/+ Rm, 91 ± 11 MΩ; O-NR1fl/fl Rm, 239 ± 93 MΩ, p = 0.13, n = 6–11 cells). Furthermore, callosal OPCs from O-NR1fl/fl and O-NR1+/+ mice displayed similar responses to depolarization (data not shown), and all recorded OPCs possessed NaV currents (NR1+/+, 23 of 23 cells; O-NR1fl/fl, 32 of 32 cells). There was a trend toward reduced NaV density in OPCs from O-NR1fl/fl mice, but unlike P- NR1fl/fl mice, this difference was not statistically significant (O-NR1fl/fl, 14 ± 1 pA/pF; O-NR1+/+, 16 ± 2 pA/pF, p = 0.36). Recordings from OPCs in the cortex and hippocampus in O-NR1fl/fl mice revealed that basic membrane properties were similarly preserved in gray matter OPCs that lacked NMDARs (data not shown). Together, these data confirm that NMDAR signaling does not play a prominent role in regulating the membrane properties of OPCs.
Myelination is preserved in the absence of OL lineage NMDAR signaling
To determine whether activation of OL lineage NMDARs plays a role in CNS myelination, we examined the progressive developmental changes in white matter tracts through MBP immunolabeling. The onset of MBP expression in the forebrain was observed at P7–P8 in both O-NR1+/+ and O-NR1fl/fl mice (Fig. 7A), and formation of major myelin tracts was indistinguishable between the two genotypes at P14 (Fig. 7B). Moreover, the extent of myelination in adults (P55–P57) was not qualitatively different between the two genotypes (Fig. 7C). To obtain a quantitative measure of OL maturation, the abundance of major myelin proteins in cortex and subcortical white matter was compared by Western blot (Fig. 8A). Although the levels of MBP, CNP, and MAG increased with developmental age (P24–P26 vs P55–P57: MBP, p = 0.005; CNP, p = 0.005; MAG, p = 0.008) (Fig. 8B), the abundance of these proteins did not differ significantly between O-NR1+/+ and O-NR1fl/fl mice (P24–P26: MBP, p = 0.66; CNP, p = 1.0; MAG, p = 0.38; P55–P58: MBP, p = 1.0; CNP, p = 0.66; MAG, p = 1.0), indicating that myelin protein expression occurs normally without NMDAR activation in OL lineage cells.
Figure 7.
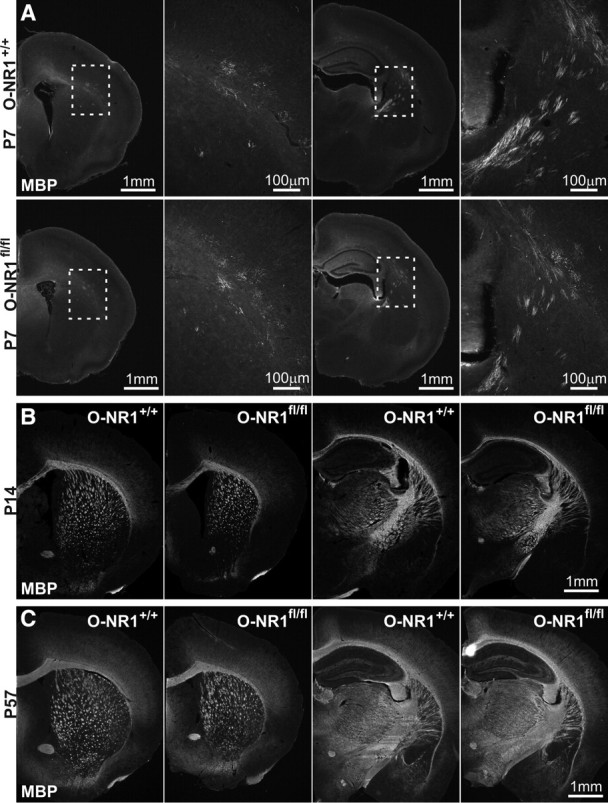
Myelinated tracts form normally in the absence of OL lineage NMDARs. A, Immunostaining for MBP in early postnatal (P7) O-NR1+/+ and O-NR1fl/fl mice in the rostral and caudal forebrain. Regions with nascent MBP immunoreactivity are highlighted by the dashed boxes and shown at higher magnification in adjacent panels at the right. B, MBP immunostaining in developing (P14) O-NR1+/+ and O-NR1fl/fl mice in the rostral and caudal forebrain, showing the emergence of major myelin tracts. C, MBP immunostaining in mature (P57) O-NR1+/+ and O-NR1fl/fl mice in the rostral and caudal forebrain, showing similar degree of myelination in the absence of NMDAR expression by OL lineage cells.
Figure 8.

Myelin protein expression increases and compact myelin is formed in the absence of OL lineage NMDARs. A, Western blot analysis of MBP, CNP, and MAG in the cortex/subcortical white matter of O-NR1+/+ (+) and O-NR1fl/fl (f) mice; n = 3 mice per genotype per age. B, Relative abundance of MBP, CNP, and MAG normalized to β-actin. Differences between genotypes were not significant (P24–P26: MBP, p = 0.66; CNP, p = 1; MAG, p = 0.38; P55–P58: MBP, p = 1; CNP, p = 0.66; MAG, p = 1). Differences between age groups were significant (P24–P26 vs P55–P58: MBP, p = 0.005; CNP, p = 0.005; MAG, p = 0.008). C, Representative electron micrographs of corpus callosum from P24–P26 and P55–P57 O-NR1+/+ and O-NR1fl/fl mice. Scale bar, 1 μm. D, Plot of g-ratio (diameter of axon/diameter of axon+myelin) versus axon diameter for O-NR1+/+ and O-NR1fl/fl mice at these two stages of development. Shown is a linear fit to pooled data from all mice (n ≥ 3 mice) for each genotype. E, Variability (R2) for the g-ratio versus axon diameter distribution. n is indicated at the base of each column. R2 values were not significantly different between genotypes (P24–P26, p = 0.67; P55–P58, p = 1) but increased with development (P24–P26 vs P55–P57, p = 0.04). F, Slope of g-ratio versus axon diameter from individual mice. Slopes were not significantly different between genotypes (P24–P26, p = 0.67; P55–P58, p = 0.86) or between ages (P24–P26 vs P55–P57, p = 0.06).
Rapid conduction of action potentials along large-diameter axons depends on successful formation of compact myelin. Although myelin tracts appeared in appropriate regions and myelin protein expression was unaltered in O-NR1fl/fl mice, deficits in myelin compaction and myelin thickness at the level of individual nerve fibers could still have important functional consequences. To address whether myelin sheaths had normal structure when NMDAR signaling was disrupted, thin-section electron micrographs were prepared from O-NR1+/+ and O-NR1fl/fl mice. Examination of the developing corpus callosum (P24–P26) revealed unmyelinated axons, partially myelinated axons, and a subset of axons with multiple layers of compact myelin (Fig. 8C). In adult mice (P55–P57), the number of callosal axons ensheathed by compact myelin increased considerably; however, the density of myelinated fibers was similar in both genotypes (p = 0.59). Myelin thickness is closely matched to the caliber of the underlying axon, with larger axons possessing thicker myelin sheaths (Sherman and Brophy, 2005). This relationship can be appreciated in plots of g-ratio (diameter of axon/diameter of axon+myelin) versus axon caliber (Fig. 8D), and the characteristics of myelinated axons can be assessed by examining the slope and variability (R2) of linear fits to population data. The variability of myelin thickness was greater early in development (P24–P26 R2 vs P55–P57 R2, p = 0.04) (Fig. 8E), as expected as a result of ongoing myelination. However, there were no differences in variability or slope between O-NR1+/+ and O-NR1fl/fl mice at either age (P24–P26: slope, p = 0.67; R2, p = 0.67; P55–P58: slope, p = 0.86; R2, p = 1.0) (Fig. 8E,F), indicating that compact myelin was formed normally despite the prevention of NMDAR signaling within the OL lineage. Together, these results indicate that activation of OL lineage NMDARs is not critical for successful CNS myelination.
Synaptic connectivity with neurons is preserved in the absence of NMDARs
Neither OPC development nor OL myelination were substantially altered by inducible or constitutive ablation of NR1 from OL lineage cells, suggesting that NMDARs serve other functions within these glial cells. In neurons, NMDAR activation plays a critical role in modulating density of AMPARs found at synapses in both the developing and mature CNS (Malenka and Bear, 2004). Indeed, genetic ablation of NMDARs from subpopulations of neurons led to deficits in several forms of synaptic plasticity (Tsien et al., 1996; Engblom et al., 2008) and alterations in AMPAR-mediated synaptic responses (Adesnik et al., 2008; Engblom et al., 2008). OPCs in all brain regions form synapses with glutamatergic neurons, but little is known about the mechanisms regulating this form of neuron–glial communication.
To evaluate whether NMDAR activation plays a role in regulating neuron–OPC synaptic function, we measured the response of OPCs to focal application of hypertonic solution (HS) (500 mm sucrose in ACSF), a manipulation that forces release of docked, primed synaptic vesicles at nerve terminals, and provides a measure of synaptic maturation and connectivity (De Biase et al., 2010). Responses to HS were investigated in callosal OPCs from mature (P40–P45) mice, when synaptic connectivity has peaked and variability attributable to cell differentiation should be minimal (De Biase et al., 2010). In the presence of TTX (1 μm), CPP (20 μm), and gabazine (GABAR antagonist, 100 μm), HS elicited mEPSCs in all OPCs from both lines of control mice (Fig. 9A,B), consistent with previous results (O-NR1+/+, n = 11 cells; P-NR1+/+, n = 8 cells). HS similarly evoked mEPSCs in all OPCs from O-NR1fl/fl (n = 16 cells) and P-NR1fl/fl (n = 11 cells) mice (Fig. 9A,B), indicating that white matter neuron–OPC synapses are still formed in the absence of NMDARs. Synaptic connectivity was also preserved between neurons and OPCs in the CA1 region of hippocampus (3 of 3 OPCs in O-NR1+/+ mice and 5 of 5 OPCs O-NR1fl/fl showed HS-elicited mEPSCs) (data not shown). The degree of neuron–OPC synaptic connectivity was estimated by quantifying the number of mEPSCs observed during hypertonic challenge. Although there was a trend toward reduced synaptic connectivity in callosal OPCs lacking NMDARs (number of evoked mEPSCs: O-NR1fl/fl, 259 ± 68; P-NR1fl/fl, 249 ± 43; O-NR1+/+, 330 ± 34; P-NR1+/+, 324 ± 53) (Fig. 9C), this difference was not statistically significant (p = 0.22, Kruskal–Wallis ANOVA). These findings indicate that NMDAR expression by OPCs is not required to establish and maintain glutamatergic synapses with neurons. Furthermore, the amplitude of HS-evoked mEPSCs did not differ between OPCs from O-NR1+/+ and O-NR1fl/fl mice, indicating that postsynaptic AMPAR density was also preserved in the absence of OPC NMDARs (Fig. 9D).
Figure 9.

NMDAR-deficient OPCs form synapses with glutamatergic axons and have altered composition of surface AMPARs. A, Response of representative callosal OPCs to hypertonic solution in mature (P40–P45) O-NR1+/+ (top) and O-NR1fl/fl (bottom) mice. Duration of HS application indicated by the black bar. Regions indicated by the gray bars are shown at an expanded timescale to the right. B, Response of representative callosal OPCs to HS in mature (P40–P45) P-NR1+/+ (top) and P-NR1fl/fl (bottom) mice. Recordings were performed in mice at least 19 d after 4HT injection. HS application indicated by the black bar. Regions indicated by the gray bars are shown at expanded timescale to the right. C, Quantification of the number of HS-evoked mEPSCs in OPCs from control (O-NR1+/+, P-NR1+/+), constitutive (O-NR1fl/fl), and inducible (P-NR1fl/fl) NMDAR ablation mice. n for each group indicated at the base of each column. p = 0.22, Kruskal–Wallis ANOVA. D, Cumulative probability distribution of the amplitudes of HS-evoked mEPSCs recorded in callosal OPCs from O-NR1+/+ and O-NR1fl/fl mice. p = 0.16, Kolmogorov–Smirnov test. Inset shows average amplitude of HS-evoked mEPSCs recorded in callosal OPCs from O-NR1+/+ and O-NR1fl/fl mice. p = 0.055. E, Response of representative callosal OPCs from mature (P40–P50) O-NR1+/+ and O-NR1fl/fl mice to photolysis of caged glutamate (500 μm MNI–l-glutamate) at holding potentials of −80 and 40 mV. Currents were recorded in the presence of TTX (1 μm), CPP (20 μm), and 7-chlorokynurenic acid (100 μm) and spermine (100 μm) was included in the recording pipette. Inset shows response of a representative callosal OPC (P36 O-NR1+/+ mouse) to glutamate uncaging (black dot) before (black trace) and after the addition of AMPAR antagonists NBQX (50 μm) and GYKI 53655(100 μm) (gray trace) to the bath (n = 19 cells).
NMDAR deletion enhances the surface expression of calcium-permeable AMPARs
Although synaptic responses are intact in NMDAR-deficient OPCs, these approaches do not reveal whether there are changes in the overall abundance of AMPARs. To determine whether NMDARs influence global surface AMPAR expression in OPCs, glutamate uncaging was used to examine AMPAR-mediated currents in OPCs in the corpus callosum of mature mice (P40–P50). In the presence of TTX (1 μm) and antagonists for NMDARs (CPP, 20 μm; 7-chlorokynurenic acid, 100 μm), glutamate uncaging elicited inward currents in all recorded OPCs from both O-NR1+/+ and O-NR1fl/fl mice. These inward currents were blocked by the AMPAR antagonists NBQX (20 μm) and GYKI 53655 (100 μm, n = 19 cells) (Fig. 9E, inset). Although there was a trend toward larger AMPAR-mediated responses in OPCs from O-NR1fl/fl mice, neither the peak amplitude of AMPAR-mediated currents (O-NR1+/+, 310 ± 50 pA, n = 17; O-NR1fl/fl, 406 ± 81 pA, n = 14; p = 0.46) nor the density of surface AMPARs (O-NR1+/+, 11 ± 2 pA/pF, n = 17; O-NR1fl/fl, 15 ± 2 pA/pF, n = 14; p = 0.17) was significantly different from OPCs in O-NR1+/+ mice. Together, these data suggest that surface AMPARs were expressed at normal levels in the absence of NMDARs.
AMPARs are formed from different combinations of the subunits GluR1–GluR4, and those receptors that lack the edited GluR2 subunit are permeable to Ca2+ (Liu and Zukin, 2007). To determine whether AMPAR subunit composition in OPCs is influenced by NMDARs, we measured the current–voltage relationship of AMPAR-mediated currents in the presence of intracellular spermine (100 μm), a polyamine that reduces outward current flow through Ca2+- permeable AMPARs (cpAMPARs). Although the degree of inward rectification varied from cell to cell, OPCs from O-NR1fl/fl mice exhibited a greater rectification index (RI) (peak 80 mV/peak 40 mV) than OPCs from O-NR1+/+ mice (O-NR1fl/fl, RI = 2.51 ± 0.1, n = 14; O-NR1+/+, RI = 1.98 ± 0.1, n = 17; p = 0.001) (Fig. 9E), indicating that there was an ∼27% increase in surface cpAMPARs in NMDAR-deficient OPCs. These results suggest that NMDAR signaling provides negative feedback to control the density of cpAMPARs in this population of glial cells as has been suggested for neurons (Ho et al., 2007; Clem and Huganir, 2010; Wang and Gao, 2010).
Discussion
Glial cells throughout the mammalian CNS express neurotransmitter receptors that are thought to regulate glial development, control homeostatic behaviors such as functional hyperemia, and enable neuromodulation through the release of gliotransmitters (Belachew and Gallo, 2004; Perea et al., 2009; Attwell et al., 2010). However, it has been difficult to establish the roles of these receptors in vivo using pharmacological approaches, because glia and neurons often express the same receptors. Here, NMDAR signaling was prevented in OL lineage cells by genetically deleting the obligatory NMDAR subunit NR1 from OPCs. OPCs lacking NMDARs exhibited normal rates of proliferation, achieved normal densities in gray and white matter, and matured into OLs to form the major white matter tracts of the CNS without appreciable delay. Moreover, the characteristic physiological and morphological properties of OPCs were preserved in the absence of NMDARs, and they continued to receive glutamatergic synaptic input. However, NMDAR deletion led to alterations in the subunit composition of AMPARs in OPCs. These results suggest that NMDAR signaling is used to modulate signaling with surrounding axons rather than control OPC development, raising the possibility that these ubiquitous glial cells perform additional functions in neural circuits.
Is NMDAR activation required for the survival of CNS progenitors?
Global inhibition of NMDARs through administration of MK-801 during early postnatal development induces widespread cell death in the cortex and hippocampus (Ikonomidou et al., 1999) and reduces the survival of migrating neuroblasts within neurogenic niches in the mature CNS (Platel et al., 2010), suggesting that the survival of immature neurons is dependent on NMDAR activation. Although NR1 knock-out mice exhibit macroscopically normal CNS architecture at birth (Forrest et al., 1994), pronounced cell death is observed in the ventrobasal thalamus (Adams et al., 2004), in which neurons are actively forming synapses and undergoing programmed cell death. OPCs are distributed throughout the brain at birth (Nishiyama, 2007), and formation of neuron–OPC synapses parallels neuronal synaptogenesis in the forebrain (De Biase et al., 2010). Although programmed cell death has not been reported for OPCs, apoptotic Pre-OLs can be observed in the cortex between P7–P21 (Trapp et al., 1997), suggesting that NMDAR activation would most likely influence OPC survival during the second and third postnatal weeks. However, in P7 and P14 O-NR1fl/fl mice, the density of OL lineage cells in cortex and corpus callosum was normal (Fig. 5B,C), and no increases in OPC proliferation were observed (Fig. 6), which would be expected if OPC turnover was enhanced. When NMDARs were removed from OPCs shortly after birth (P4), the number of NMDAR-deficient (EGFP+) cells that survived until P30 also did not differ from control (Fig. 3B). Moreover, O-NR1fl/fl mice did not exhibit developmental delays in CNS myelination (Figs. 7, 8), which would be expected if there were fewer progenitors from which to form OLs. It is possible that NMDAR ablation could affect the long-term viability of OPCs or mature OLs in aged mice; however, 10-month-old O-NR1fl/fl mice did not exhibit behaviors indicative of myelination deficits, suggesting that NMDAR activation is not required for OL survival in the aging CNS.
Do these findings indicate that there are major differences in the survival requirements of immature neurons and glia? In chimeric mice containing NR1 null and wild-type cells, NR1−/− cells often account for 50–90% of the neurons and glia in the CNS (Maskos and McKay, 2003), indicating that neuroblasts lacking functional NMDARs are capable of widespread maturation and integration into CNS tissue. Furthermore, reduced cell viability was not reported when NMDARs were genetically ablated from neurons during embryonic or early postnatal periods (Iwasato et al., 2000; Engblom et al., 2008; Fukushima et al., 2009). Together, these data suggest that the dramatic apoptosis observed after pharmacological inhibition of NMDARs may be attributable to altered patterns of neural activity rather than a direct effect of NMDAR blockade on cell survival (Homayoun and Moghaddam, 2007). Whether such abnormal neural activity also leads to enhanced apoptosis of OPCs has not been determined.
NMDAR regulation of synaptic function and AMPAR trafficking
When NMDARs are removed from neurons during embryonic or early postnatal ages, excitatory synapses are still formed (Tsien et al., 1996; Adesnik et al., 2008; Engblom et al., 2008; Fukushima et al., 2009). However, in some cases, the amplitude of AMPAR currents and frequency of mEPSCs was enhanced (Adesnik et al., 2008; Engblom et al., 2008), indicating that NMDAR expression can influence both the number of synapses and the abundance of AMPARs at each synapse. Neuron–OPC synapses also formed in the absence of NMDARs, as indicated by the presence of spontaneous EPSCs (sEPSCs) and HS-evoked mEPSCs were detected in all recorded OPCs from both O-NR1fl/fl and P-NR1fl/fl mice. However, in NMDAR-deficient OPCs, the frequency of sEPSCs (data not shown) and the number and amplitude of HS-evoked mEPSCs (Fig. 9C,D) were comparable with controls, suggesting that NMDAR activation in these glial cells is not closely linked to synapse formation or AMPAR density at these sites. The preservation of neuron–OPC synapses is unlikely to reflect developmental compensation or the absence of competition between neighboring OPCs for presynaptic input, because similar results were obtained in P-NR1fl/fl mice, in which NR1 was removed postnatally from only a subset of OPCs.
An unusual aspect of neuron–OPC synapses is the high prevalence of cpAMPARs, which support activity-dependent synaptic potentiation (Ge et al., 2006), but may also render these cells sensitive to excitotoxicity during ischemia (Back, 2006). The contribution of these receptors to synaptic currents in OPCs varies with development and among brain regions (Bergles et al., 2010), suggesting that their expression and incorporation at synapses may be modified by activity or maturation state. Glutamate uncaging revealed that a greater proportion of AMPARs in NMDAR-deficient OPCs were Ca2+ permeable (Fig. 9E). Although most mature pyramidal neurons do not express cpAMPARs, their expression can be elicited by plasticity-inducing protocols, such as whisker stimulation, fear conditioning, and cocaine administration (Clem and Barth, 2006; Engblom et al., 2008; Clem and Huganir, 2010), and subsequent NMDAR activation has been linked to internalization of these newly incorporated cpAMPARs (Clem and Huganir, 2010). Furthermore, expression of cpAMPARs in some interneurons and early postnatal pyramidal neurons appears to be correlated with low levels of NMDAR expression (Ho et al., 2007; Wang and Gao, 2010), suggesting that NMDARs exert a negative influence on cpAMPAR expression in neurons. The increased cpAMPAR expression by NMDAR-deficient OPCs may reflect the absence of this negative regulation pathway. Alternatively, increased cpAMPAR expression by these glial cells might represent an attempt to compensate for a reduction in Ca2+ influx through NMDARs. However, it is unclear whether cpAMPARs could substitute for NMDARs, because these receptors typically couple to distinct intracellular signaling and scaffolding proteins (Kim and Sheng, 2004).
Physiological diversity among OPCs
The membrane properties of OPCs often vary between brain regions (Chittajallu et al., 2004; De Biase et al., 2010), suggesting that local environmental cues influence the particular complement and density of ion channels expressed by these progenitors. Characteristics such as membrane resistance and extent of synaptic communication can also vary over a wide range among OPCs within discrete brain regions (De Biase et al., 2010), and a subpopulation of OPCs that lack both NaV expression and synaptic input and are resistant to hypoxic–ischemic injury in vitro have been described (Káradóttir et al., 2008). In the present study, we found that 22–33% of OPCs in the corpus callosum of young adult mice (P-NR1+/+ and O-NR1+/+) did not exhibit NMDAR-mediated currents (Figs. 1C, 4E), consistent with previous results (Ziskin et al., 2007). Together, these findings raise the possibility that OPCs consist of separate populations of cells adapted for distinct physiological functions. However, these data should be interpreted with caution, because they involved analysis of animals during early postnatal development when OPCs are continually differentiating into oligodendrocytes (Kang et al., 2010). Previous physiological studies (De Biase et al., 2010; Kukley et al., 2010) and transcriptional profiling datasets (Cahoy et al., 2008) indicate that OPCs rapidly alter their membrane properties and downregulate glutamate receptor expression when they begin to differentiate. If the sequence of gene expression changes associated with differentiation is subject to stochastic variation, cells defined as OPCs based on membrane properties and marker expression (e.g., NG2) may also include some cells in the initial stages of differentiation. In this scenario, OPCs lacking NMDARs should be encountered more frequently in regions of highest OPC differentiation. Consistent with this hypothesis, NMDAR-mediated currents were not observed in the majority of OPCs in the corpus callosum during the first 2 postnatal weeks, when extensive oligodendrogenesis occurs, whereas, at the same developmental stage in gray matter regions, in which OPC differentiation is less prominent (Kang et al., 2010), nearly all OPCs exhibited NMDAR-mediated currents (L.M.D. and D.E.B., unpublished observations). An alternative, but not mutually exclusive, explanation for this developmental increase is that OPCs upregulate NMDARs in concert with the maturation of neural circuits. Additional methods to accurately establish the developmental state of OPCs will be required to determine which aspects of physiological diversity reflect heterogeneity among this population of progenitors and which reflect changes arising from differentiation.
The functions of glutamate receptor signaling in OPCs
Although these studies indicate that NMDARs are not required for survival or maturation of OPCs, glutamate signaling to OPCs could regulate OL development by acting through other glutamate receptors. OPCs also express AMPARs that provide a route for Ca2+ influx, and AMPAR activation inhibits OPC differentiation in vitro (Gallo et al., 1996). However, evaluation of the role of these receptors using genetic manipulations is more challenging, because functional AMPARs can be formed through numerous subunit combinations and no one obligate subunit is required. It is also possible that signaling through other neurotransmitters, such as ATP, may influence OPC survival and maturation, because adenosine receptor activation enhances OPC differentiation and myelination in vitro (Fields and Burnstock, 2006).
If NMDARs do not play a role in OPC development or myelination, then why are they expressed by OL lineage cells? In addition to a potential role in regulating surface expression of cpAMPARs, NMDARs could allow OPCs to sense fluctuations in ambient glutamate levels and respond to extrasynaptic release or spillover from nearby neuronal synapses (Carter and Regehr, 2000; Matsui et al., 2005), because NMDARs have a particularly high affinity for glutamate. NMDAR signaling in OL lineage cells is profoundly enhanced during oxygen/glucose deprivation in vitro (Káradóttir et al., 2005), raising the possibility that signaling through these receptors promotes the reactive changes exhibited by these cells after acute injury (Tan et al., 2005) and in neurodegenerative disease (Kang et al., 2010). Because OPCs are found associated with astrocytes and microglia in glial scars (Tan et al., 2005), NMDARs may facilitate detection of local injury and enable these abundant cells to promote tissue repair in a variety of pathological conditions.
Notes
Supplemental material for this article is available at http://bergleslab.com/Publications.htm. The content includes analysis of Cre expression within astrocytes and neurons in Olig1–Cre mice, analysis of physiological properties and synaptic connectivity of NMDAR-deficient OPCs in gray matter regions, and analysis of spontaneous synaptic activity in NMDAR-deficient OPCs. This material has not been peer reviewed.
Footnotes
This work was supported by National Institutes of Health Grants NS051509, PAR-02-059, and MH084020 (D.E.B), The Maryland Stem Cell Research Fund Postdoctoral Fellowship Grant 2010-MSCRFF-0061-00 (E.G.P.), and The Kenneth and Claudia Silverman Family Foundation (P.A.C.). We thank D. Rowitch (University of California, San Francisco, San Francisco, CA) for providing Olig1–Cre mice, W. B. Stallcup (Burnham Institute, San Diego, CA) for antibodies to NG2, R. Huganir (Johns Hopkins University, Baltimore, MD) for antibodies to GFP, B. Novitch (University of California, Los Angeles, Los Angeles, CA) for antibodies to Olig2, N. Ye for assistance with genotyping and mouse breeding, the IVAX Drug Research Institute for GYKI 53655, and A. Agarwal for advice regarding myelination assessments.
The authors declare no competing financial interests.
References
- Adams SM, de Rivero Vaccari JC, Corriveau RA. Pronounced cell death in the absence of NMDA receptors in the developing somatosensory thalamus. J Neurosci. 2004;24:9441–9450. doi: 10.1523/JNEUROSCI.3290-04.2004. [DOI] [PMC free article] [PubMed] [Google Scholar]
- Adesnik H, Li G, During MJ, Pleasure SJ, Nicoll RA. NMDA receptors inhibit synapse unsilencing during brain development. Proc Natl Acad Sci U S A. 2008;105:5597–5602. doi: 10.1073/pnas.0800946105. [DOI] [PMC free article] [PubMed] [Google Scholar]
- Attwell D, Buchan AM, Charpak S, Lauritzen M, Macvicar BA, Newman EA. Glial and neuronal control of brain blood flow. Nature. 2010;468:232–243. doi: 10.1038/nature09613. [DOI] [PMC free article] [PubMed] [Google Scholar]
- Back SA. Perinatal white matter injury: the changing spectrum of pathology and emerging insights into pathogenetic mechanisms. Ment Retard Dev Disabil Res Rev. 2006;12:129–140. doi: 10.1002/mrdd.20107. [DOI] [PubMed] [Google Scholar]
- Barres BA, Raff MC. Proliferation of oligodendrocyte precursor cells depends on electrical activity in axons. Nature. 1993;361:258–260. doi: 10.1038/361258a0. [DOI] [PubMed] [Google Scholar]
- Belachew S, Gallo V. Synaptic and extrasynaptic neurotransmitter receptors in glial precursors' quest for identity. Glia. 2004;48:185–196. doi: 10.1002/glia.20077. [DOI] [PubMed] [Google Scholar]
- Bergles DE, Jabs R, Steinhäuser C. Neuron-glia synapses in the brain. Brain Res Rev. 2010;63:130–137. doi: 10.1016/j.brainresrev.2009.12.003. [DOI] [PMC free article] [PubMed] [Google Scholar]
- Butt AM, Duncan A, Hornby MF, Kirvell SL, Hunter A, Levine JM, Berry M. Cells expressing the NG2 antigen contact nodes of Ranvier in adult CNS white matter. Glia. 1999;26:84–91. [PubMed] [Google Scholar]
- Cahoy JD, Emery B, Kaushal A, Foo LC, Zamanian JL, Christopherson KS, Xing Y, Lubischer JL, Krieg PA, Krupenko SA, Thompson WJ, Barres BA. A transcriptome database for astrocytes, neurons, and oligodendrocytes: a new resource for understanding brain development and function. J Neurosci. 2008;28:264–278. doi: 10.1523/JNEUROSCI.4178-07.2008. [DOI] [PMC free article] [PubMed] [Google Scholar]
- Carter AG, Regehr WG. Prolonged synaptic currents and glutamate spillover at the parallel fiber to stellate cell synapse. J Neurosci. 2000;20:4423–4434. doi: 10.1523/JNEUROSCI.20-12-04423.2000. [DOI] [PMC free article] [PubMed] [Google Scholar]
- Chang A, Nishiyama A, Peterson J, Prineas J, Trapp BD. NG2-positive oligodendrocyte progenitor cells in adult human brain and multiple sclerosis lesions. J Neurosci. 2000;20:6404–6412. doi: 10.1523/JNEUROSCI.20-17-06404.2000. [DOI] [PMC free article] [PubMed] [Google Scholar]
- Chittajallu R, Aguirre A, Gallo V. NG2-positive cells in the mouse white and grey matter display distinct physiological properties. J Physiol. 2004;561:109–122. doi: 10.1113/jphysiol.2004.074252. [DOI] [PMC free article] [PubMed] [Google Scholar]
- Clem RL, Barth A. Pathway-specific trafficking of native AMPARs by in vivo experience. Neuron. 2006;49:663–670. doi: 10.1016/j.neuron.2006.01.019. [DOI] [PubMed] [Google Scholar]
- Clem RL, Huganir RL. Calcium-permeable AMPA receptor dynamics mediate fear memory erasure. Science. 2010;330:1108–1112. doi: 10.1126/science.1195298. [DOI] [PMC free article] [PubMed] [Google Scholar]
- Dawson MR, Polito A, Levine JM, Reynolds R. NG2-expressing glial progenitor cells: an abundant and widespread population of cycling cells in the adult rat CNS. Mol Cell Neurosci. 2003;24:476–488. doi: 10.1016/s1044-7431(03)00210-0. [DOI] [PubMed] [Google Scholar]
- De Biase LM, Nishiyama A, Bergles DE. Excitability and synaptic communication within the oligodendrocyte lineage. J Neurosci. 2010;30:3600–3611. doi: 10.1523/JNEUROSCI.6000-09.2010. [DOI] [PMC free article] [PubMed] [Google Scholar]
- Engblom D, Bilbao A, Sanchis-Segura C, Dahan L, Perreau-Lenz S, Balland B, Parkitna JR, Luján R, Halbout B, Mameli M, Parlato R, Sprengel R, Lüscher C, Schütz G, Spanagel R. Glutamate receptors on dopamine neurons control the persistence of cocaine seeking. Neuron. 2008;59:497–508. doi: 10.1016/j.neuron.2008.07.010. [DOI] [PubMed] [Google Scholar]
- Fields RD, Burnstock G. Purinergic signalling in neuron-glia interactions. Nat Rev Neurosci. 2006;7:423–436. doi: 10.1038/nrn1928. [DOI] [PMC free article] [PubMed] [Google Scholar]
- Filley C. New York: Oxford UP; 2001. The behavioral neurology of white matter. [Google Scholar]
- Forrest D, Yuzaki M, Soares HD, Ng L, Luk DC, Sheng M, Stewart CL, Morgan JI, Connor JA, Curran T. Targeted disruption of NMDA receptor 1 gene abolishes NMDA response and results in neonatal death. Neuron. 1994;13:325–338. doi: 10.1016/0896-6273(94)90350-6. [DOI] [PubMed] [Google Scholar]
- Franklin RJ, ffrench-Constant C. Remyelination in the CNS: from biology to therapy. Nat Rev Neurosci. 2008;9:839–855. doi: 10.1038/nrn2480. [DOI] [PubMed] [Google Scholar]
- Fukushima F, Nakao K, Shinoe T, Fukaya M, Muramatsu S, Sakimura K, Kataoka H, Mori H, Watanabe M, Manabe T, Mishina M. Ablation of NMDA receptors enhances the excitability of hippocampal CA3 neurons. PLoS One. 2009;4:e3993. doi: 10.1371/journal.pone.0003993. [DOI] [PMC free article] [PubMed] [Google Scholar]
- Gallo V, Zhou JM, McBain CJ, Wright P, Knutson PL, Armstrong RC. Oligodendrocyte progenitor cell proliferation and lineage progression are regulated by glutamate receptor-mediated K+ channel block. J Neurosci. 1996;16:2659–2670. doi: 10.1523/JNEUROSCI.16-08-02659.1996. [DOI] [PMC free article] [PubMed] [Google Scholar]
- Ge WP, Yang XJ, Zhang Z, Wang HK, Shen W, Deng QD, Duan S. Long-term potentiation of neuron-glia synapses mediated by Ca2+-permeable AMPA receptors. Science. 2006;312:1533–1537. doi: 10.1126/science.1124669. [DOI] [PubMed] [Google Scholar]
- Gudz TI, Komuro H, Macklin WB. Glutamate stimulates oligodendrocyte progenitor migration mediated via an αv integrin/myelin proteolipid protein complex. J Neurosci. 2006;26:2458–2466. doi: 10.1523/JNEUROSCI.4054-05.2006. [DOI] [PMC free article] [PubMed] [Google Scholar]
- Ho MT, Pelkey KA, Topolnik L, Petralia RS, Takamiya K, Xia J, Huganir RL, Lacaille JC, McBain CJ. Developmental expression of Ca2+-permeable AMPA receptors underlies depolarization-induced long-term depression at mossy fiber CA3 pyramid synapses. J Neurosci. 2007;27:11651–11662. doi: 10.1523/JNEUROSCI.2671-07.2007. [DOI] [PMC free article] [PubMed] [Google Scholar]
- Homayoun H, Moghaddam B. NMDA receptor hypofunction produces opposite effects on prefrontal cortex interneurons and pyramidal neurons. J Neurosci. 2007;27:11496–11500. doi: 10.1523/JNEUROSCI.2213-07.2007. [DOI] [PMC free article] [PubMed] [Google Scholar]
- Hoyte L, Barber PA, Buchan AM, Hill MD. The rise and fall of NMDA antagonists for ischemic stroke. Curr Mol Med. 2004;4:131–136. doi: 10.2174/1566524043479248. [DOI] [PubMed] [Google Scholar]
- Ikonomidou C, Bosch F, Miksa M, Bittigau P, Vöckler J, Dikranian K, Tenkova TI, Stefovska V, Turski L, Olney JW. Blockade of NMDA receptors and apoptotic neurodegeneration in the developing brain. Science. 1999;283:70–74. doi: 10.1126/science.283.5398.70. [DOI] [PubMed] [Google Scholar]
- Iwasato T, Datwani A, Wolf AM, Nishiyama H, Taguchi Y, Tonegawa S, Knöpfel T, Erzurumlu RS, Itohara S. Cortex-restricted disruption of NMDAR1 impairs neuronal patterns in the barrel cortex. Nature. 2000;406:726–731. doi: 10.1038/35021059. [DOI] [PMC free article] [PubMed] [Google Scholar]
- Kang SH, Fukaya M, Yang JK, Rothstein JD, Bergles DE. NG2+ CNS glial progenitors remain committed to the oligodendrocyte lineage in postnatal life and following neurodegeneration. Neuron. 2010;68:668–681. doi: 10.1016/j.neuron.2010.09.009. [DOI] [PMC free article] [PubMed] [Google Scholar]
- Káradóttir R, Cavelier P, Bergersen LH, Attwell D. NMDA receptors are expressed in oligodendrocytes and activated in ischaemia. Nature. 2005;438:1162–1166. doi: 10.1038/nature04302. [DOI] [PMC free article] [PubMed] [Google Scholar]
- Káradóttir R, Hamilton NB, Bakiri Y, Attwell D. Spiking and nonspiking classes of oligodendrocyte precursor glia in CNS white matter. Nat Neurosci. 2008;11:450–456. doi: 10.1038/nn2060. [DOI] [PMC free article] [PubMed] [Google Scholar]
- Kessaris N, Fogarty M, Iannarelli P, Grist M, Wegner M, Richardson WD. Competing waves of oligodendrocytes in the forebrain and postnatal elimination of an embryonic lineage. Nat Neurosci. 2006;9:173–179. doi: 10.1038/nn1620. [DOI] [PMC free article] [PubMed] [Google Scholar]
- Kim E, Sheng M. PDZ domain proteins of synapses. Nat Rev Neurosci. 2004;5:771–781. doi: 10.1038/nrn1517. [DOI] [PubMed] [Google Scholar]
- Knutson P, Ghiani CA, Zhou JM, Gallo V, McBain CJ. K+ channel expression and cell proliferation are regulated by intracellular sodium and membrane depolarization in oligodendrocyte progenitor cells. J Neurosci. 1997;17:2669–2682. doi: 10.1523/JNEUROSCI.17-08-02669.1997. [DOI] [PMC free article] [PubMed] [Google Scholar]
- Komuro H, Rakic P. Modulation of neuronal migration by NMDA receptors. Science. 1993;260:95–97. doi: 10.1126/science.8096653. [DOI] [PubMed] [Google Scholar]
- Kukley M, Nishiyama A, Dietrich D. The fate of synaptic input to NG2 glial cells: neurons specifically downregulate transmitter release onto differentiating oligodendroglial cells. J Neurosci. 2010;30:8320–8331. doi: 10.1523/JNEUROSCI.0854-10.2010. [DOI] [PMC free article] [PubMed] [Google Scholar]
- Ligon KL, Fancy SP, Franklin RJ, Rowitch DH. Olig gene function in CNS development and disease. Glia. 2006;54:1–10. doi: 10.1002/glia.20273. [DOI] [PubMed] [Google Scholar]
- Liu SJ, Zukin RS. Ca2+-permeable AMPA receptors in synaptic plasticity and neuronal death. Trends Neurosci. 2007;30:126–134. doi: 10.1016/j.tins.2007.01.006. [DOI] [PubMed] [Google Scholar]
- Lu QR, Sun T, Zhu Z, Ma N, Garcia M, Stiles CD, Rowitch DH. Common developmental requirement for Olig function indicates a motor neuron/oligodendrocyte connection. Cell. 2002;109:75–86. doi: 10.1016/s0092-8674(02)00678-5. [DOI] [PubMed] [Google Scholar]
- Malenka RC, Bear MF. LTP and LTD: an embarrassment of riches. Neuron. 2004;44:5–21. doi: 10.1016/j.neuron.2004.09.012. [DOI] [PubMed] [Google Scholar]
- Maskos U, McKay RD. Neural cells without functional N-methyl-d-aspartate (NMDA) receptors contribute extensively to normal postnatal brain development in efficiently generated chimaeric NMDA R1 −/− 〈–〉 +/+ mice. Dev Biol. 2003;262:119–136. doi: 10.1016/s0012-1606(03)00354-3. [DOI] [PubMed] [Google Scholar]
- Matsui K, Jahr CE, Rubio ME. High-concentration rapid transients of glutamate mediate neural-glial communication via ectopic release. J Neurosci. 2005;25:7538–7547. doi: 10.1523/JNEUROSCI.1927-05.2005. [DOI] [PMC free article] [PubMed] [Google Scholar]
- Micu I, Jiang Q, Coderre E, Ridsdale A, Zhang L, Woulfe J, Yin X, Trapp BD, McRory JE, Rehak R, Zamponi GW, Wang W, Stys PK. NMDA receptors mediate calcium accumulation in myelin during chemical ischaemia. Nature. 2006;439:988–992. doi: 10.1038/nature04474. [DOI] [PubMed] [Google Scholar]
- Müller WE, Mutschler E, Riederer P. Noncompetitive NMDA receptor antagonists with fast open-channel blocking kinetics and strong voltage-dependency as potential therapeutic agents for Alzheimer's dementia. Pharmacopsychiatry. 1995;28:113–124. doi: 10.1055/s-2007-979603. [DOI] [PubMed] [Google Scholar]
- Nacher J, McEwen BS. The role of N-methyl-d-asparate receptors in neurogenesis. Hippocampus. 2006;16:267–270. doi: 10.1002/hipo.20160. [DOI] [PubMed] [Google Scholar]
- Nishiyama A. Polydendrocytes: NG2 cells with many roles in development and repair of the CNS. Neuroscientist. 2007;13:62–76. doi: 10.1177/1073858406295586. [DOI] [PubMed] [Google Scholar]
- Novak A, Guo C, Yang W, Nagy A, Lobe CG. Z/EG, a double reporter mouse line that expresses enhanced green fluorescent protein upon Cre-mediated excision. Genesis. 2000;28:147–155. [PubMed] [Google Scholar]
- Perea G, Navarrete M, Araque A. Tripartite synapses: astrocytes process and control synaptic information. Trends Neurosci. 2009;32:421–431. doi: 10.1016/j.tins.2009.05.001. [DOI] [PubMed] [Google Scholar]
- Platel JC, Dave KA, Gordon V, Lacar B, Rubio ME, Bordey A. NMDA receptors activated by subventricular zone astrocytic glutamate are critical for neuroblast survival prior to entering a synaptic network. Neuron. 2010;65:859–872. doi: 10.1016/j.neuron.2010.03.009. [DOI] [PMC free article] [PubMed] [Google Scholar]
- Ponimaskin E, Voyno-Yasenetskaya T, Richter DW, Schachner M, Dityatev A. Morphogenic signaling in neurons via neurotransmitter receptors and small GTPases. Mol Neurobiol. 2007;35:278–287. doi: 10.1007/s12035-007-0023-0. [DOI] [PubMed] [Google Scholar]
- Psachoulia K, Jamen F, Young KM, Richardson WD. Cell cycle dynamics of NG2 cells in the postnatal and ageing brain. Neuron Glia Biol. 2009;5:57–67. doi: 10.1017/S1740925X09990354. [DOI] [PMC free article] [PubMed] [Google Scholar]
- Rivers LE, Young KM, Rizzi M, Jamen F, Psachoulia K, Wade A, Kessaris N, Richardson WD. PDGFRA/NG2 glia generate myelinating oligodendrocytes and piriform projection neurons in adult mice. Nat Neurosci. 2008;11:1392–1401. doi: 10.1038/nn.2220. [DOI] [PMC free article] [PubMed] [Google Scholar]
- Samanta J, Burke GM, McGuire T, Pisarek AJ, Mukhopadhyay A, Mishina Y, Kessler JA. BMPR1a signaling determines numbers of oligodendrocytes and calbindin-expressing interneurons in the cortex. J Neurosci. 2007;27:7397–7407. doi: 10.1523/JNEUROSCI.1434-07.2007. [DOI] [PMC free article] [PubMed] [Google Scholar]
- Sherman DL, Brophy PJ. Mechanisms of axon ensheathment and myelin growth. Nat Rev Neurosci. 2005;6:683–690. doi: 10.1038/nrn1743. [DOI] [PubMed] [Google Scholar]
- Sontheimer H, Trotter J, Schachner M, Kettenmann H. Channel expression correlates with differentiation stage during the development of oligodendrocytes from their precursor cells in culture. Neuron. 1989;2:1135–1145. doi: 10.1016/0896-6273(89)90180-3. [DOI] [PubMed] [Google Scholar]
- Tan AM, Zhang W, Levine JM. NG2: a component of the glial scar that inhibits axon growth. J Anat. 2005;207:717–725. doi: 10.1111/j.1469-7580.2005.00452.x. [DOI] [PMC free article] [PubMed] [Google Scholar]
- Trapp BD, Nishiyama A, Cheng D, Macklin W. Differentiation and death of premyelinating oligodendrocytes in developing rodent brain. J Cell Biol. 1997;137:459–468. doi: 10.1083/jcb.137.2.459. [DOI] [PMC free article] [PubMed] [Google Scholar]
- Tripathi RB, Rivers LE, Young KM, Jamen F, Richardson WD. NG2 glia generate new oligodendrocytes but few astrocytes in a murine experimental autoimmune encephalomyelitis model of demyelinating disease. J Neurosci. 2010;30:16383–16390. doi: 10.1523/JNEUROSCI.3411-10.2010. [DOI] [PMC free article] [PubMed] [Google Scholar]
- Tsien JZ, Huerta PT, Tonegawa S. The essential role of hippocampal CA1 NMDA receptor-dependent synaptic plasticity in spatial memory. Cell. 1996;87:1327–1338. doi: 10.1016/s0092-8674(00)81827-9. [DOI] [PubMed] [Google Scholar]
- Wang HX, Gao WJ. Development of calcium-permeable AMPA receptors and their correlation with NMDA receptors in fast-spiking interneurons of rat prefrontal cortex. J Physiol. 2010;588:2823–2838. doi: 10.1113/jphysiol.2010.187591. [DOI] [PMC free article] [PubMed] [Google Scholar]
- Zarate C, Jr, Machado-Vieira R, Henter I, Ibrahim L, Diazgranados N, Salvadore G. Glutamatergic modulators: the future of treating mood disorders? Harv Rev Psychiatry. 2010;18:293–303. doi: 10.3109/10673229.2010.511059. [DOI] [PMC free article] [PubMed] [Google Scholar]
- Zhu X, Bergles DE, Nishiyama A. NG2 cells generate both oligodendrocytes and gray matter astrocytes. Development. 2008;135:145–157. doi: 10.1242/dev.004895. [DOI] [PubMed] [Google Scholar]
- Ziskin JL, Nishiyama A, Rubio M, Fukaya M, Bergles DE. Vesicular release of glutamate from unmyelinated axons in white matter. Nat Neurosci. 2007;10:321–330. doi: 10.1038/nn1854. [DOI] [PMC free article] [PubMed] [Google Scholar]