

Non-technical summary
Exercise capacity is limited at high altitude where hypoxia (i.e. decreased amount of inspired oxygen resulting in decreased oxygen in the blood) is present, but it is unknown whether a reduction in the oxygen delivered to the brain constitutes the signal to the brain to prematurely terminate exercise. We show that during hypoxic exercise equivalent to exercise at ∼4000 m above sea-level, the oxygen delivered to the brain during intense exercise is ∼60% less than that delivered to the brain at comparable exercise intensity at sea-level. These results show that reduction in the oxygen delivered to the brain could constitute the signal to limit maximal exercise capacity in hypoxia, and help us understand better why exercise capacity is limited at high altitude. Moreover, a plausible mechanism of exercise limitation in patients who present decreased oxygen in the blood during exercise due to pulmonary and/or cardiac disease is revealed.
Abstract
Abstract
During maximal hypoxic exercise, a reduction in cerebral oxygen delivery may constitute a signal to the central nervous system to terminate exercise. We investigated whether the rate of increase in frontal cerebral cortex oxygen delivery is limited in hypoxic compared to normoxic exercise. We assessed frontal cerebral cortex blood flow using near-infrared spectroscopy and the light-absorbing tracer indocyanine green dye, as well as frontal cortex oxygen saturation ( %) in 11 trained cyclists during graded incremental exercise to the limit of tolerance (maximal work rate, WRmax) in normoxia and acute hypoxia (inspired O2 fraction (
 ), 0.12). In normoxia, frontal cortex blood flow and oxygen delivery increased (P < 0.05) from baseline to sub-maximal exercise, reaching peak values at near-maximal exercise (80% WRmax: 287 ± 9 W; 81 ± 23% and 75 ± 22% increase relative to baseline, respectively), both leveling off thereafter up to WRmax (382 ± 10 W). Frontal cortex
  % did not change from baseline (66 ± 3%) throughout graded exercise. During hypoxic exercise, frontal cortex blood flow increased (P = 0.016) from baseline to sub-maximal exercise, peaking at 80% WRmax (213 ± 6 W; 60 ± 15% relative increase) before declining towards baseline at WRmax (289 ± 5 W). Despite this, frontal cortex oxygen delivery remained unchanged from baseline throughout graded exercise, being at WRmax lower than at comparable loads (287 ± 9 W) in normoxia (by 58 ± 12%; P = 0.01). Frontal cortex
  % fell from baseline (58 ± 2%) on light and moderate exercise in parallel with arterial oxygen saturation, but then remained unchanged to exhaustion (47 ± 1%). Thus, during maximal, but not light to moderate, exercise frontal cortex oxygen delivery is limited in hypoxia compared to normoxia. This limitation could potentially constitute the signal to limit maximal exercise capacity in hypoxia.
Introduction
Integrated cerebrovascular oxygen saturation, assessed by near-infrared spectroscopy (NIRS), is maintained or slightly increased during sub-maximal normoxic exercise, compared to rest (Ide et al. 1999; Nielsen et al. 2001, 2005; Koike et al. 2004; Imray et al. 2005; Subudhi et al. 2007). There is evidence that cerebrovascular oxygen saturation is marginally decreased at maximal normoxic exercise (Nielsen et al. 1999; Jensen et al. 2002; Gonzalez-Alonso et al. 2004; Subudhi et al. 2009) and that a greater degree in cerebral de-oxygenation precedes voluntary cessation of exercise in acute hypoxia (Subudhi et al. 2007). These findings have led to the suggestion that although it is unlikely that frontal cerebral cortex de-oxygenation limits exercise performance in normoxia, it may play a role in the decision to terminate exercise in hypoxia (Imray et al. 2005; Rasmussen et al. 2006; Subudhi et al. 2007, 2009).
Measurement of cerebrovascular oxygen saturation by NIRS yields oxygen saturation of all of the blood in the brain within the optode field of view, i.e. arterial, capillary and venous. The value recorded depends on the oxygen saturation of all vessels within the field of view in proportion to their relative volume, and as such it is highly dependent on arterial blood oxygen saturation (Schindler et al. 1995; Tobias, 2006). Accordingly, brain oxygen saturation assessed by NIRS in the frontal region of the forehead during intense exercise in hypoxia (Imray et al. 2005; Subudhi et al. 2007, 2009) reflects not only the balance between cerebral oxygen delivery and utilization, but also hypoxia- and exercise-induced arterial oxygen desaturation (Tobias, 2006). It remains largely unknown whether the rate of increase in frontal cerebral cortex oxygen delivery with increasing exercise intensity is limited in hypoxia compared to normoxia, thereby leading to a reduction in cerebral oxygenation (Imray et al. 2005; Rasmussen et al. 2007; Subudhi et al. 2007, 2009).
Assessment of frontal cerebral cortex oxygen delivery requires measurement of the frontal cerebral cortex blood flow as well as of arterial oxygen saturation. Direct blood flow measurements in the frontal region of the forehead during exercise can be made using an indicator-dilution method and NIRS technology based on the light-absorbing tracer indocyanine green dye (ICG) (Kuebler et al. 1998).
The aim of the present study was to measure frontal cerebral cortex blood flow, oxygen delivery and oxygenation indices during graded incremental exercise in order to investigate whether the rate of increase in frontal cerebral cortex oxygen availability is limited in hypoxia compared to normoxia. It was reasoned that if during exercise of progressively increasing intensity in hypoxia, the rate of increase in frontal cerebral cortex oxygen delivery was lower compared to that recorded at comparably intense loads in normoxia, this would reinforce the hypothesis that a reduction in frontal cerebral cortex oxygen availability may contribute to signalling the need to prematurely terminate exercise in hypoxia. To test our hypothesis we exercised healthy trained subjects at sub-maximal to maximal intensities under both hypoxic and normoxic conditions using a discontinuous incremental protocol that, by enabling exercise for at least 90 s at maximal intensities, allowed subjects to reach the limits of their capacity to exercise. Based on the findings of the study by Imray et al. (2005), measuring cerebral perfusion at four different levels of altitude hypoxia, we decided to use just one level of hypoxia ( : 0.12) equivalent to an altitude of ∼4350 m, where the greatest reductions in frontal cortex oxygen delivery and oxygenation were documented in that study.
Methods
Eleven competitive Greek male cyclists (Table 1) participated in the study, which was approved by the University Hospital Ethics Committee and was conducted in accordance with the guidelines of the Declaration of Helsinki. Prior to participation in the study, all subjects were informed of any risks and discomforts associated with the experiments and gave written, signed, informed consent.
Table 1.
Demographics and preliminary peak exercise data
| Age (years) | 38 ± 13 | |
| Height (m) | 1.8 ± 0.3 | |
| Weight (kg) | 71.5 ± 7.6 | |
| BMI (kg m−2) | 22.9 ± 1.7 | |
| Hypoxia | Normoxia | |
| WRmax (W) | 271 ± 17 | 362 ± 23 |
 (ml kg−1 min−1) (ml kg−1 min−1) |
44 ± 3 | 62 ± 7 |
| HRmax (beats min−1) | 186 ± 10 | 183 ± 17 |
Values are means ± SD for 11 subjects. Exercise data depict the results of the two preliminary incremental exercise tests during hypoxia and normoxia starting at 30 W and increasing by 30 W every minute, with the subjects maintaining a pedalling frequency of 70–90 rpm. WRmax, maximal work rate;  , maximal oxygen uptake; HRmax, maximal heart rate.
Experimental design
Experiments were conducted in three visits. In visits 1 and 2, each on different days, subjects underwent incremental exercise to the highest applied workload (maximal work rate, WRmax) whilst breathing room air or a hypoxic gas mixture ( : 0.12), one test per day (Table 1). In visit 3, subjects completed, in a balanced ordering sequence, two graded exercise tests, each one at a specific
  (0.21 and 0.12), separated by 120 min, at work rates of 20%, 40%, 60% and 80% WRmax for 5 min, and 100% WRmax to the limit of tolerance. In order to verify that subjects had accomplished maximal exercise effort, they were required to perform an additional bout (termed verification phase) (Midgley & Carroll, 2009) corresponding to an intensity greater (by 10%) than the one performed when the work rate was set at 100% WRmax. During the verification phase, subjects were encouraged to be engaged in an all-out effort for as long as they could tolerate it (typically up to 90 to 120 s) until the pedaling rate fell to 30 rpm that is indicative of the inability to keep cycling. Two minutes prior to initiating hypoxic exercise bouts, subjects were connected to the gas of low
  . Between exercise bouts at 20 to 80% WRmax, subjects recovered by cycling at 100 W for 10 min while breathing room air, whereas after completion of exercise bouts at 80 and 100% WRmax subjects rested for 20 min.
Preliminary testing
The incremental exercise tests were performed on an electromagnetically braked cycle ergometer (Ergoline 800; Sensor Medics, Anaheim, CA, USA) starting at 30 W and increasing by 30 W every minute, with the subjects maintaining a pedaling frequency of 70–90 rpm. Tests were preceded by a 3 min rest period, followed by 3 min of pedaling at 20–30 W to warm up. The following pulmonary gas exchange and ventilator variables were recorded (Vmax 229; Sensor Medics, Anaheim, CA, USA): oxygen uptake ( ), carbon dioxide elimination, minute ventilation, tidal volume, breathing frequency and respiratory exchange ratio. Flow was measured with a hot wire pneumotachograph (Vmax 229; Sensor Medics) near the mouthpiece, and tidal volume changes were obtained by integrating the flow signal. Heart rate was determined using the R-R interval from a 12-lead on-line electrocardiogram (Marquette Max; Marquette Hellige GmbH, Germany).
Subject preparation
Using local anaesthesia (2% lidocaine) and sterile technique, arterial (20 gauge) and venous (18 gauge) catheters were introduced percutaneously into the right radial artery and a right antecubital vein. Catheters were kept patent throughout the experiment by periodic flushing with heparinized (1 unit ml−1) saline.
Graded exercise tests
During these tests, recordings of pulmonary gas exchange and ventilatory variables were performed breath by breath. Cardiac output and blood flow measurements, arterial blood sampling and arterial blood pressure readings (by using a standard sphygmomanometer) were performed over the last minute of each exercise bout (Vogiatzis et al. 2008, 2009).
Cardiac output
Cardiac output was determined by the dilution method (Dow, 1956), using known volumes of ICG (1 ml at 5 mg ml−1) (Vogiatzis et al. 2008, 2009).
Frontal cerebral cortex blood flow by NIRS
In order to measure cerebral blood flow (CBF), one set of NIRS optodes was placed on the skin over the left frontal cortex region of the forehead, secured using double-sided adhesive tape. A special net headset was used to hold the NIRS probe firmly attached over the frontal cortex region. CBF measurements were made during the final minute of each exercise bout as previously described (Vogiatzis et al. 2008, 2009). The optode separation distance was 4 cm, corresponding to a penetration depth of ∼2 cm. Optodes were connected to a NIRO 200 spectrophotometer (Hamamatsu Photonics KK, Hamamatsu, Japan), which was used to measure ICG concentration as described elsewhere (van der Zee et al. 1992; Duncan et al. 1995; Boushel et al. 2000; Kalliokoski et al. 2006).
Frontal cortex cerebrovascular oxygenation by NIRS
Frontal cortex cerebrovascular oxygenation was assessed using a NIRO 200 spectrophotometer. To avoid any interference between ICG and Hb wavelengths, tissue oxygenation data were averaged over 10 s immediately prior to ICG injection. The variables assessed by NIRS were the concentration changes of oxygenated, deoxygenated and total haemoglobin (Hb). A derived parameter from NIRS studies in humans is the ratio of oxygenated Hb to total Hb, an index of changes in tissue O2 saturation ( ) relative to rest (Chance et al. 1992; DeLorey et al. 2003). Among these variables, several laboratories have adopted the deoxygenated Hb/myoglobin (deoxy-Hb) signal as the preferred indicator of changes in microvascular oxygenation during exercise (Grassi et al. 2003; DeLorey et al. 2004, 2005). The deoxy-Hb response to exercise is then considered a proxy of O2 extraction in the microcirculation, reflecting the balance between O2 delivery and utilization.
Blood analysis and calculations
Arterial tensions of O2 ( ) and CO2 (
 ), pH, Hb concentration, whole-body lactate concentration and percentage of arterial oxygen saturation (
 ) were measured from arterial blood samples by co-oximetry (ABL 625, Radiometer, Copenhagen, Denmark) within 10 s of collection. Arterial O2 content (
 ) was computed (
 = (1.34 × Hb ×
  ) + (0.003 ×
  )). The blood gas analyser was auto-calibrated every 4 h throughout the day and calibrating gases of known concentrations were run before each set of measurements. Blood gas measurements were corrected for subject's tympanic temperature taken during withdrawal of each arterial blood gas sample.
Statistical analysis
Data are reported as means ± SEM unless otherwise stated. The minimum sample size was calculated to be nine subjects based on 80% power, a two-sided 0.05 significance level, and known standard deviations (Imray et al. 2005; Subudhi et al. 2009). Two-way ANOVA with repeated measures was used to identify statistically significant differences across different fractions of respective incremental tests in normoxia and hypoxia. When ANOVA detected statistical significance, pair-wise differences were identified using a Tukey's honestly significant difference post hoc procedure. The level of significance for all analyses was set at P < 0.05.
Results
Exercise tolerance
In normoxia, mean endurance time at WRmax (348 ± 7 W) and the exercise bout of verification of WRmax (382 ± 10 W) were 116 ± 11 and 98 ± 7 s, respectively. In hypoxia, mean endurance time at WRmax (267 ± 5 W) and the exercise bout of verification of WRmax (289 ± 5 W) were 102 ± 6 and 88 ± 3 s, respectively.
Central haemodynamic responses
Whole body  , as well as systemic haemodynamic responses, are shown in Fig. 1. Analysis of variance across the work rate domain revealed that systemic oxygen delivery (
 ) and
) and  were, as expected, lower (P < 0.001), whilst cardiac output and systemic vascular conductance were higher (P < 0.001) in hypoxia compared to normoxia.
Figure 1. Central haemodynamic responses.
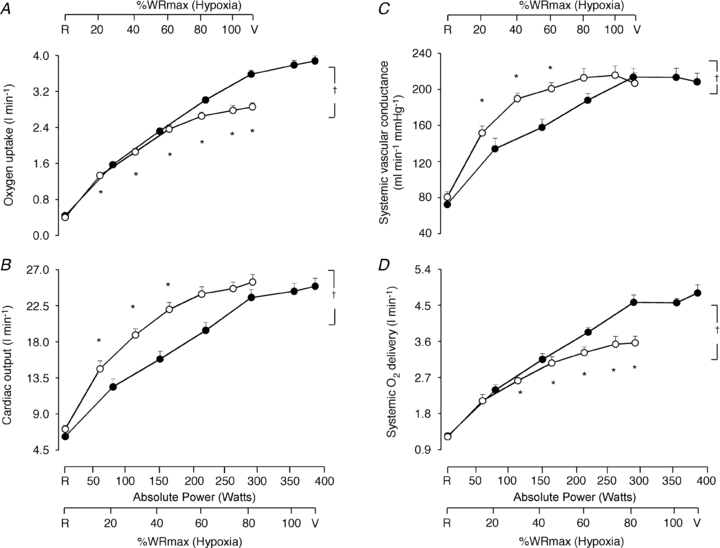
Oxygen uptake (A), cardiac output (B), systemic vascular conductance (C), and systemic oxygen delivery (D) as a function of the respective mean absolute work rate (power) during constant load exercise of graded intensity in hypoxia (open circles) and normoxia (filled circles), as well as relative to maximal work rate (WRmax) for each of the two conditions. Values are means ± SEM for 11 subjects. R is the baseline rest condition, and V is the exercise verification phase of WRmax. Crosses denote significant differences between the two conditions (P < 0.001), where variables are expressed relative to WRmax in both normoxia and hypoxia, whereas asterisks denote significant differences between hypoxia and normoxia at the same respective percentage of WRmax (P < 0.05).
Frontal cerebral cortex haemodynamic and oxygenation responses
In normoxia, frontal cortex blood flow and  increased (P < 0.05) from baseline to sub-maximal exercise, reaching peak values at near-maximal exercise (80% WRmax: 287 ± 9 W; 81 ± 23% and 75 ± 22% increase relative to baseline, respectively), both leveling off thereafter up to WRmax (Fig. 2A and C).
Figure 2. Frontal cerebral cortex haemodynamic responses.
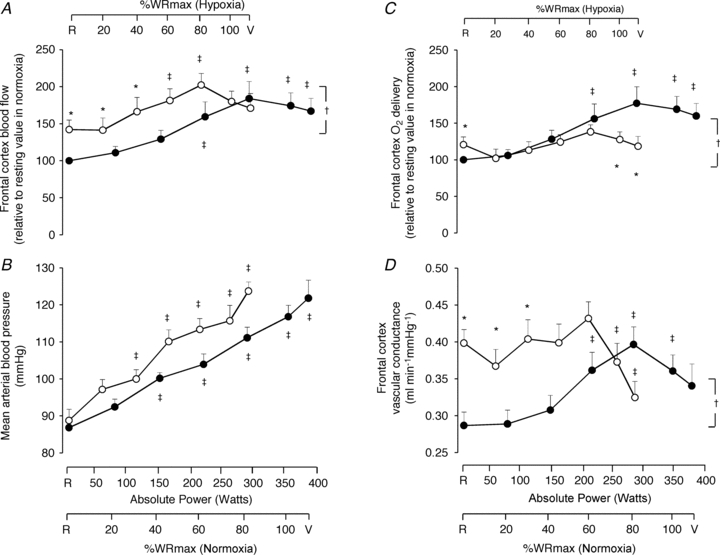
Frontal cerebral cortex blood flow (A), mean arterial pressure (B), frontal cerebral cortex oxygen delivery (C), and frontal cerebral cortex vascular conductance (D) as a function of the respective mean absolute work rate (power) during constant load exercise of graded intensity in hypoxia (open circles) and normoxia (filled circles), as well as relative to maximal work rate (WRmax) for each of the two conditions. Values are means ± SEM for 11 subjects. R is the baseline rest condition, and V is the exercise verification phase of WRmax. Frontal cerebral cortex blood flow and oxygen delivery are presented using normalized values, i.e. resting values in normoxia are taken as 100% and changes are expressed relative to this value. Crosses denote significant differences between the two conditions (P < 0.05), where variables are expressed relative to WRmax in both normoxia and hypoxia, asterisks denote significant differences between hypoxia and normoxia at the same respective percentage of WRmax (P < 0.05), whereas double crosses denote significant differences compared to baseline (P < 0.05).
During hypoxic exercise, frontal cortex blood flow increased (P = 0.016) from baseline to sub-maximal exercise, peaking at near-maximal exercise (80% WRmax: 213 ± 6 W; 60 ± 15% relative increase), before declining (P < 0.05) towards baseline at WRmax (289 ± 5 W) (Fig. 2A). In hypoxia compared to normoxia, frontal cerebral cortex blood flow was higher at baseline (by 42 ± 13%; P < 0.05) and remained higher (P < 0.05) at identical fractions of sub-maximal work rate (Fig. 2A). The difference between hypoxia and normoxia in frontal cortex blood flow was ∼10 ml min−1 100 g−1 at baseline and progressively decreased (P < 0.01) at increasing levels of graded exercise, becoming non-existent at WRmax (Fig. 3C). Frontal cortex  throughout graded hypoxic exercise remained unchanged from baseline, being lower (by 41 ± 9%; P < 0.05) than that during normoxic exercise at WRmax (Fig. 2C). Notably, frontal cortex
  at WRmax (289 ± 5 W) in hypoxia was lower (by 58 ± 12%; P = 0.01) than at comparable loads (287 ± 9 W) in normoxia (Fig. 2C). The difference between hypoxia and normoxia in frontal cortex
  was ∼1 ml O2 min−1 100 g−1 at baseline and progressively declined (P < 0.01) at increasing levels of exercise, reaching ∼−2 ml O2 min−1 100 g−1 at WRmax (Fig. 3D).
Figure 3. Frontal cortex cerebrovascular oxygenation and haemodynamic responses.
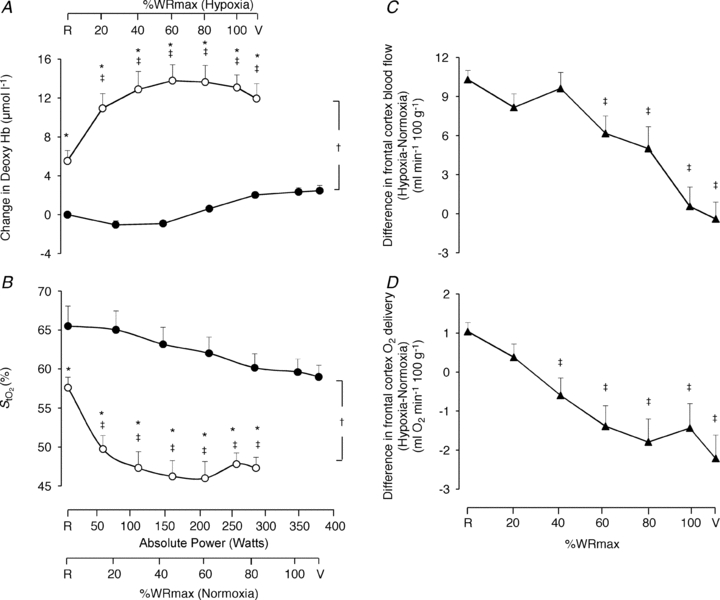
Frontal cortex cerebrovascular deoxy-haemoglobin concentration (A) and oxygen saturation ( ; B) as a function of the respective mean absolute work rate (power) during constant load exercise of graded intensity in hypoxia (open circles) and normoxia (filled circles), as well as relative to maximal work rate (WRmax) for each of the two conditions. Difference between hypoxia and normoxia in frontal cerebral cortex blood flow (C) and oxygen delivery (D) as a function of percentages of WRmax. Values are means ± SEM for 11 subjects. R is the baseline rest condition, and V is the exercise verification phase of WRmax. Crosses denote significant differences between the two conditions (P < 0.001), where variables are expressed relative to WRmax in both normoxia and hypoxia, asterisks denote significant differences between hypoxia and normoxia at the same respective percentage of WRmax (P < 0.05), whereas double crosses denote significant differences compared to baseline (P < 0.05).
Mean arterial blood pressure increased (P < 0.001) throughout graded exercise in both conditions (Fig. 2B). Frontal cortex vascular conductance (just like frontal cortex blood flow; Fig. 2A) was higher in hypoxia compared to normoxia both at baseline (P < 0.01) and throughout sub-maximal exercise (P < 0.05) (Fig. 2D). Whilst frontal cortex vascular conductance increased from baseline during normoxic exercise, peaking at 80% WRmax (P = 0.02), in hypoxia frontal cortex vascular conductance did not change from baseline during sub-maximal exercise but declined (P < 0.05) below baseline at WRmax (Fig. 2D).
Frontal cortex cerebrovascular deoxy-Hb was higher (P < 0.001) and  was lower (P < 0.001) both at rest and throughout hypoxic compared to normoxic graded exercise (Fig. 3A and B). During normoxic exercise, neither frontal cortex cerebrovascular deoxy-Hb nor
  changed from baseline through to exhaustion (Fig. 3A and B). In contrast, from rest to light exercise in hypoxia, there was an increase (P < 0.01) in frontal cortex cerebrovascular deoxy-Hb and a decrease in
  , which closely paralleled the changes in
  (Fig. 4A). However, thereafter, cerebrovascular oxygenation indices remained constant through exhaustion and exercise termination, as did
  .
.
Figure 4. Arterial blood analysis.
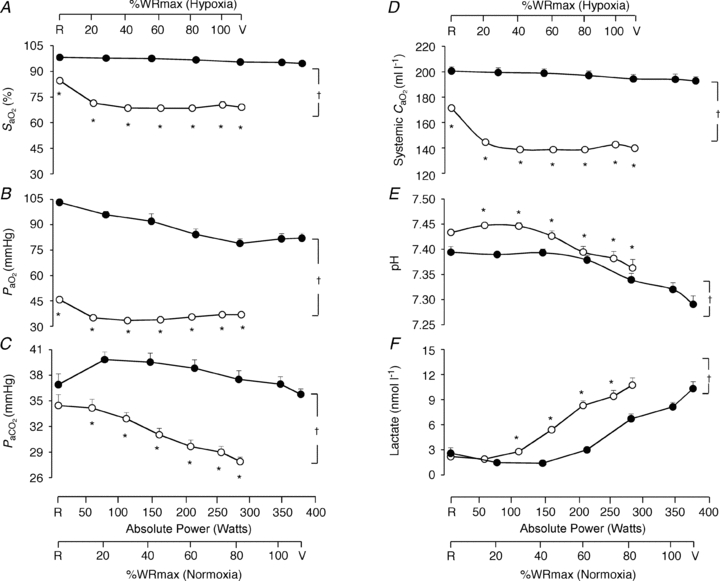
Arterial blood O2 saturation ( ; A), O2 partial pressure (
 ; B), CO2 partial pressure (
 ; C), systemic arterial oxygen content (
 ; D), pH (E) and lactate concentration (F) as a function of the respective mean absolute work rate (power) during constant load exercise of graded intensity in hypoxia (open circles) and normoxia (filled circles), as well as relative to maximal work rate (WRmax) for each of the two conditions. Values are means ± SEM for 11 subjects. R is the baseline rest condition, and V is the exercise verification phase of WRmax. Crosses denote significant differences between the two conditions (P < 0.01), where variables are expressed relative to WRmax in both normoxia and hypoxia, whereas asterisks denote significant differences between hypoxia and normoxia at the same respective percentage of WRmax (P < 0.05).
Arterial blood analysis
Variables measured from arterial blood samples are shown in Fig. 4. Throughout exercise protocols,  ,
,  ,
,  and systemic
  were lower (P < 0.01), whereas pH and lactate were higher (P < 0.01) in hypoxia compared to normoxia. Arterial Hb was not different between normoxia and hypoxia at the respective WRmax (15.6 ± 0.4 g dl−1 and 15.6 ± 0.4 g dl−1, respectively).
Discussion
During incremental exercise in hypoxia, frontal cerebral cortex oxygen saturation progressively decreases (Subudhi et al. 2007, 2009). This has led (Imray et al. 2005; Rasmussen et al. 2007) to the hypothesis that a reduction in oxygen availability to the brain may limit exercise performance in hypoxia. Our study tested this hypothesis by directly measuring frontal cerebral cortex blood flow and oxygen delivery. We expected that the rate of increase in frontal cerebral cortex oxygen delivery in hypoxia would be lower compared to that recorded at comparably intense loads of exercise in normoxia, and the results confirmed this expectation by demonstrating that during heavy exercise in hypoxia, the rate of increase in frontal cerebral cortex oxygen delivery was lower relative to that recorded at exercise loads of similar intensity in normoxia, whilst the difference in frontal cerebral cortex oxygen delivery was apparent at maximal tolerable exercise levels (Figs 2C and 3D). Frontal cortex oxygen delivery at WRmax (289 ± 5 W) in hypoxia was substantially lower than at comparable loads (287 ± 9 W, corresponding to 80% WRmax) in normoxia (by 58 ± 12%). The other notable finding was that frontal cortex O2 saturation was independent of exercise intensity from sub-maximal levels through to exhaustion in both normoxia and hypoxia, but was systematically lower in hypoxia than normoxia.
Considerations on the experimental design
The design in the present study was somewhat different from that employed by others (Nielsen et al. 1999, 2001, 2002; Imray et al. 2005; Rasmussen et al. 2007; Subudhi et al. 2007, 2008, 2009) as our incremental exercise protocol was discontinuous in nature. Accordingly, we did not look for sudden reductions in parameters associated with frontal cerebral cortex oxygen delivery or oxygenation immediately preceding cessation of exercise in hypoxia or normoxia, but rather we investigated whether frontal cerebral cortex blood flow, vascular conductance, oxygen delivery and oxygen saturation were different during constant-load graded exercise to the limit of tolerance in hypoxia compared to normoxia. Discontinuous workload bouts were required to allow sufficient time for frontal cerebral cortex blood flow to stabilize and for measurements to be accurately performed at each exercise level. This is because each measurement takes about 1 min and, after each measurement, it takes up to 2 min to clear all ICG from the optode field of view before the next measurement can be made.
Regulation of frontal cerebral cortex blood flow and oxygen delivery
An important finding of the present study, in both normoxia and hypoxia, is that frontal cortex blood flow increased from rest to near-maximal exercise (80% WRmax) but then plateaued (normoxia) or fell (hypoxia) thereafter, confirming some earlier reports on cerebral blood flow measured by middle cerebral artery mean flow velocity and the xenon clearance method (Thomas et al. 1989; Jørgensen et al. 1992a,b). Sub-maximally, blood flow was higher in hypoxia than normoxia (Figs 2A and 3C), compensating for the reduced arterial oxygen content (Fig. 4D). Increased baseline frontal cerebral cortex blood flow in hypoxia was most probably due to cerebral vasodilatation previously documented to occur during graded reduction in arterial oxygen saturation (Gupta et al. 1997).
In accordance with reports on middle cerebral artery mean blood flow velocity (Moraine et al. 1993; Ogoh et al. 2005a, 2007, 2008; Rasmussen et al. 2007, 2010) cerebral blood flow during sub-maximal exercise levels in hypoxia was progressively increased relative to resting levels (Fig. 2A) despite a greater degree of hypocapnia (Fig. 4C) that is expected to instigate cerebral vasoconstriction and subsequently cerebral hypoperfusion (Ainslie et al. 2007, 2008; Ainslie & Burgess, 2008). Therefore, our findings concur with those suggesting that during sub-maximal exercise, the vasodilator influence of hypoxia seems to override the hypocapnic-induced vasoconstriction (Ainslie & Poulin, 2004; Ainslie et al. 2007; Ainslie & Burgess, 2008) mainly owing to hypoxia-induced changes in cerebral autoregulation, sympathetic nerve activity and/or changes in cerebrovascular bed to hypoxia and hypocapnia (Ogoh et al. 2005b). Consequently, just like in the study by Rasmussen et al. (2010), at sub-maximal work rate frontal cerebral cortex blood flow was greater in hypoxia compared to normoxia (Figs 2A and 3C) since frontal cerebral cortex vascular conductance remained greater in hypoxia compared to normoxia during sub-maximal exercise (Fig. 2D). However, at maximal exercise in hypoxia, frontal cerebral cortex perfusion was decreased compared to near-maximal hypoxic exercise, reaching levels similar to those during maximal exercise in normoxia in the present and previous studies (Madsen et al. 1993). The reduction in frontal cerebral cortex blood flow and vascular conductance (by ∼20%) (Fig. 2A and D) at maximal compared to near-maximal hypoxic exercise could be due to the reduction in  (by ∼6 mmHg) from baseline caused by the exercise-induced hyperventilation, typically occurring during very heavy exercise sustained beyond the respiratory compensation threshold (Imray et al. 2005; Bhambhani et al. 2007). In fact, in the study by Imray et al. (2005), the magnitude of reduction in
  from baseline (by ∼6.5 mmHg) and in middle cerebral artery velocity (by ∼20%) from near-maximal to maximal exercise in severe hypoxia (
 : 75%) are comparable to those in the present study (Figs 2A, 4A and C).
Another important factor that may have contributed to maintaining greater frontal cerebral cortex blood flow during sub-maximal hypoxic exercise may be the greater increase in cardiac output (Fig. 1B). The greater increase in cardiac output during sub-maximal exercise in hypoxia was probably due to hypoxic sympathetic stimulation in an attempt to preserve systemic oxygen delivery (Knight et al. 1993; Calbet et al. 2003, 2007; Ogoh et al. 2005b, 2007, 2008; Ogoh and Ainslie, 2009). However, in light of the plateau in cardiac output and the concomitant decrease in frontal cortex vascular conductance during maximal compared to near-maximal exercise, frontal cortex blood flow was proven insufficient to offset the lower arterial oxygen content and, as such, frontal cortex oxygen delivery was lower in hypoxia compared to normoxia at comparable higher fractions of WRmax (Fig. 2C).
In contrast to the present study, where in normoxia frontal cortex blood flow increased from baseline to sub-maximal exercise, reaching peak values at near-maximal exercise (80% WRmax) and leveling off thereafter up to WRmax (Fig. 2A), recent investigations using middle cerebral artery mean blood flow velocity to assess cerebral blood flow (Sato & Sadamoto, 2010; Rasmussen et al. 2010; Sato et al. 2011) have shown that CBF increased from rest to sub-maximal exercise but returned to near resting levels at near-maximal or maximal exercise. The study by Sato et al. (2011) shed light on this discrepancy by demonstrating that although middle cerebral and internal carotid artery blood flow had the above-mentioned pattern during exercise, global CBF did not decrease at near-maximal or maximal exercise because vertebral artery blood flow, that represents the other source of blood flow to the brain, did not plateau and continued to increase from moderate to heavy exercise, thus compensating for the reduction in internal carotid artery blood flow at near-maximal or maximal exercise.
Regulation of frontal cortex cerebrovascular oxygenation
Frontal cerebral cortex oxygen delivery was reflected by the responses in NIRS oxygenation indices, namely deoxy-Hb and frontal cortex cerebrovascular  (Fig. 3A and B). Throughout normoxic exercise, both frontal cortex cerebrovascular
  and deoxy-Hb remained unchanged from baseline. Presumably, increasing frontal cerebral cortex oxygen delivery reflects progressively increasing frontal cerebral cortex oxygen metabolic demand (Secher et al. 2008). Accordingly, our findings support those of Sududhi et al. (2007) that in normoxia it is unlikely that changes in cerebral oxygenation limit performance. However, it has been recently shown that although cerebral oxygen delivery increased during sub-maximal and maximal exercise compared to rest in normoxia, this increase was insufficient to maintain the cerebral mitochondrial oxygen tension that decreased by ∼8 mmHg during maximal exercise as cerebral metabolic rate of oxygen substantially increased (Rasmussen et al. 2010).
During hypoxic exercise, frontal cortex cerebrovascular  decreased and deoxy-Hb increased relative to baseline from rest to light exercise, closely paralleling the fall in
  (Figs 3A and B, and 4A). However, from light exercise until exhaustion, oxygenation remained constant. As a result, frontal cortex cerebrovascular oxygenation during exercise was lower in hypoxia compared to normoxia across the entire exercise domain. Since cerebrovascular NIRS oxygenation indices are considered to reflect cerebral cell oxygenation status (Sududhi et al. 2007), the finding that in hypoxia our subjects were able to undertake any exercise may argue against cerebral deoxygenation signalling exercise termination at exhaustion. Moreover, the constancy of cerebral oxygenation seen during hypoxia from light exercise through to exhaustion may also argue against cerebral hypoxia signalling the need to terminate exercise, even when
  is reduced. Nevertheless, this finding could be due to the discontinuous protocol employed in the present study, and further research is required to demonstrate whether it would be reproduced during a continuous incremental exercise protocol.
In the present study, during heavy exercise frontal cerebral cortex oxygen delivery was limited in hypoxia compared to normoxia by ∼58% (Fig. 2C). Such a reduction in frontal cerebral cortex oxygen delivery could constitute the signal to limit exercise performance in hypoxia. In the study by Rasmussen et al. (2010), cerebral oxygen delivery during sub-maximal exercise in hypoxia was also limited compared to identical workload exercise in normoxia by ∼20%, resulting in a decrease in cerebral mitochondrial oxygen tension by ∼11 mmHg in hypoxia.
Study limitations
We have chosen to perform our measurements on the prefrontal cortex region of the forehead, because it has been shown (Subudhi et al. 2009) that in hypoxia, the magnitude of changes in cerebrovascular oxygenation indices is greater in prefrontal than in premotor and motor cortex regions. In addition, the pattern of blood flow responses to incremental exercise could be different among brain regions, as indicated by studies measuring blood flow in the internal carotid and vertebral arteries in humans (Sato & Sadamoto, 2010). Thus, the ‘true’ global brain response might not necessarily mirror the local responses investigated here in the left frontal region of the forehead.
While NIRS has been extensively used for non-invasive monitoring of cerebral perfusion and oxygenation in adults, the major limitation of this technique is that the applied light has to penetrate extracerebral tissue in the field of view (i.e. scalp and skull) to reach the brain. McCormick et al. (1992), by injecting ICG directly into the internal carotid artery, demonstrated convincingly that near-infrared light can penetrate through human scalp and skull into the brain, undergo attenuation in the cerebral vascular compartment, and manifest this attenuation as altered transmission intensity. This is in accordance with theoretical analyses and modelling paradigms predicting infrared light transmission through the living human scalp, skull and brain (Delpy et al. 1988), and there is no doubt that NIRS can detect changes in cerebral optical properties. However, at present, NIRS methods in adults strikingly underestimate CBF, and this seems to relate to the contribution of scalp and skull on the transmission of light through the cranial cavity and their scattering effect, even when the impact of extracerebral tissue is reduced by increasing the inter-optode distance (Owen-Reece et al. 1996a). Indeed, this underestimation is confirmed by a study which showed that, whereas mean cerebral blood flow was measured as 68 ml min−1 100 g−1 when the optodes were placed directly on the dura, the value was only 21 ml min−1 100 g−1 when measured transcranially in the same healthy humans (Owen-Reece et al. 1996a). This mean value of CBF when the optodes were positioned directly on the dura is in close agreement with that obtained at rest in healthy humans using other established methods, i.e. the Kety–Schmidt method (mean CBF 54 ml min−1 100 g−1) (Kety & Schmidt, 1948), the i.v. 133Xe washout technique (mean/median CBF 48–59 ml min−1 100 g−1) (Thomas et al. 1989; Obrist & Wilson, 1990; Jørgensen et al. 1992a,b) or positron emission tomography (PET) (mean CBF for grey matter 51 ml min−1 100 g−1) (Rostrup et al. 2002). Consequently, mean CBF at rest in normoxia in the present study (25 ml min−1 100 g−1) was considerably lower than that expected in healthy subjects. Likewise, during sub-maximal and near-maximal exercise in healthy humans, median value of CBF measured with the i.v. 133Xe washout technique was ∼80 ml min−1 100 g−1 (Thomas et al. 1989; Jørgensen et al. 1992a,b), whereas in the present study the mean value of CBF at the same level of exercise was only ∼40 ml min−1 100 g−1. Nevertheless, several studies have found good correlation of NIRS-derived changes of cerebral haemodynamics and oxygenation with functional magnetic resonance imaging (Keller et al. 2003; MacIntosh et al. 2003; Tak et al. 2011) or PET-derived results (Rostrup et al. 2002). From these observations, we may conclude that NIRS does reflect yet underestimate changes in CBF and oxygenation when these parameters remain unchanged in the extracerebral tissue between the NIRS optodes. For this reason, frontal cerebral cortex blood flow and oxygen delivery are reported using normalized values in our study, i.e. resting values in normoxia are taken as 100% and changes are expressed relative to this value (Fig. 2A and C). However, the question arises as to whether increased skin perfusion due to exercise-induced thermoregulatory vasodilatation contributed to the observed changes in cerebral perfusion and oxygenation of the present study. Extracerebral tissue has very little blood flow (around 5–8 ml min−1 100 g−1; Friberg et al. 1986), but Yamazaki & Sone (2006) measured skin perfusion during 30 min of exercise by the laser-Doppler technique and observed a substantial increase in skin blood flow when body core temperature increased above 38°C. However, exercise bouts in the present study were limited to a duration of ≤5 min which would increase core temperature by less than 0.5°C (Roberts et al. 1977; Roberts & Wenger, 1979) and cause only mild vasodilatation (Yamazaki & Sone, 2000, 2006). In addition, the thermoregulatory vascular network is arranged in a single thin layer within the skin, which comprises only a small fraction of the optical pathlength of near-infrared light between the optodes (24 cm at the inter-optode distance of 4 cm in the present study). It was demonstrated, using laser-Doppler velocimetry and occlusion of scalp blood flow using a pneumatic tourniquet, that scalp blood flow makes no contribution to NIRS measurements, providing the spacing between the scalp detectors is adequate (Owen-Reece et al. 1996b) (i.e. 4 cm, as in our study). Moreover, it has convincingly been shown that CBF, measured with the i.v. 133Xe washout technique that requires transcranial measurements, is not influenced by scalp cooling to a level where skin flow is substantially decreased, both at rest and during dynamic exercise (Thomas et al. 1989). The data of the present study also suggest that thermoregulatory skin perfusion had no major impact on our results. Indeed, if the observed increase in CBF (Fig. 2A) was due to increased skin perfusion, a simultaneous increase in oxygenation should be expected, because oxygen extraction in the skin decreases markedly during thermoregulatory vasodilatation. However,  tended to decrease and definitely did not increase (Fig. 3B). Therefore, we believe that increased thermoregulatory skin perfusion had no major impact on our results.
Conclusions
During heavy, but not light to moderate, exercise frontal cerebral cortex oxygen delivery was limited in hypoxia compared to normoxia as vascular conductance and blood flow declined. Such a reduction in frontal cerebral cortex oxygen delivery could potentially constitute the signal to limit maximal exercise capacity in hypoxia.
Acknowledgments
This work was supported by Thorax Foundation and by grants from the ‘A. Perotti’ visiting Professorship fund of the Thorax Foundation.
Glossary
Abbreviations

arterial O2 content
- CBF
cerebral blood flow
- deoxy-Hb
deoxygenated Hb/myoglobin

systemic oxygen delivery

inspired O2 fraction
- Hb
haemoglobin
- ICG
indocyanine green dye
- NIRS
near-infrared spectroscopy

arterial tension of O2

arterial tension of CO2
- PET
positron emission tomography

arterial oxygen saturation

tissue O2 saturation

oxygen uptake
- WRmax
maximal work rate
Author contributions
I.V., P.D.W. and S.Z., conception and design of the experiments; Z.L., H.H., D.A., V.A. and E.C., collection, analysis and interpretation of data; H.W., collection of data; C.R., interpretation of data; I.V., Z.L., H.H., P.D.W. and S.Z., drafting the article and revising it critically for important intellectual content. All authors approved the final version of the manuscript, and the work was performed at the Department of Critical Care Medicine and Pulmonary Services, Evangelismos Hospital, ‘M. Simou and G.P. Livanos Laboratories’, National and Kapodistrian University of Athens, Greece.
References
- Ainslie PN, Burgess KR. Cardiorespiratory and cerebrovascular responses to hyperoxic and hypoxic rebreathing: effects of acclimatization to high altitude. Respir Physiol Neurobiol. 2008;161:201–209. doi: 10.1016/j.resp.2008.02.003. [DOI] [PubMed] [Google Scholar]
- Ainslie PN, Burgess K, Subedi P, Burgess KR. Alterations in cerebral dynamics at high altitude following partial acclimatization in human: wakefulness and sleep. J Appl Physiol. 2007;102:658–664. doi: 10.1152/japplphysiol.00911.2006. [DOI] [PubMed] [Google Scholar]
- Ainslie PN, Hamlin M, Hellemans J, Rasmussen P, Ogoh S. Cerebral hypoperfusion during hypoxic exercise following two different hypoxic exposures: independence from changes in dynamic autoregulation and reactivity. Am J Physiol Regul Integr Comp Physiol. 2008;295:R1613–R1622. doi: 10.1152/ajpregu.90420.2008. [DOI] [PubMed] [Google Scholar]
- Ainslie PN, Poulin MJ. Respiratory, cerebrovascular and pressor responses to acute hypoxia: dependency on PET(CO2. Adv Exp Med Biol. 2004;551:243–249. doi: 10.1007/0-387-27023-x_37. [DOI] [PubMed] [Google Scholar]
- Bhambhani Y, Malik R, Mookerjee S. Cerebral oxygenation declines at exercise intensities above the respiratory compensation threshold. Respir Physiol Neurobiol. 2007;156:196–202. doi: 10.1016/j.resp.2006.08.009. [DOI] [PubMed] [Google Scholar]
- Boushel R, Langberg H, Olesen J, Nowak M, Simonsen L, Bulow J, Kjaer M. Regional blood flow during exercise in humans measured by near-infrared spectroscopy and indocyanine green. J Appl Physiol. 2000;89:1868–1878. doi: 10.1152/jappl.2000.89.5.1868. [DOI] [PubMed] [Google Scholar]
- Calbet JA, Boushel R, Radegran G, Sondergaard H, Wagner PD, Saltin B. Determinants of maximal oxygen uptake in severe acute hypoxia. Am J Physiol Regal Integr Comp Physiol. 2003;284:R291–R303. doi: 10.1152/ajpregu.00155.2002. [DOI] [PubMed] [Google Scholar]
- Calbet JA, Gonzalez-Alonso J, Helge JW, Sondergaard H, Munch-Andersen T, Boushel R, Saltin B. Cardiac output and leg and arm blood flow during incremental exercise to exhaustion on the cycle ergometer. J Appl Physiol. 2007;103:969–978. doi: 10.1152/japplphysiol.01281.2006. [DOI] [PubMed] [Google Scholar]
- Chance B, Dait MT, Zhang C, Hamaoka T, Hagerman F. Recovery from exercise-induced desaturation in the quadriceps muscles of elite competitive rowers. Am J Physiol Cell Physiol. 1992;262:C766–C775. doi: 10.1152/ajpcell.1992.262.3.C766. [DOI] [PubMed] [Google Scholar]
- DeLorey DS, Kowalchuk JM, Paterson DH. Relationship between pulmonary O2 uptake kinetics and muscle deoxygenation during moderate-intensity exercise. J Appl Physiol. 2003;95:113–120. doi: 10.1152/japplphysiol.00956.2002. [DOI] [PubMed] [Google Scholar]
- DeLorey DS, Kowalchuk JM, Paterson DH. Effects of prior heavy intensity exercise on pulmonary O2 uptake and muscle deoxygenation kinetics in young and older adult humans. J Appl Physiol. 2004;97:998–1005. doi: 10.1152/japplphysiol.01280.2003. [DOI] [PubMed] [Google Scholar]
- DeLorey DS, Kowalchuk JM, Paterson DH. Adaptation of pulmonary O2 uptake kinetics and muscle deoxygenation at the onset of heavy intensity exercise in young and older adults. J Appl Physiol. 2005;98:1697–1704. doi: 10.1152/japplphysiol.00607.2004. [DOI] [PubMed] [Google Scholar]
- Delpy DT, Cope M, van der ZP, Arridge S, Wray S, Wyatt J. Estimation of optical pathlength through tissue from direct time of flight measurement. Phys Med Biol. 1988;33:1433–1442. doi: 10.1088/0031-9155/33/12/008. [DOI] [PubMed] [Google Scholar]
- Dow P. Estimations of cardiac output and central blood volume by dye dilution. Physiol Rev. 1956;36:77–102. doi: 10.1152/physrev.1956.36.1.77. [DOI] [PubMed] [Google Scholar]
- Duncan A, Meek JH, Clemence M, Elwell CE, Tyszczuk L, Cope M, Delpy DT. Optical pathlength measurements on adult head calf and forearm and the head of the newborn infant using phase resolved optical spectroscopy. Phys Med Biol. 1995;40:295–304. doi: 10.1088/0031-9155/40/2/007. [DOI] [PubMed] [Google Scholar]
- Friberg L, Kastrup J, Hansen M, Bulow J. Cerebral effects of scalp cooling and extracerebral contribution to calculated blood flow values using the intravenous 133Xe technique. Scand J Clin Invest. 1986;46:375–379. doi: 10.3109/00365518609083685. [DOI] [PubMed] [Google Scholar]
- Gonzalez-Alonso J, Dalsgaard MK, Osada T, Volianitis S, Dawson EA, Yoshiga CC, Secher NH. Brain and central haemodynamics and oxygenation during maximal exercise in humans. J Physiol. 2004;557:331–342. doi: 10.1113/jphysiol.2004.060574. [DOI] [PMC free article] [PubMed] [Google Scholar]
- Grassi B, Pogliaghi S, Rampichini S, Quaresima V, Ferrari M, Marconi C, Cerretelli P. Muscle oxygenation and pulmonary gas exchange kinetics during cycling exercise on-transitions in humans. J Appl Physiol. 2003;95:149–158. doi: 10.1152/japplphysiol.00695.2002. [DOI] [PubMed] [Google Scholar]
- Gupta AK, Menon DK, Czosnyka M, Smielewski P, Jones JG. Thresholds for hypoxic cerebral vasodilation in volunteers. Anesth Analg. 1997;85:817–820. doi: 10.1097/00000539-199710000-00018. [DOI] [PubMed] [Google Scholar]
- Ide K, Horn A, Secher NH. Cerebral metabolic response to submaximal exercise. J Appl Physiol. 1999;87:1604–1608. doi: 10.1152/jappl.1999.87.5.1604. [DOI] [PubMed] [Google Scholar]
- Imray CH, Myers SD, Pattinson KT, Bradwell AR, Chan CW, Harris S, Collins P, Wright AD. Effect of exercise on cerebral perfusion in humans at high altitude. J Appl Physiol. 2005;99:699–706. doi: 10.1152/japplphysiol.00973.2004. [DOI] [PubMed] [Google Scholar]
- Jensen G, Nielsen HB, Ide K, Madsen PL, Svendsen UG, Secher NH. Cerebral oxygenation during exercise in patients with terminal lung disease. Chest. 2002;122:445–450. doi: 10.1378/chest.122.2.445. [DOI] [PubMed] [Google Scholar]
- Jørgensen LG, Perko M, Hanel B, Schroeder TV, Secher NH. Middle cerebral artery flow velocity and blood flow during exercise and muscle ischemia in humans. J Appl Physiol. 1992a;72:1123–1132. doi: 10.1152/jappl.1992.72.3.1123. [DOI] [PubMed] [Google Scholar]
- Jørgensen LG, Perko G, Secher NH. Regional cerebral artery mean flow velocity and blood flow during dynamic exercise in humans. J Appl Physiol. 1992b;73:1825–1830. doi: 10.1152/jappl.1992.73.5.1825. [DOI] [PubMed] [Google Scholar]
- Kalliokoski KK, Scheede-Bergdahl C, Kjaer M, Boushel R. Muscle perfusion and metabolic heterogeneity: insights from non-invasive imaging techniques. Exerc Sport Sci Rev. 2006;34:164–170. doi: 10.1249/01.jes.0000240018.07502.48. [DOI] [PubMed] [Google Scholar]
- Keller E, Nadler A, Alkadhi H, Kollias SS, Yonekawa Y, Niederer P. Noninvasive measurement of regional cerebral blood flow and regional cerebralblood volume by near-infrared spectroscopy and indocyanine green dye dilution. Neuroimage. 2003;20:828–839. doi: 10.1016/S1053-8119(03)00315-X. [DOI] [PubMed] [Google Scholar]
- Kety SS, Schmidt CF. The nitrous oxide method for the quantitative determination of cerebral blood flow in man: theory, procedure and normal values. J Clin Invest. 1948;27:476–483. doi: 10.1172/JCI101994. [DOI] [PMC free article] [PubMed] [Google Scholar]
- Knight DR, Schaffartzik W, Poole DC, Hogan MC, Bebout DE, Wagner PD. Effects of hyperoxia on maximal leg O2 supply and utilization in men. J Appl Physiol. 1993;75:2586–2594. doi: 10.1152/jappl.1993.75.6.2586. [DOI] [PubMed] [Google Scholar]
- Koike A, Itoh H, Oohara R, Hoshimoto M, Tajima A, Aizawa T. Cerebral oxygenation during exercise in cardiac patients. Chest. 2004;125:182–190. doi: 10.1378/chest.125.1.182. [DOI] [PubMed] [Google Scholar]
- Kuebler WM, Sckell A, Habler O, Kleen M, Kuhnle GEH, Welte M, Messner K, Goetz AE. Noninvasive measurement of regional cerebral blood flow by near–infrared spectroscopy and indocyanine green. J Cereb Blood Flow Metab. 1998;18:445–456. doi: 10.1097/00004647-199804000-00013. [DOI] [PubMed] [Google Scholar]
- McCormick PW, Stewart M, Lewis G, Dujovny M, Ausman JI. Intracerebral penetration of infrared light. Technical note. J Neurosurg. 1992;76:315–318. doi: 10.3171/jns.1992.76.2.0315. [DOI] [PubMed] [Google Scholar]
- MacIntosh BJ, Klassen LM, Menon RS. Transient hemodynamics during a breath hold challenge in a two part functional imaging study with simultaneous near-infrared spectroscopy in adult humans. Neuroimage. 2003;20:1246–1252. doi: 10.1016/S1053-8119(03)00417-8. [DOI] [PubMed] [Google Scholar]
- Madsen PL, Sperling BK, Warming T, Schmidt JF, Secher NH, Wildsciotz G, Holm S, Lassen NA. Middle cerebral artery blood velocity and cerebral blood flow and oxygen uptake during dynamic exercise. J Appl Physiol. 1993;74:245–250. doi: 10.1152/jappl.1993.74.1.245. [DOI] [PubMed] [Google Scholar]
- Midgley AW, Carroll S. Emergence of the verification phase procedure for confirming ‘true’ VO2max. Scand J Med Sci Sports. 2009;19:313–22. doi: 10.1111/j.1600-0838.2009.00898.x. [DOI] [PubMed] [Google Scholar]
- Moraine JJ, Lamotte M, Berre J, Niset G, Leduc A, Naeije R. Relationship of middle cerebral artery blood flow velocity to intensity during dynamic exercise in normal subjects. Eur J Appl Physiol Occup Physiol. 1993;67:35–38. doi: 10.1007/BF00377701. [DOI] [PubMed] [Google Scholar]
- Nielsen HB, Boushel R, Madsen P, Secher NH. Cerebral desaturation during exercise reversed by O2 supplementation. Am J Psysiol Heart Circ Psysiol. 1999;227:H1024–H1052. doi: 10.1152/ajpheart.1999.277.3.H1045. [DOI] [PubMed] [Google Scholar]
- Nielsen HB, Boesen M, Secher NH. Near-infared spectroscopy determined brain and muscle oxygenation during exercise with normal and resistive breathing. Acta Physiol Scand. 2001;171:63–70. doi: 10.1046/j.1365-201X.2001.00782.x. [DOI] [PubMed] [Google Scholar]
- Nielsen HB, Bredmose PP, Stromstad M, Volianitis S, Quistoff B, Secher NH. Bircarbonate attenuates arterial desaturation during maximal exercise in humans. J Appl Physiol. 2002;93:149–163. doi: 10.1152/japplphysiol.00398.2000. [DOI] [PubMed] [Google Scholar]
- Nielsen HB, Secher NH, Clemmesen O, Ott P. Maintained cerebral and skeletal muscle oxygenation during maximal exercise in patients with liver cirrhosis. J Hepatol. 2005;43:266–271. doi: 10.1016/j.jhep.2005.02.039. [DOI] [PubMed] [Google Scholar]
- Obrist WD, Wilson WE. Regional cerebral blood flow measurements in humans by 133Xe clearance. Cerebrovasc Brain Metab Rev. 1990;2:283–327. [PubMed] [Google Scholar]
- Ogoh S, Ainslie P. Cerebral blood flow during exercise: mechanisms of regulation. J Appl Physiol. 2009;107:1370–1380. doi: 10.1152/japplphysiol.00573.2009. [DOI] [PubMed] [Google Scholar]
- Ogoh S, Brothers RM, Barnes Q, Eubank WL, Hawkins MN, Purkayastha S, O-Yurvati A, Raven PB. The effect of changes in cardiac output on middle cerebral artery mean blood velocity at rest and during exercise. J Physiol. 2005a;569:697–704. doi: 10.1113/jphysiol.2005.095836. [DOI] [PMC free article] [PubMed] [Google Scholar]
- Ogoh S, Dalsgaard MK, Secher NH, Raven PB. Dynamic blood pressure control and middle cerebral artery mean blood velocity variability at rest and during exercise in humans. Acta Physiol (Oxf) 2007;191:3–14. doi: 10.1111/j.1748-1716.2007.01708.x. [DOI] [PubMed] [Google Scholar]
- Ogoh S, Dalsgaard MK, Yoshiga CC, Dawson EA, Keller DM, Raven PB, Secher NH. Dynamic cerebral autoregulation during exhaustive exercise in humans. Am J Physiol Heart Circ Physiol. 2005b;288:H1461–H1467. doi: 10.1152/ajpheart.00948.2004. [DOI] [PubMed] [Google Scholar]
- Ogoh S, Hayashi N, Inagaki M, Ainslie P, Miyamoto T. Interaction between the ventilatory and cerebrovascular responses to hypo- and hypercapnia at rest and during exercise. J Physiol. 2008;586:4327–4338. doi: 10.1113/jphysiol.2008.157073. [DOI] [PMC free article] [PubMed] [Google Scholar]
- Owen-Reece H, Elwell CE, Harkness W, Goldstone J, Delpy T, Wyatt JS, Smith M. Use of infrared spectroscopy to estimate cerebral blood flow in conscious and anaesthetized adult subjects. Br J Anaesth. 1996a;76:43–48. doi: 10.1093/bja/76.1.43. [DOI] [PubMed] [Google Scholar]
- Owen-Reece H, Elwell CE, Wyatt JS, Delpy T. The effect of scalp ischaemia on measurement of cerebral blood volume by near-infrared spectroscopy. Physiol Meas. 1996b;17:279–286. doi: 10.1088/0967-3334/17/4/005. [DOI] [PubMed] [Google Scholar]
- Poulin MJ, Syed RJ, Robbin PA. Assessment of flow by transcranial Doppler ultrasound in the middle artery during exercise in humans. J Appl Physiol. 1999;86:1632–1637. doi: 10.1152/jappl.1999.86.5.1632. [DOI] [PubMed] [Google Scholar]
- Rasmussen P, Dawson EA, Nybo L, Lieshout JJ, Secher NH, Gjedde A. Capillary-oxygenation-level-dependent near-infrared spectrometry in frontal lobe of humans. J Cereb Blood Flow Metab. 2007;27:1082–1093. doi: 10.1038/sj.jcbfm.9600416. [DOI] [PubMed] [Google Scholar]
- Rasmussen P, Nielsen J, Overgaard M, Krogh-Madsen R, Gjedde A, Secher NH, Petersen NC. Reduced muscle activation during exercise related to brain oxygenation and metabolism in humans. J Physiol. 2010;588:1985–1995. doi: 10.1113/jphysiol.2009.186767. [DOI] [PMC free article] [PubMed] [Google Scholar]
- Rasmussen P, Stie H, Nielsen B, Nybo L. Enchanced cerebral CO2 reactivity during strenuous exercise in man. Eur J Appl Physiol. 2006;96:299–304. doi: 10.1007/s00421-005-0079-3. [DOI] [PubMed] [Google Scholar]
- Roberts M, Wenger CB. Control of skin blood flow during exercise: thermal and nonthermal factors. J Appl Physiol. 1979;46:780–786. doi: 10.1152/jappl.1979.46.4.780. [DOI] [PubMed] [Google Scholar]
- Roberts M, Wenger BC, Stolwijk JAJ, Nadel ER. Skin blood flow and sweating changes following exercise training and heat acclimation. J Appl Physiol. 1977;43:133–137. doi: 10.1152/jappl.1977.43.1.133. [DOI] [PubMed] [Google Scholar]
- Rostrup E, Law I, Pott F, Ide K, Knudsen GM. Cerebral hemodynamics measured with simultaneous PET and near-infrared spectroscopy in humans. Brain Res. 2002;954:183–193. doi: 10.1016/s0006-8993(02)03246-8. [DOI] [PubMed] [Google Scholar]
- Sato K, Ogoh S, Hirasawa A, Oue A, Sadamoto T. The distribution of blood flow in the carotid and vertebral arteries during dynamic exercise in humans. J Physiol. 2011;589:2847–2856. doi: 10.1113/jphysiol.2010.204461. [DOI] [PMC free article] [PubMed] [Google Scholar]
- Sato K, Sadamoto T. Different blood flow responses to dynamic exercise between internal carotid and vertebral arteries in women. J Appl Physiol. 2010;109:864–869. doi: 10.1152/japplphysiol.01359.2009. [DOI] [PubMed] [Google Scholar]
- Schindler E, Zickmann B, Müller M, Boldt J, Kroll J, Hempelmann G. Cerebral oximetry by infrared spectroscopy in comparison with continuous measurement of oxygen saturation of the jugular vein bulb in interventions of the internal carotid artery (in German) Vasa. 1995;24:168–175. [PubMed] [Google Scholar]
- Secher NH, Seifert T, Van Lieshout JJ. Cerebral blood flow and metabolism during exercise: implications for fatigue. J Appl Physiol. 2008;104:306–314. doi: 10.1152/japplphysiol.00853.2007. [DOI] [PubMed] [Google Scholar]
- Subudhi AW, Dimmen AC, Roach RC. Effects of acute hypoxia on cerebral and muscle oxygenation during incremental exercise. J Appl Physiol. 2007;103:177–183. doi: 10.1152/japplphysiol.01460.2006. [DOI] [PubMed] [Google Scholar]
- Subudhi AW, Lorenz MC, Fulco CS, Roach RC. Cerebrovascular responses to incremental exercise during hypobaric hypoxia: effect of oxygenation on maximal performance. Am J Physiol Heart Circ Physiol. 2008;294:H164–H171. doi: 10.1152/ajpheart.01104.2007. [DOI] [PubMed] [Google Scholar]
- Subudhi AW, Miramon BR, Granger ME, Roach RC. Frontal and motor cortex oxygenation during maximal exercise in normoxia and hypoxia. J Appl Physiol. 2009;106:1153–1158. doi: 10.1152/japplphysiol.91475.2008. [DOI] [PMC free article] [PubMed] [Google Scholar]
- Tak S, Yoon SJ, Jang J, Yoo K, Jeong Y, Ye JC. Quantitative analysis of hemodynamic and metabolic changes in subcortical vascular dementia using simultaneous near-infrared spectroscopy and fMRI measurements. Neuroimage. 2011;55:176–184. doi: 10.1016/j.neuroimage.2010.11.046. [DOI] [PubMed] [Google Scholar]
- Thomas SN, Schroeder T, Secher NH, Mitchell JH. Cerebral blood flow during submaximal and maximal dynamic exercise in humans. J Appl Physiol. 1989;67:744–748. doi: 10.1152/jappl.1989.67.2.744. [DOI] [PubMed] [Google Scholar]
- Tobias JD. Cerebral oxygenation monitoring: near-infrared spectroscopy. Expert Rev Med Devices. 2006;3:235–243. doi: 10.1586/17434440.3.2.235. [DOI] [PubMed] [Google Scholar]
- van der Zee P, Cope M, Arridge SR, Essenpreis M, Potter LA, Edwards AD, Wyatt JS, McCormick DC, Roth SC, Reynolds EO, Delpy DT. Experimentally measured optical pathlengths for the adult head, calf and forearm and the head of the newborn infant as a function of inter optode spacing. Adv Exp Med Biol. 1992;316:143–153. doi: 10.1007/978-1-4615-3404-4_17. [DOI] [PubMed] [Google Scholar]
- Vogiatzis I, Athanasopoulos D, Boushel R, Guenette JA, Koskolou M, Vasilopoulou M, Wagner H, Roussos C, Wagner PD, Zakynthinos S. Contribution of respiratory muscle blood flow to exercise-induced diaphragmatic fatigue in trained cyclists. J Physiol. 2008;586:5575–5587. doi: 10.1113/jphysiol.2008.162768. [DOI] [PMC free article] [PubMed] [Google Scholar]
- Vogiatzis I, Athanasopoulos D, Habazettl H, Kuebler W, Wagner H, Roussos C, Wagner PD, Zakynthinos S. Intercostal muscle blood flow limitation during exercise in trained athletes. J Physiol. 2009;587:3665–3677. doi: 10.1113/jphysiol.2009.171694. [DOI] [PMC free article] [PubMed] [Google Scholar]
- Yamazaki F, Sone R. Modulation of arterial baroreflex control of heart rate by skin cooling and heating in humans. J Appl Physiol. 2000;88:393–400. doi: 10.1152/jappl.2000.88.2.393. [DOI] [PubMed] [Google Scholar]
- Yamazaki F, Sone R. Different vascular responses in glabrous and nonglabrous skin with increasing core temperature during exercise. Eur J Appl Physiol. 2006;97:582–590. doi: 10.1007/s00421-006-0219-4. [DOI] [PubMed] [Google Scholar]