Abstract
AIM: To investigate the anti-tumor function of ginsenoside Rg3 on hepatocellular carcinoma (HCC) in vitro and in vivo, and its mechanism.
METHODS: Hep1-6 and HepG2 cells were treated by Rg3 in different concentrations (0, 50, 100 and 200 μg/mL) in vitro. After incubation for 0, 6, 12, 24 and 48 h, cell viability was measured by 3-(4, 5-dimethylthiazol-2-yl)-2, 5-diphenyltetrazolium bromide assay. Apoptosis was identified by terminal deoxynucleotidyl transferase-mediated dUTP-biotin nick end labeling. Caspase-3 activity was measured by chromophore p-nitroanilide and flow cytometry. Bcl-2 family proteins were ascertained by Western-blotting. Mitochondria membrane potential was detected by 5, 5’, 6’ 6’ - tetrachloro-1, 1’, 3, 3’ - tetraethylbenzimidazolylcarbocyanine iodide. Forty liver tumor-bearing C57Bl6 mice were divided randomly into 4 groups for intra-tumor injection of saline, ginsenoside Rg3, cyclophosphamide (CTX) and ginsenoside Rg3 + CTX combination.
RESULTS: The survival time was followed up to 102 d. The mice in the Rg3 + CTX group showed significant increased survival time compared with those in the control group (P < 0.05). Rg3 could inhibit HCC cell proliferation and induce cell apoptosis in vitro in the concentration and time dependent manner. It also induced mitochondria membrane potential to decrease. Caspase-3 activation can be blocked by the inhibitor z-DEVD-FMK. Bax was up-regulated while Bcl-2 and Bcl-XL were down-regulated after Rg3 treatment.
CONCLUSION: Our data suggested that Rg3 alone or combined with CTX inhibited tumor growth in vivo and prolonged mouse survival time by inducing HCC cell apoptosis via intrinsic pathway by expression alterations of Bcl-2 family proteins.
Keywords: Ginsenoside Rg3, Apoptosis, Hepatocellular Carcinoma, Bcl-2 family proteins, Cyclophosphamide
INTRODUCTION
Hepatocellular carcinoma (HCC) is the fifth most common fatal human malignancy worldwide[1]. HCC is highly resistant to chemotherapeutic drugs and there is no single effective chemical against it. Two or three agents are often combined to enhance the efficacy of chemical agents. Chemotherapy causes serious toxic effects[2]. Thus, there is an urgent need to develop novel treatment modalities.
Ginseng is a traditional herbal medicine well known for its wide spectrum of pharmacological effects[3]. Recently researchers have found ginsenoside Rg3 can inhibit growth of several cancer cell lines[4-9]; however, the mechanism is not fully understood so far. In this study, two liver cancer cell lines, Hep1-6 and HepG2 cells were treated with ginsenoside Rg3 in vitro to explore the possible molecular mechanism. Ginsenoside Rg3 was also injected into tumor-bearing mice to investigate the anti-tumor effect in a long-term way.
MATERIALS AND METHODS
Ginsenoside Rg3
Ginsenoside Rg3 was purchased from Fusheng Pharmaceutical Ltd. Rg3 was dissolved in dimethyl sulfoxide (DMSO) and filtered by 0.2 μm membrane. It was diluted by cell culture media to various final concentrations (0, 50, 100, 200 μg/mL).
Cell lines and cell culture
Hep1-6 and HepG2 cells were purchased from the Institute of Biochemistry and Cell Biology, Academy of Science (Shanghai, China) and cultured in Dulbecco’s Modified Eagle’s Medium and Eagle’s Minimum Essential Medium (ATCC, Manassas, VA, United States) supplemented with 10% fetal bovine serum (FBS) (Atlanta Biologicals), 4 mmol/L 1-Glutamine (Cellgro) and 2% penicillin-streptomycin solution (Cellgro). The cells were incubated at 37 °C in a mixture of 5% CO2 and 95% air.
HCC animal model
Forty female C57BL/6 mice (4 wk, 16g ± 3 g, purchased from Shanghai Experimental Animal Center of the Chinese Academy, Shanghai, China) were divided randomly into 4 groups of 10 mice in each group: control (saline), ginsenoside Rg3, cyclophosphamide (CTX) and Rg3 + CTX combination. After being transplanted with 1 × 10⁶ Hep1-6 cells in 50 μL PBS on the flank, the mice were given an intra-tumor injection of ginsenoside Rg3 (3.0 mg/kg) and CTX (20.0 mg/kg) or Rg3 + CTX for 10 d following inoculation of Hep1-6 cells. The negative control was saline injection (1.5 mg/kg). Mice were euthanized according to IACUC proposals when the tumor was larger than 20 mm in diameter. The survival days were recorded. Mouse weight and tumor weight were measured.
After treatment, the survival study began. The animal technician, who was blind to the study, monitored the mouse weight and tumor size every day. When the diameter of tumor was larger than 2 cm on the tumor-bearing mouse, or the mouse weight loss was more than 20% on the tumor free mouse, the mouse was euthanized by cervical dislocation according to the animal experiment protocol and the date was determined as endpoint of survival dates.
Cell viability analysis
The viability of Hep1-6 and HepG2 cells treated with and without Rg3 was determined by the 3-(4, 5-dimethylthiazol-2-yl)-2, 5-diphenyltetrazolium bromide (MTT) assay. Briefly, cells in logarithmic growth phase were seeded in 96-well plates. Rg3 was added to the medium to different final concentrations: 0, 50, 100 and 200 μg/mL. After 0, 6, 12, 24 and 48 h incubation, 20 μL medium containing 5 mg/mL MTT was added to each well. After another 3 h incubation, DMSO (100 μL) was added to dissolve the formazan crystals. Light absorbance at 540 nm was measured. To determine the percentage of surviving cells, absorbance values of indicated concentrations were normalized to the values obtained from the cells without Rg3 treatment. Each assay was performed in 3 replicates.
Apoptosis detection
The HCC cells were incubated on the 8-well chamber slides (Nalge Nunc Corp, IL, United States) in medium with 0, 50, 100, 200 μg/mL Rg3. After 0, 6, 12, 24 and 48 h cell chambers were removed and the slides were fixed for hematoxylin and eosin (HE) stain and terminal deoxynucleotidyl transferase-mediated dUTP-biotin nick end labeling (TUNEL) fluorescent detection kit (Chemicon, United States). All the nuclei were stained blue by 2-(4-Amidinophenyl)-6-indolecarbamidine dihydrochloride (DAPI) while the apoptotic cells were stained as red fluorescent by apoptotic probe. The apoptotic cells were counted and statistically analyzed by the software Image J.
Caspase 3 activity assay
Caspase 3 activity was tested by colorimetric assay kit (Genscript, NJ, United States, Cat. No. L00289). The HCC cells were treated by Rg3 in different concentrations (0, 50, 100, 200 μg/mL) for 24 h. Then the cells were lysed for detection of the chromophore p- nitroanilide (pNA) after cleavage from the labeled substrate DEVD-pNA. The result was quantified as the A value at 405 nm. The relative increase of caspase-3 activity was determined by comparing the absorbance of pNA from Rg3 treated HCC cells to non-treated control.
Z-DEVD-FMK inhibitory assay
Cells were pretreated for 1 h with 20 mmol/L z-DEVD-FMK (R&D, Catalog Number: FMK004) prior to Rg3 treatment. The cells were then treated with Rg3 in different concentrations (0, 50, 100, 200 μg/mL) for 24 h. The cells were lysed for caspase activity measurement. Then z-DEVD-FMK was added to measure the caspase activity. The inhibitory rate was calculated by comparing caspase activity with/without z-DEVD-FMK.
Western blot analysis
After being treated with 0, 50, 100, 200 μg/mL Rg3 for 24 h, Hep1-6 and HepG2 cells were washed with ice-cold PBS twice and lysed on ice. Mitochondrial fraction and cytosolic fraction were extracted by Cytosol/Mitochondria Fractionation Kit (Calbiochem, United States). Extracted proteins were separated by 12% SDS-PAGE and transferred onto PVDF membrane. The membrane was incubated with primary antibodies: procaspase 8, cytochrome c, Bcl-2, Bax, Bad, Bcl-XL (Santa Cruz Biotechnology Inc. dilution: 1:200) and beta-actin (Cell Signaling Technology, dilution: 1:500) in blocking buffer for 1 h at room temperature followed by incubation with secondary antibodies conjugated with horseradish peroxidase (Santa Cruz Biotechnology Inc. dilution: 1:500). The protein expression was detected by X-ray film.
Measurement of transitions in mitochondrial transmembrane potential
Hep1-6 and Hep G2 cells were grown in 4-well cover glass chambers (Nalge Nunc) and treated with Rg3 100 μg/mL containing DMEM supplemented with 5% FBS. After incubation for 24 h, cells were stained with 5 μg/mL of 5, 5’, 6, 6’ - tetrachloro-1, 1’, 3, 3’ - tetraethylbenzimidazolylcarbocyanine iodide (JC-1), a widely used dye for measuring membrane potential of mitochondria. Cells were irradiated at an excitation wavelength of 488 nm, and the irradiated field was photographed using a confocal microscope equipped with an emission filter of 533 nm (100 magnification, Leica). Depolarized mitochondrial membranes were detected by the presence of a diffuse green fluorescence in cells.
Flow cytometry
After treatment with Rg3 100 μg/mL or saline for 24 h, 105 Hep1-6 and Hep G2 cells were suspended in 50 μL HBSS containing propidium iodide (PI) and fluorescein isothiocyanate (FITC) caspase-3 (Bioss LTD, Beijing, China) to identify apoptosis and necrosis, respectively. Fluorescent dyes were diluted to 1 μg/mL in HBSS containing 1% FBS. Incubations were carried out for 30 min on ice. After staining, the cells were washed twice in HBSS/1% FBS and then analyzed by a flow cytometry (LSR II, BD).
Tumor histopathology
When the tumor was as large as 20 mm in diameter, the animal was euthanized and the tumor was dissected and fixed in 40 g/L neutral formaldehyde. After 24 h it was embedded in paraffin, cut into 3 μm sections, stained with HE, and examined under light microscopy.
Statistical analysis
The present data are expressed as mean ± SD. For statistical comparison of values, a Student’s t test was used. P values less than 0.05 were deemed to indicate statistical significance. The Kaplan-Meier method is used to analyze the cumulative survival and draw the survival curve by software SPSS 11.0. Log rank statistic and significance were also presented by SPSS.
RESULTS
Rg3 represses liver cancer cell viability in a dose- and time-dependent way
MTT assay was done to examine if Rg3 could affect liver cancer cell growth in culture. Hep1-6 and HepG2 cells were treated with increasing concentrations of Rg3 (0, 50, 100, 200 μg/mL) for 24 h. The viable Hep1-6 and HepG2 cells consistently decreased with the higher concentrations of Rg3 as shown in Figure 1A. When Hep1-6 cells were treated by 100 and 200 μg/mL Rg3, the cell viability was significantly decreased (P < 0.005 vs control). HepG2 cells had significantly decreased viability when they were treated by 50, 100 and 200 μg/mL Rg3. When both cell lines were treated by 100 μg/mL Rg3 for 0, 6, 12, 24, 48 h, the cell viability declined significantly over 24 h (P < 0.005 vs control, Figure 1B).
Figure 1.
Ginsenoside Rg3 inhibits cell viability of human and murine liver cancer cells. A: Concentration-dependent inhibitory effects of Ginsenoside Rg3 on cell viability in Hep1-6 and HepG2 cell lines. Cells were treated with Rg3 at 0, 50, 100, 200 μg/mL in 10% fetal bovine serum-supplemented medium for 24 h; cell viability was determined by 3-(4, 5-dimethylthiazol-2-yl)-2, 5-diphenyltetrazolium bromide assay (n = 6 for Hep1-6, n = 6 for HepG2). B: Time-dependent inhibitory effects of Rg3 on cell viability in Hep1-6 and HepG2 cell lines. Cells were treated with Rg3 100 μg/mL for 0, 6, 12, 24, 48 h. One-way ANOVA was performed to test the concentration and time-dependent effects. aP < 0.05 vs untreated controls.
Rg3 induced liver cancer cells apoptosis in vitro
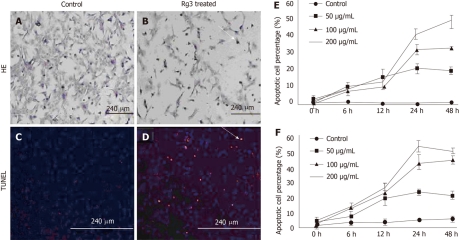
To determine if Rg3 causes apoptosis in Hep1-6 and HepG2 cells, DNA degradation and cleavage were detected in Rg3-treated liver cancer cells. When the HCC cells were treated with 100 μg/mL Rg3 for 24 h, both Hep1-6 and HepG2 cells displayed typical apoptotic morphology, including reduced volume and condensed chromatin (Figure 2A) compared to the control cells without Rg3 treatment (Figure 2B). To further specify apoptotic cell death, we stained nuclei with DAPI, a DNA-specific fluorescent dye. We also detected in situ DNA fragmentation in Hep1-6 and HepG2 cells by using TUNEL method. All the Hep1-6 cell nuclei were stained blue by DAPI while the apoptotic cells were stained red by apoptotic probe (Figure 2D). Hep1-6 cells treated by Rg3 showed a higher percentage of apoptotic cells (Figure 2D) compared to the control group (Figure 2C). The apoptotic Hep1-6 and HepG2 cells were counted and statistically analyzed by the software Image J. Rg3-induced apoptosis occurred in Hep1-6 and HepG2 cells when treated by 50-200 μg/mL Rg3 for 12-24 h (Figure 2E and F).
Figure 2.
Ginsenoside Rg3 caused hepatocellular carcinoma morphological changes of apoptotic cells. A, B: Cell apoptosis morphology was observed by hematoxylin and eosin (HE) stain. After 50 μg/mL Ginsenoside Rg3 (Rg3) incubation for 12 h, the Hep1-6 cells (B) indicate less survival cells compared to control group (A); C, D: DNA fragmentation in situ was detected by transferase-mediated dUTP-biotin nick end labeling. The control cells was stained blue (C) and the Rg3 treated group present apoptotic cells stained red (D); E, F: The apoptotic cells showed reduced volume and condensed chromatin. In both Hep1-6 and HepG2, the apoptotic induction effect is dose and time-dependent. Rg3: Ginsenoside Rg3; HE: Hematoxylin and eosin; TUNEL: Transferase-mediated dUTP-biotin nick end labeling.
Induction of apoptosis by Rg3 depends on mitochondria-medicated caspase cascade
To determine whether Rg3-induced apoptosis in Hep1-6 and HepG2 cells was mediated via caspase cascade, caspase-3 activity was measured by pNA. The relative increase of caspase-3 activity was determined by comparing the absorbance of pNA from Rg3 treated HCC cells to the non-treated control. In both Hep1-6 and HepG2, caspase-3 was activated by Rg3 treatment in a dose dependent manner (the means and SDs in Hep1-6 cells were 5% ± 1%, 22% ± 4%, 32% ± 3%, 43% ± 5% when Rg3 concentration were 0, 50, 100, 200 μg/mL, respectively; the HepG2 cells were 4% ± 0.5%, 32% ± 6%, 41% ± 7%, 54% ± 4%) (Figure 3). However, when both cell lines were pretreated with 20 mmol/L z-DEVD-FMK for 1 h, the caspase-3 activity was decreased significantly (4% ± 1%, 13% ± 3%, 11% ± 1%, 14% ± 4% when Rg3 concentration were 0, 50, 100, 200 μg/mL, respectively; the HepG2 cells were 4% ± 0.5%, 11% ± 1%, 11% ± 3%,10.5% ± 1%), suggesting Rg3 induce apoptosis via caspase-3 dependent apoptotic pathway in Hep1-6 and HepG2 cells. The caspase-3 activity is still elevated even in the presence of z-DEVD-FMK (Figure 3).
Figure 3.
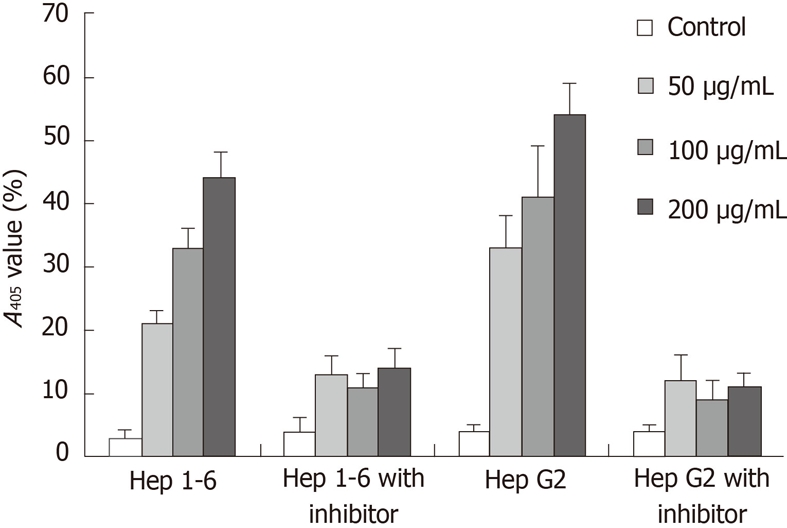
The caspase activity was measured by the chromophore p- nitroanilide. Hep1-6 and HepG2 cells were pretreated with or without 20 mm z-DEVD-FMK for 1 h, and then cultured with 0, 50, 100, 200 μg/mL ginsenoside Rg3 for 24 h. The caspase activity was measured by the chromophore p-nitroanilide (pNA) after cleavage from the labeled substrate DEVD-pNA by a plate reader A405 nm.
Because the activation of caspase-3 could be preceded by either caspase-8 via the death receptor pathway or caspase-9 via the mitochondria pathway, we tested pro-caspase-8 and cytochrome c to determine which pathway is dominant in Rg3-induced apoptosis. As illustrated in Figure 4, cleavage of caspase-8 was not evident, but cytochrome c decreased in the mitochondrial fraction and increased in the cytosolic fraction, which suggested that Rg3 mainly induced cytochrome c release.
Figure 4.
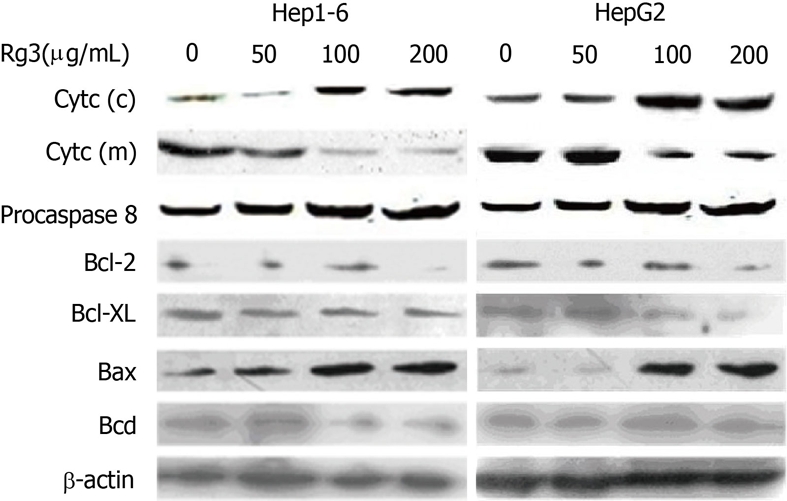
Effects of ginsenoside Rg3 on the cytochrome c release, caspase 8 cleavage and Bcl2-family. Hep1-6 and HegG2 cells were treated with 0, 50, 100, 200 μg/mL ginsenoside Rg3 (Rg3) for 24 h, and western-blot was used to detect the pro-casepase-8, cytochrome c in cytosolic fractions (c) and mitochondria fractions (m), Bcl-2, Bcl-XL, Bax, and Bad. β-actin is the protein loading control. Pro-caspase-8 remains static with or without Rg3 treatment. Cytochrome c decreased in the mitochondrial fraction and increased in the cytosolic fraction. Bcl-2 and Bcl-XL were down-regulated while Bax was up-regulated. Bad remains unchanged in the cells with and without Rg3 treatment. Rg3: Ginsenoside Rg3.
Rg3 altered apoptotic related gene expression
To further investigate the molecular mechanism of mitochondria pathway activation, Bcl-2 family protein expression in Hep1-6 and HegG2 cells was detected by western-blot after they were treated by Rg3 in different concentration (0, 50, 100, 200 μg/mL) for 24 h. As shown in Figure 4, Bcl-2 and Bcl-XL, the anti-apoptotic members of Bcl-2 family, were reduced by Rg3 treatment. Bax, the pro-apoptotic member, was increased. Bad was unchanged in the cells with and without Rg3 treatment.
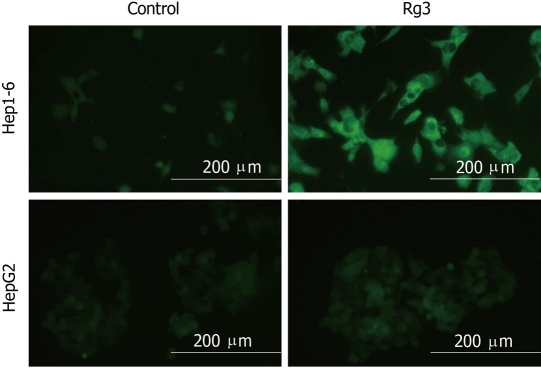
In order to determine whether the increase in mitochondrial Bax was associated with altered mitochondrial transmembrane potential, we measured changes in JC-1. JC-1 is a lipophilic cationic dye that can selectively enter into mitochondria and reversibly change color as illustrated in Figure 5; depolarized mitochondrial membranes were detected by the presence of a diffuse green fluorescence in cells. The green fluorescence shift indicates loss of mitochondrial function, which suggested that Rg3 activated the mitochondrial pathway by decreasing mitochondrial trans-membrane potential.
Figure 5.
Hep1-6 and HepG2 cells were treated with Rg3 100 μg/mL or saline for 24 h then cells were stained with 5, 5’, 6, 6’ - tetrachloro-1, 1’, 3, 3’ - tetraethylbenzimidazolylcarbocyanine iodide dye. Depolarized mitochondrial membranes were detected by the presence of a diffuse green fluorescence. Ginsenoside Rg3 treated groups had a significantly higher percentage of green fluorescent cells: Hep1-6 (87% ± 6% vs control 2% ± 1%) and HepG2 (46% ± 4% vs control 3% ± 2%). Rg3: Ginsenoside Rg3. aP < 0.05 vs control group.
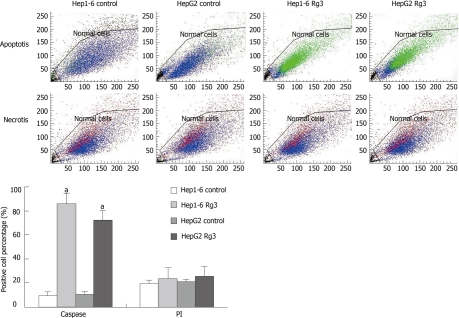
To further characterize the observed apoptotic phenotype, we carried out double staining of caspase-3-FITC and PI in two cell lines treated with saline and Rg3. Caspase-3-FITC can be detected in apoptosis. PI enters the cell in late apoptosis or necrosis. Viable cells were negative for both caspase-3-FITC and PI; early apoptotic cells were positive for caspase-3-FITC and negative for PI; late apoptotic or necrotic cells displayed both positive caspase-3-FITC and PI; non-viable cells which underwent necrosis were positive for PI and negative for caspase-3-FITC (Figure 6). After Rg3 treatment for 24 h, the percentage of early apoptotic cells induced by Rg3 in Hep1-6 and HepG2 were 85% ± 9%, 71% ± 8%, respectively. Their controls were 9% ± 3%, 11% ± 2%, respectively (Figure 6).
Figure 6.
Flow cytometry after caspase-3-fluorescein isothiocyanate/propidium Iodide staining. After being treated by ginsenoside Rg3 (Rg3) 100 μg/mL or saline for 24 h, Hep1-6 and HepG2 cells were stained by caspase-3-fluorescein isothiocyanate (FITC) and propidium Iodide (PI). Viable cells are shown as blue and early apoptotic cells are green (caspase-3-FITC). The non-viable necrotic cells are red (PI). Rg3 treated groups had a significantly higher percentage of caspase-3 positive cells: Hep1-6 (85% ± 9% vs 9% ± 3%) and HepG2 (71% ± 8% vs 11% ± 2%). There are no statistical difference in PI staining between Rg3 treated group and control group: Hep1-6 (23% ± 3% vs 19% ± 2%) and HepG2 (25% ± 4% vs 21% ± 3%). Rg3: Ginsenoside Rg3. aP < 0.05 vs control group.
Rg3 improved HCC tumor bearing animals’ survival time
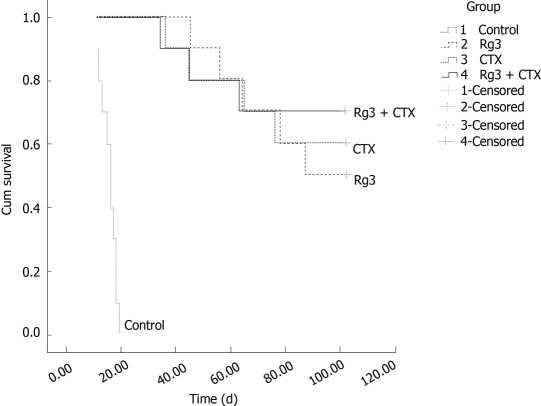
The survival study was carried out up to one hundred and two days after the last intra-tumor injection. The number of living mice in the ginsenoside Rg3 group, CTX group, combined treatment and saline control group are summarized in Figure 7. Mice in the control group were euthanized within 20 d when tumors were larger than 20 mm in diameter. The tumor of the mice in the Rg3 treated group reached 20 mm in diameter within 102 d. There were no significant abnormalities in mental state, activities, or response to stimulus. The survival time of mice in the ginsenoside Rg3 group, CTX group and combined treatment group was significantly longer than that in the control group (P < 0.001), which demonstrated that ginsenoside Rg3 inhibited the tumor growth and prolonged survival time of tumor-bearing mice.
Figure 7.
Survival time and survival rate of mice bearing hep1-6 tumor. The forty mice were divided into 4 groups with ten in each group, and inoculated with 1 × 10⁶ Hep1-6 cells in each mouse. The mice were given an intratumoral injection of ginsenoside Rg3 (Rg3) (3.0 mg/kg) and cyclophosphamide (CTX ) (20.0 mg/kg) or saline (1.5 mg/kg) for 10 d following inoculation of Hep1-6 cells. The animal survival study was followed up to 102 d, to observe and compare their survival time and survival rate. The Rg3 and CTX combination group, Rg3 group, and CTX group were statistically significant compared with the saline injected control group. Rg3: Ginsenoside Rg3; CTX: cyclophosphamide.
Tumor growth and pathology
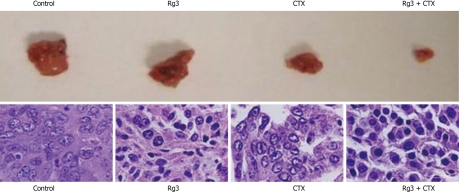
Tumors reached 20 mm in diameter on day 14 (± 6.3), day 87 (± 9), day 93 (± 11) and day 95 (± 7) in the control group, Rg3 group, CTX group and Rg3 + CTX group, respectively. The Rg3, CTX and Rg3 + CTX treatment resulted in a delayed tumor growth compared with the control group (P < 0.01). Tumors observed in the control group, Rg3, CTX and Rg3 + CTX treated groups were dissected and sent for HE stain. Dissected tumors are shown in Figure 8. Tumor weights at the time of sacrifice are present in Table 1. The inhibitory effects of Rg3 + CTX on tumor growth were comparable and significant vs control (P < 0.05).
Figure 8.
Tumor grosses dissection and histology. Tumors were dissected immediately after the mice were euthanized. Tumor blood vessels and their wall were abundant in the control group. The Ginsenoside Rg3 (Rg3) and cyclophosphamide (CTX) group showed smaller tumor size. The CTX group had the necrosis in the center. Rg3 + CTX had the smallest volume without necrosis. Samples were stained with hematoxylin and eosin in succession. In the control group, moderately differentiated hepatocellular carcinoma cells were surrounded by thick fibrous capsule. The nuclei were large. In the Rg3 treated group, tumor cells were irregular and condensed. In the CTX treated group, the tumor cells lost connective tissue or blood supply. In Rg3 + CTX group, there was obvious chromatin condensation in the hepatocyte. Rg3: Ginsenoside Rg3; CTX: Cyclophosphamide.
Table 1.
Comparison of body weight, tumor weight, and the ratio of tumor weight/body weight in the different groups
| Groups | Control | Rg3 alone | CTX | Rg3+CTX |
| Body weight (g) | 18.3 ± 1.8 | 19.1 ± 2.3 | 18.1 ± 1.6 | 21.9 ± 1.4 |
| Tumor weight (g) | 1.7 ± 0.5 | 0.9 ± 0.2a | 0.5 ± 0.3a | 0.3 ± 0.1a |
| Tumor weight/ body weight (%) | 0.09 ± 0.004 | 0.05 ± 0.003 | 0.03 ± 0.004 | 0.01 ± 0.002a |
Values were pressed by Mean ± SD,
P < 0.05 in Student’s t test vs the control group. Rg3: Ginsenoside Rg3; CTX: Cyclophosphamide.
Ultra structure and nuclear change were revealed by HE. The tumors in the mice of the control group showed aggressive growth and a regular nest shape with a rich blood supply. Tumor cells featured clear and regular nuclei with prominent nucleoli. The cytoplasm was characteristically pink and clear. In Rg 3 alone treated tumors, the nuclei dramatically shrink. CTX treated tumors lost the cord-like supporting structure on which tumor cells extend. In Rg3 + CTX treated tumors, individual cells elongated and condensed, nuclear to plasma ratio decreased with obvious chromatin condensation in the hepatocytes.
DISCUSSION
Ginseng, the root of panax ginseng, has been widely used in Asian medicine for more than 2000 years. Ginseng contains many active components such as ginsenosides, polysaccharides, peptides, fatty acids and mineral oils[2]. Among these components, ginsenosides were found most responsible for the pharmacological and immunological activities such as tonic, immunomodulatory, anti-mutagenic, adaptogenic, anti-aging activities, function and immune improvement[3]. Recently Rg3 has been suggested to inhibit cancer cell growth, invasion and metastasis, e.g. lung carcinoma[4], prostate cancer[5], colorectal cancer[6], ovarian cancer[7,8] and breast cancer[9]. Our present study in liver cancer cell lines demonstrated that ginsenoside Rg3 can also inhibit Hep1-6 and HepG2 growth. TUNEL and HE stain suggest Rg3 can induce apoptosis in a concentration and time dependent manner.
Understanding of the mechanism of Rg3-induced apoptosis will shed some light on the intracellular function of Rg3 in HCC cells. Caspases are a family of proteases regulating apoptosis[10,11] which includes upstream initiator caspases, such as caspase-8 and 10, and downstream executor caspases, such as caspase-3[12,13]. In our study, we examined the involvement of caspase-3 and found that Rg3 could activate caspase-3 in a concentration dependent way. Confirming caspase-3 is essential for Rg3-induced HCC cell apoptosis, HCC cells were pretreated by an irreversible pan-caspase inhibitor, z-DEVD-FMK, and then caspase-3 activation was blocked, suggesting Rg3-induced apoptosis is caspase-3 dependent.
There are two possible pathways that can lead to caspase-3 activation[14], either through caspase-8 via the death receptor pathway or caspase-9 via the mitochondria pathway[15,16]. Thus we tested pro-caspase-8 and cytochrome c to determine which pathway is dominant in Rg3-induced apoptosis. As illustrated in Figure 4, cleavage of caspase-8 was not evident, but cytochrome c decreased in the mitochondrial fraction and increased in the cytosolic fraction, which suggested that Rg3 induced cytochrome c release from the intermembrane space of mitochondria. Our results suggested that mitochondria probably acted as the main switch of Rg3-induced apoptosis in Hep1-6 and HepG2 cells.
The BCL-2 family regulates the apoptotic mitochondrial pathway[17,18] and can be divided into two types: anti-apoptotic proteins and pro-apoptotic proteins[19]. Many agents for cancer chemotherapy target the balance of pro- and anti-apoptotic proteins[20,21]. Bcl-2 and Bcl-XL are pro-survival proteins of the BCL-2 family, and BAX is an apoptotic protein. Our results showed that Rg3 down-regulated Bcl-2 and Bcl-XL, but up- regulated BAX. As an overall result, Rg3 altered the Bcl-2 family protein expression by shifting the balance towards cell death.
There are primarily two major events involved in apoptosis via the mitochondrial pathway. The first event is a change in mitochondrial membrane permeability, which leads to decreased mitochondrial membrane potential. Our data demonstrated Rg3 reduced mitochondrial membrane potential as indicated by JC-1 staining. The second event in the mitochondria-induced apoptotic pathway is the release of cytochrome c from the intermembrane space of the mitochondria into the cytosol[16]. As shown by western blot, Rg3 increased the release of cytochrome c in the cytosol.
In summary, we demonstrate that Rg3 induces HCC cell apoptosis via the mitochondrial pathway: (1) Rg3 induces HCC cell apoptosis by triggering Bax translocation to the mitochondria; (2) Rg3-treated HCC cells causes the release of cytochrome c into the cytosol from the mitochondria; and (3) over expression of Bcl-2 attenuated Rg3-induced apoptosis, while down-regulating Bcl-2 expression also enhances cell apoptosis.
Results on cell lines often represent a distorted and incomplete picture of the in situ physiopathology of cancer where the tumor microenvironment and neovascularization play a critical role in tumor growth and progression, thus we expanded our study to matched primary tumors using xenograft models. Hep1-6 cells were transplanted into mice. Animal survival time was prolonged by Rg3, CTX and Rg3 + CTX treatment. Tumor formation was delayed and its growth was significantly slowed down by Rg3, CTX and Rg3 + CTX treatment. Furthermore, Rg3 + CTX resulted in a significantly smaller ratio of tumor weight/ body weight. The combination of low-dose CTX and Rg3 suppresses growth of experimental tumors more effectively than CTX therapy or Rg3 alone. The possible reason for this is that the occurrence of side effects was also considerably lower. Therefore, the combination of ginsenoside Rg3 and CTX has a better effect on antitumor than ginsenoside Rg3 or CTX alone.
In conclusion, in this study, Rg3 treatment inhibited Hep1-6 and HepG2 growth by inducing apoptosis via the intrinsic apoptotic pathway. Ginsenoside Rg3 alone suppressed the growth of Hep1-6 tumor and combination with CTX was more effective than conventional CTX alone. Therefore, ginsenoside Rg3 is able to block the caspase-dependent signaling cascade and is valuable for developing new pharmaceutical means that will decrease the side effect of chemotherapy and increase the survival rate.
COMMENTS
Background
Liver tumor is the fifth most fatal human malignancy worldwide. It is highly resistant to chemotherapeutic drugs. Two or three agents are often combined to enhance the efficacy of chemical therapy. Chemotherapy causes serious toxic effects. Thus, there is an urgent need to develop novel treatment modalities. Ginseng is a traditional herbal medicine and its anti-tumor effect was recently discovered. This study investigates the anti-tumor effect of ginsenoside Rg3 on liver tumors and also explores its molecular mechanism.
Research frontiers
Ginseng is a popular herbal medicine in China and Korea. Thousands of years of clinical practice have proven its wide spectrum of pharmacological effects, but the herb extract was not quantitative and was hard to repeat. The mechanism was also unclear. This study selected Ginseng Rg3, a standard quantitative chemical by which the experiment could be repeated. This study focuses on apoptosis- the focus of tumor therapy, indicating the molecular mechanism of how Rg3 triggers the tumor cells to clear themselves from the normal cells.
Innovations and breakthroughs
This study found the antitumor effect of Ginseng Rg3 alone is not as effective as the combination of Rg3 and cyclophosphamide (CTX). Together, they could inhibit liver tumor cell proliferation, induce cell apoptosis and prolong mouse survival time. Its molecular mechanism is by inducing hepatocellular carcinoma cell apoptosis via the intrinsic pathway by alternating Bcl-2 family proteins and activating Caspase-3.
Applications
This study provides the experimental data for clinical application of Rg3 combined with CTX to treat liver tumor. The study screened the proper drug dosage and optimal functional time.
Terminology
Rg3 is a chemical compound isolated from the traditional Chinese herb ginseng. Apoptosis is also called programmed cell death or cell suicide. It is different from another form of cell death called necrosis, in which uncontrolled cell death leads to lysis of cells. Apoptosis is a process in which cells play an active role in their own deaths.
Peer review
The current paper falls within the scope of the journal, its research objectives are clearly stated, study design and methology are clearly described and the conclusions are based on the results.
Footnotes
Supported by The National Natural Science Foundation of China, No. 30700778; the Health Bureau Fund of Zhejiang Province, No. 2007QN006, No. 2008B080 and No. 2008A050; and National Basic Research Program (973) of China, No. 2007CB513005
Peer reviewers: Vezali Elena, MD, Department of Hepatology,“Hygeia” Diagnostic and Therpaeutic Center of Athens, Eruthrou Staurou 4, Marousi, 15123, Greece; Ji-Ping Wang, MD, PhD, Division of Surgical Oncology, Brigham and Women's Hospital, Harvard Medical School, 75 Francis Street, Boston, MA 02115, United States
S- Editor Sun H L- Editor Rutherford A E- Editor Xiong L
References
- 1.Stefaniuk P, Cianciara J, Wiercinska-Drapalo A. Present and future possibilities for early diagnosis of hepatocellular carcinoma. World J Gastroenterol. 2010;16:418–424. doi: 10.3748/wjg.v16.i4.418. [DOI] [PMC free article] [PubMed] [Google Scholar]
- 2.Kudo M. Review of 4th Single Topic Conference on HCC. Hepatocellular carcinoma: International consensus and controversies. Hepatol Res. 2007;37 Suppl 2:S83–S87. doi: 10.1111/j.1872-034X.2007.00167.x. [DOI] [PubMed] [Google Scholar]
- 3.Ma SW, Benzie IF, Chu TT, Fok BS, Tomlinson B, Critchley LA. Effect of Panax ginseng supplementation on biomarkers of glucose tolerance, antioxidant status and oxidative stress in type 2 diabetic subjects: results of a placebo-controlled human intervention trial. Diabetes Obes Metab. 2008;10:1125–1127. doi: 10.1111/j.1463-1326.2008.00858.x. [DOI] [PubMed] [Google Scholar]
- 4.Lu P, Su W, Miao ZH, Niu HR, Liu J, Hua QL. Effect and mechanism of ginsenoside Rg3 on postoperative life span of patients with non-small cell lung cancer. Chin J Integr Med. 2008;14:33–36. doi: 10.1007/s11655-007-9002-6. [DOI] [PubMed] [Google Scholar]
- 5.Kim HS, Lee EH, Ko SR, Choi KJ, Park JH, Im DS. Effects of ginsenosides Rg3 and Rh2 on the proliferation of prostate cancer cells. Arch Pharm Res. 2004;27:429–435. doi: 10.1007/BF02980085. [DOI] [PubMed] [Google Scholar]
- 6.Luo X, Wang CZ, Chen J, Song WX, Luo J, Tang N, He BC, Kang Q, Wang Y, Du W, et al. Characterization of gene expression regulated by American ginseng and ginsenoside Rg3 in human colorectal cancer cells. Int J Oncol. 2008;32:975–983. [PMC free article] [PubMed] [Google Scholar]
- 7.Xu TM, Cui MH, Xin Y, Gu LP, Jiang X, Su MM, Wang DD, Wang WJ. Inhibitory effect of ginsenoside Rg3 on ovarian cancer metastasis. Chin Med J (Engl) 2008;121:1394–1397. [PubMed] [Google Scholar]
- 8.Xu TM, Xin Y, Cui MH, Jiang X, Gu LP. Inhibitory effect of ginsenoside Rg3 combined with cyclophosphamide on growth and angiogenesis of ovarian cancer. Chin Med J (Engl) 2007;120:584–588. [PubMed] [Google Scholar]
- 9.Zhang Q, Kang X, Yang B, Wang J, Yang F. Antiangiogenic effect of capecitabine combined with ginsenoside Rg3 on breast cancer in mice. Cancer Biother Radiopharm. 2008;23:647–653. doi: 10.1089/cbr.2008.0532. [DOI] [PubMed] [Google Scholar]
- 10.Chen JH, Cao JL, Chu YL, Wang ZL, Yang ZT, Wang HL. T-2 toxin-induced apoptosis involving Fas, p53, Bcl-xL, Bcl-2, Bax and caspase-3 signaling pathways in human chondrocytes. J Zhejiang Univ Sci B. 2008;9:455–463. doi: 10.1631/jzus.B0820013. [DOI] [PMC free article] [PubMed] [Google Scholar]
- 11.Fan LL, Sun GP, Wei W, Wang ZG, Ge L, Fu WZ, Wang H. Melatonin and doxorubicin synergistically induce cell apoptosis in human hepatoma cell lines. World J Gastroenterol. 2010;16:1473–1481. doi: 10.3748/wjg.v16.i12.1473. [DOI] [PMC free article] [PubMed] [Google Scholar]
- 12.Chae IH, Park KW, Kim HS, Oh BH. Nitric oxide-induced apoptosis is mediated by Bax/Bcl-2 gene expression, transition of cytochrome c, and activation of caspase-3 in rat vascular smooth muscle cells. Clin Chim Acta. 2004;341:83–91. doi: 10.1016/j.cccn.2003.11.009. [DOI] [PubMed] [Google Scholar]
- 13.Li JY, Gu X, Zhang WH, Jia S, Zhou Y. GdCl3 abates hepatic ischemia-reperfusion injury by inhibiting apoptosis in rats. Hepatobiliary Pancreat Dis Int. 2009;8:518–523. [PubMed] [Google Scholar]
- 14.Chai WS, Zhu XM, Li SH, Fan JX, Chen BY. Role of Bcl-2 family members in caspase-3/9-dependent apoptosis during Pseudomonas aeruginosa infection in U937 cells. Apoptosis. 2008;13:833–843. doi: 10.1007/s10495-008-0197-6. [DOI] [PubMed] [Google Scholar]
- 15.Dey S, Mactutus CF, Booze RM, Snow DM. Cocaine exposure in vitro induces apoptosis in fetal locus coeruleus neurons by altering the Bax/Bcl-2 ratio and through caspase-3 apoptotic signaling. Neuroscience. 2007;144:509–521. doi: 10.1016/j.neuroscience.2006.09.04. [DOI] [PMC free article] [PubMed] [Google Scholar]
- 16.Ding SQ, Li Y, Zhou ZG, Wang C, Zhan L, Zhou B. Toll-like receptor 4-mediated apoptosis of pancreatic cells in cerulein-induced acute pancreatitis in mice. Hepatobiliary Pancreat Dis Int. 2010;9:645–650. [PubMed] [Google Scholar]
- 17.Fan XJ, Guo K, Xiao B, Zi XH, Song Z. [Effects of sodium aescinate on bcl-2 and caspase-3 expression and apoptosis after focal cerebral ischemia reperfusion injury in rats] Zhongnan Daxue Xuebao Yixue Ban. 2005;30:261–265, 275. [PubMed] [Google Scholar]
- 18.Xu YH, Zhao LJ, Li Y. Alisol B acetate induces apoptosis of SGC7901 cells via mitochondrial and phosphatidylinositol 3-kinases/Akt signaling pathways. World J Gastroenterol. 2009;15:2870–2877. doi: 10.3748/wjg.15.2870. [DOI] [PMC free article] [PubMed] [Google Scholar]
- 19.Han MH, Yoo YH, Choi YH. Sanguinarine-induced apoptosis in human leukemia U937 cells via Bcl-2 downregulation and caspase-3 activation. Chemotherapy. 2008;54:157–165. doi: 10.1159/000140359. [DOI] [PubMed] [Google Scholar]
- 20.Jin CY, Moon DO, Choi YH, Lee JD, Kim GY. Bcl-2 and caspase-3 are major regulators in Agaricus blazei-induced human leukemic U937 cell apoptosis through dephoshorylation of Akt. Biol Pharm Bull. 2007;30:1432–1437. doi: 10.1248/bpb.30.1432. [DOI] [PubMed] [Google Scholar]
- 21.Kim MH, Kim MO, Heo JS, Kim JS, Han HJ. Acetylcholine inhibits long-term hypoxia-induced apoptosis by suppressing the oxidative stress-mediated MAPKs activation as well as regulation of Bcl-2, c-IAPs, and caspase-3 in mouse embryonic stem cells. Apoptosis. 2008;13:295–304. doi: 10.1007/s10495-007-0160-y. [DOI] [PubMed] [Google Scholar]


