Abstract
A novel cation-exchange resin, Eshmuno™ S, was compared to Fractogel® SO3− (M) and Toyopearl GigaCap S-650M. The stationary phases have different base matrices and carry specific types of polymeric surface modifications. Three monoclonal antibodies (mAbs) were used as model proteins to characterize these chromatographic resins. Results from gradient elutions, stirred batch adsorptions and confocal laser scanning microscopic investigations were used to elucidate binding behavior of mAbs onto Eshmuno™ S and Fractogel® SO3− and the corresponding transport mechanisms on these two resins. The number of charges involved in mAb binding for Eshmuno™ S is lower than for Fractogel® SO3−, indicating a slightly weaker electrostatic interaction. Kinetics from batch uptake experiments are compared to kinetic data obtained from confocal laser scanning microscopy images. Both experimental approaches show an accelerated protein adsorption for the novel stationary phase. The influence of pH, salt concentrations and residence times on dynamic binding capacities was determined. A higher dynamic binding capacity for Eshmuno™ S over a wider range of pH values and residence times was found compared to Fractogel® SO3− and Toyopearl GigaCap S-650M. The capture of antibodies from cell culture supernatant, as well as post-protein A eluates, were analyzed with respect to their host cell protein (hcp) removal capabilities. Comparable or even better hcp clearance was observed at much higher protein loading for Eshmuno™ S than Fractogel® SO3− or Toyopearl GigaCap S-650M.
Key words: ion-exchange chromatography, dynamic binding capacity, tentacle surface modification, linear gradient elution, hcp removal
Introduction
Recently concerns regarding potential bottlenecks in the downstream processing of monoclonal antibodies (mAbs) on an industrial scale have been heatedly discussed. Current antibody purification platforms seem to be capable of processing large fermentation volumes. However, the first adsorptive column, rather than clarification operations such as filtration and centrifugation, has been identified as the true bottleneck in antibody manufacturing.1,2 Increasing cell culture mAb titers are proving to be problematic for downstream purification processes because the relatively low binding capacities of protein A resins for capture limit overall throughput.
Although production costs have gone down due to improvements in fermentation, the relative proportion of cost of goods correlated to downstream purification is increasing sharply; downstream processing might comprise up to 80% of the entire production costs. Due to continuous pressure on manufacturing costs, more and more resources are now being dedicated to process optimization. In particular, the first downstream operation step affects the overall throughput and economics. Both cross-flow microfiltration and centrifugation unit operations are routinely employed to remove the solid components of the fermentation process. The objective of the subsequent step, the capture step, is to recover as much product as possible and provide a product pool that is suitable for subsequent chromatographic column steps, i.e., with volumes small enough to be handled quickly and sample compositions that do not interfere with the next chromatographic mode.
The first chromatographic step is usually performed on a Protein A affinity column. The dynamic binding capacity of Protein A resins is usually ≤40 g/L and depends strongly on residence time. The binding capacity of the used resin together with the column size dictates the number of cycles that must be run to process the entire cell culture supernatant.3,4 Affinity chromatography on Protein A is widely accepted and is a part of platform purification strategies because it can be implemented in almost all antibody production schemes.5 However, the high price (US $9,000–12,000 per liter) for the corresponding stationary phases contributes significantly to the manufacturing costs.
Currently, discussions about improvements in large scale mAb purification quite often revolve on the re-design of the capture step. Alternative techniques for capture, such as precipitation, liquid/liquid partitioning and crystallization, are also under investigation so that the protein purification toolbox can be expanded.6–8 However large scale crystallization is still far away from being a routine method for production of mAbs.
Another way to address improvement of the first step is to develop alternative capture techniques such as high-capacity capture steps on cation exchange media.9,10 Successful use of appropriate cation exchange columns has been reported to resolve downstream bottlenecks, sustain cost-effective production, and manage large quantities.11–14
Cation exchangers have proven to give high step yields and reduce the level of host cell proteins (hcp) very effectively. Another advantage of ion exchangers is their considerably higher chemical stability, which minimizes ligand leaching. Since a large number of different stationary phases for cation exchange chromatography are commercially available from different manufacturers, a well-designed evaluation strategy is necessary to identify the best cation exchanger for a given separation. Although in many cases the same functional groups have been utilized to create attractive binding sites for the proteins, all stationary phases vary significantly in a number of chemical and physical properties. In practice, not only does the base bead structure of the stationary phase have an impact on the binding and elution kinetics, but the surface modification chemistry also influences the protein binding mechanism.15
Design and optimization of ion-exchange chromatography unit operations require consideration of many operating and chromatographic parameters. In ion exchange chromatography, protein adsorption depends on (1) the composition and concentration of the protein sample, (2) operating conditions such as buffer composition and pH, flow rate and sample load and (3) physical properties of the adsorbent matrix.16 Several mathematical models describe the retention behavior of a protein depending on the relevant separation parameters. The linear gradient elution model developed by Yamamoto delivers data for the prediction of protein elution behavior, as well as information about stationary phase properties and electrostatic and non-electrostatic protein-matrix-interactions.17,18 Linear gradient elutions were performed and analysed as described by Ishihara and Yamamoto to obtain information about the strength of protein-matrix-interactions.16
Other important properties of chromatographic media are adsorption capacities and mass transfer characteristics. Numerous studies deal with the investigation of binding capacities and protein transport and the explanation of adsorption and diffusion mechanisms inside the chromatographic media using different methods.19–27 In this study, information about protein adsorption and mass transfer was obtained by stirred batch experiments and confocal laser scanning microscopy (CLSM).
For antibody capture in particular, novel Eshmuno™ S tentacle media were developed to provide high capacities and faster protein binding properties. The stationary phase is a surface-grafted, rigid, hydrophilic polyvinylether polymer bead. As the tentacles are highly flexible, the accessibility of the ionic groups without steric hindrance is improved, resulting in tighter binding of antibodies. All tentacles are covalently attached to the polyvinylether backbone and are chemically stable under conditions applied during chromatography, regeneration and sanitization. Binding strength, adsorption capacities and mass transfer rates were investigated to characterize the novel cation exchange resin. Results were discussed and compared to properties of Fractogel® EMD SO3− (M) and Toyopearl GigaCap S-650M.
Results and Discussion
Binding strength, transport mechanisms and dynamic binding capacities.
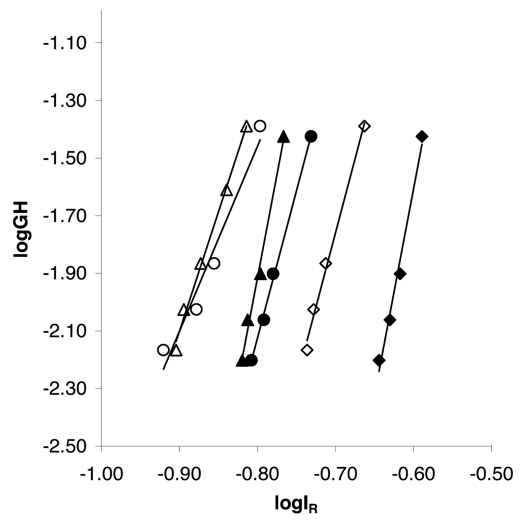
Linear gradient elutions were performed with mAb01 and the resins Fractogel® EMD SO3− and Eshmuno™ S at pH 5, 5.5 and 6 to determine the characteristic charge B, which is essentially a measure of the number of sites involved in binding, and A, a measure of the strength of the ionic interaction between the protein and the stationary phase. The resulting GH-IR-curves are shown in Figure 2 and the calculated parameters B and A are listed in Table 2.
Figure 2.
GH-IR-plots for the monoclonal antibody mAb01 and the resins Eshmuno™ S and Fractogel® SO3− (M) at different pH values. Linear gradient elutions were performed with 3.93 mL Superformance columns (10 mm i.d. x. 50 mm L) at a linear flow rate of 119 cm/h and gradient lengths of 15–90 CV from 0–1 M NaCl. The protein load was 0.44 mg/mL packed resin. Filled symbols represent Fractogel® SO3−, blank symbols Eshmuno™ S. Rhombes represent pH 5, circles pH 5.5 and triangles pH 6.
Table 2.
B and A values determined from GH-IR-plots with mAb01 for Fractogel SO3− and Eshmuno S
| pH 5 | pH 5.5 | pH 6 | ||||
| Resin | B | A | B | A | B | A |
| Fractogel SO3− | 13.37 | 6.77E-09 | 9.22 | 8.78E-08 | 13.39 | 1.78E-11 |
| Eshmuno S | 9.25 | 3.76E-07 | 5.43 | 3.18E-05 | 7.27 | 5.48E-07 |
The GH-IR-plots and the number of charges involved in protein binding B indicate that mAb01 binds more weakly to the functional groups of Eshmuno™ S compared with Fractogel® EMD SO3−. B-values derived from the slope of the GH-IR-curves with Eshmuno™ S are lower than B-values for Fractogel® EMD SO3− at the same pH. Furthermore, mAb01 elutes at lower salt concentrations in the case of Eshmuno™ S indicated by the shift of the GH-IR-curves to more negative log IR-values and therefore lower IR-values.
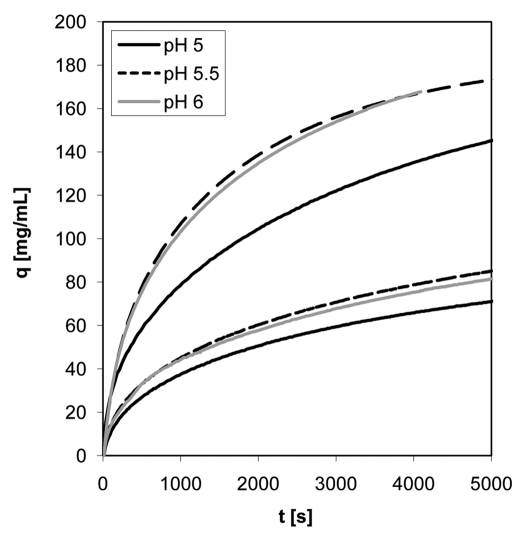
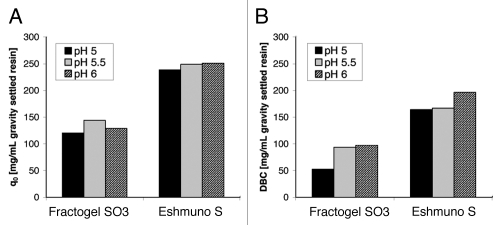
In addition to the binding strength and the elution behavior of the antibody, mass transfer properties of the two resins were examined by stirred batch experiments with mAb01. Uptake-curves were measured at pH 5, 5.5 and 6 with 0.5 mL settled resin in 100 mL protein solution. The initial antibody concentration was 1 mg/mL. Curves in Figure 3 show differences in the rate of protein binding and adsorption capacities of the two resins. Uptake of the antibody with Eshmuno™ S is enhanced compared to the uptake with Fractogel® EMD SO3−. In contrast to Fractogel® EMD SO3−, Eshmuno™ S particles are saturated to 50% after less than 30 min, whereas Fractogel® EMD SO3− beads needed nearly 50 min for 50% saturation. Furthermore, Eshmuno™ S showed higher maximum binding capacities for mAb01 than Fractogel® EMD SO3− for all examined pH values (Fig. 4). For Fractogel® EMD SO3− the maximum binding capacity q0 was observed at pH 5.5, while q0 is almost independent of pH for Eshmuno™ S.
Figure 3.
Uptake-curves from stirred batch experiments with mAb01 for Eshmuno™ S and Fractogel® SO3− (M). The three lower curves belong to Fractogel® SO3−, the three upper curves to Eshmuno™ S. Experiments were performed with 100 mL protein solution and 0.5 mL sedimented resin. The initial protein concentration was 1 mg/mL.
Figure 4.
Maximum binding capacities determined by stirred batch experiments (A) and dynamic binding capacities (B) for Fractogel® SO3− and Eshmuno™ S with mAb01. Stirred batch experiments were performed with 0.5 mL sedimented resin and 100 mL protein solution with an initial protein concentration of 1 mg/mL. 10% breakthrough experiments to determine DBC were performed with 1 mL Scout columns and a residence time of 2 min. The sample protein concentration was 1 mg/mL.
Adsorption capacities fitted from the uptake-curves were compared to DBC determined by breakthrough experiments (Fig. 4). DBC were determined with 1 mL scout columns and a residence time of 2 min. The same buffers as for the batch experiments were used with the sample concentration at 1 mg/mL. The highest DBC was determined at pH 6 for both resins. For Fractogel® EMD SO3− only a slight difference between the capacities obtained at pH 5.5 and 6 is observed, with the lowest capacity at pH 5. Eshmuno™ S shows almost identical capacities at pH 5 and 5.5.
The maximum binding capacity q0 for protein adsorption to the stationary phase is determined at equilibrium. Mass transfer rates thus are not a determining factor for q0. Ligand density can affect protein capacities in different ways. At low ligand density, capacities ascend with increasing density until the ligand spacing is comparable to the diameter of the protein that is adsorbed.30 At ligand densities well above this critical value additional binding sites can have a negative influence on the capacity because proteins will only pack into the pore space to a certain density as electrostatic effects repel adjacent protein molecules. Once that packing density has been achieved, the repulsive forces between the proteins dominate and additional ligands are not beneficial.31 To increase the efficiency with which the pore space is utilized, a more efficient distribution of the ligand within the pore space and a higher flexibility regarding binding orientation is beneficial. For the Eshmuno™ S resin the weaker binding of the antibody allows a more flexible and faster re-orientation of the adsorbed mAb at a high protein load.
DBC is strongly influenced by the time allowed for protein adsorption, i.e., residence time and mass transfer rates. The faster protein uptake of Eshmuno™ S, as compared with Fractogel® EMD SO3−, very likely contributes to the higher DBC of the former. Diffusion of the antibody into the Fractogel® EMD SO3− particles might be hindered by other antibody molecules already bound to the bead. Due to the strong protein-matrix interaction, as found by linear gradient elutions, a blockage of pore's entrances is most likely the reason. If the diffusion of protein into the particle pores is obstructed, mass transfer rates are decelerated and DBC are decreased. Weaker adsorption of the antibody to the stationary phase, as observed for Eshmuno™ S, might allow bound protein to detach and rebind, and therefore might prevent diffusional hindrance. Thus, to some extent weaker protein-matrix interactions can be attended by better protein transport characteristics and better dispersion of the protein across the whole particle, resulting in faster mass transport and higher binding capacities as found for Eshmuno™ S when compared with Fractogel® EMD SO3−.
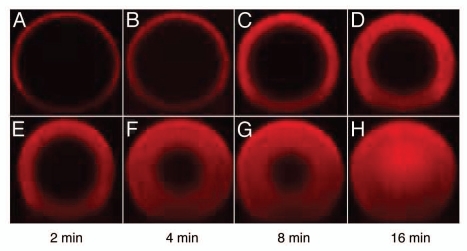
These considerations are supported by results from confocal laser scanning microscopy (Fig. 5). Examinations showed differences in the dispersion of mAb03 across Fractogel® EMD SO3− (M) and Eshmuno™ S particles. In these experiments, mAb03 was labeled to visualize the movement of the antibodies across the particle. On Fractogel® EMD SO3− beads, the front of labelled protein showed a clear boundary while the labeled antibodies formed a diffuse ring on Eshmuno™ S particles. This indicates weaker binding for Eshmuno™ S; the proteins seem to stick to the particle surface of Fractogel® EMD SO3− due to the stronger interaction. Further, in the case of Eshmuno™ S, mAb03 is spread over the particle much faster compared with Fractogel® EMD SO3−. This indicates differences in the transport mechanisms of Fractogel® EMD SO3− and Eshmuno™ S that seem to correlate with the strength of protein-matrix-interactions examined by linear gradient eutions. As with the results from LGE for mAb01, the ionic strength at elution of mAb03 was higher for Fractogel® EMD SO3− compared with Eshmuno™ S (results not shown).
Figure 5.
Confocal microscopy images: mAb03 uptake to Fractogel® SO3− (A–D) and Eshmuno™ S (E–H) during finite bath adsorption at pH 5 and 4 mS/cm. Images recorded at 2, 4, 8 and 16 min illustrate significant differences in mass transfer with Eshmuno™ S showing much faster uptake kinetics.
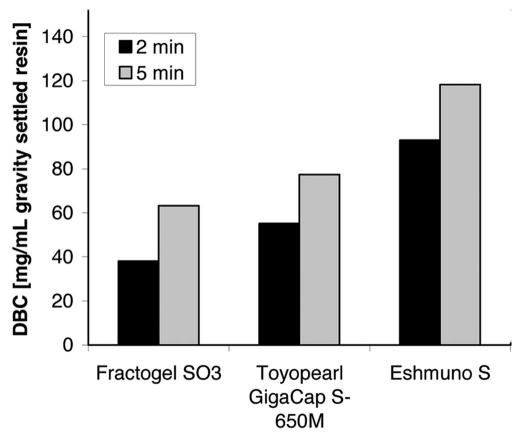
Also, the faster uptake kinetics for Eshmuno™ S resin has an influence on the dependency of DBC on residence time. DBC of Toyopearl GigaCap S-650M, Fractogel® EMD SO3− and Eshmuno™ S for mAb03 at 2 and 5 min residence times are shown in Figure 6. All resins show an increased DBC with lower flow rates, i.e., longer residence times. The capacities obtained for Eshmuno™ S are about 1.5 times higher than those obtained for Toyopearl GigaCap S-650M, which was reported as a material for high-capacity antibody capture.9 This increased DBC is also observed at 2 min residence time and allows high-capacity purification of the antibody at high linear flow rate (445 cm/h for 15 cm column height).
Figure 6.
Dynamic binding capacities of Toyopearl GigaCap S, Fractogel® SO3− (M) and Eshmuno™ S for mAb03 in dependence on the residence time. Capacities were determined at 10% breakthrough with buffer pH 5.5 containing 20 mM phosphate and NaCl (conductivity 4 mS/cm). Experiments were performed with an antibody concentration of 3 mg/mL and MediaScout® MiniChrom columns (50 mm L × 8 mm i.d.).
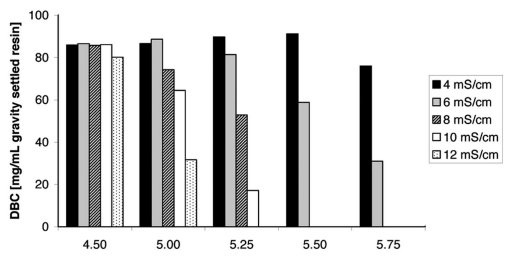
For a number of ion exchange resins unexpected behavior of the DBC for antibodies on pH values and conductivity was observed.31–33 In these materials, dextran surface extenders lead to an exclusion mechanism due to strong antibody binding to the outer part of the resin beads and exclusion of additional antibody from entering the bead. Weakening of the interaction by increasing conductivity and pH leads to an increase in DBC until a maximum is achieved, where DBC decreases with increasing conductivity and pH.
DBC for Eshmuno™ S and mAb03 depending on pH and conductivity are shown in Figure 7. For all pH values, the DBC at 4 mS/cm is almost the same, except at pH 5.75 which shows a slightly lower capacity. At the lowest pH (4.5), almost no dependency on the conductivity was found and high-capacity capture of antibodies at 12 mS/cm is possible. With increasing pH, the influence of the salt concentration in the buffer increases, although the differences between DBC at 4 or 6 mS/cm are rather marginal at pH 5.0 and 5.25. This indicates robustness of the process with respect to buffer ionic strength at low pH values. At pH values above pH 5.0, classical ion exchange behavior is observed and exclusion and pore blockage mechanisms do not play a significant role.
Figure 7.
Dynamic binding capacities of mAb03 on Eshmuno™ S for different pH values and conductivities. Capacities were determined at 10% breakthrough with buffers containing 20 mM phosphate and NaCl. Experiments were performed at a residence time of 2 min, and an antibody concentration of 3 mg/mL on a Superformance column (50 mm L × 10 mm i.d.).
Antibody capture with high capacity resins.
In addition to high binding capacities for pure antibodies, Eshmuno™ S has higher capacities than the other tested resins for capture of mAbs from diluted cell culture supernatant (Table 3). Obviously binding capacity data obtained with purified antibodies do not necessarily reflect binding properties determined using complex samples like clarified cell culture harvests.
Table 3.
Dynamic binding capacities1 of Toyopearl GigaCap S, Fractogel SO3− and Eshmuno S for the capture of mAbs from diluted cell culture supernatant (CCS)
| mAb03 CCS (mg/mL resin) | mAb03 purified (mg/mL resin) | mAb02 CCS (mg/mL resin) | mAb02 purified (mg/mL resin) | |
| Eshmuno S | 89 | 90 | 96 | 109 |
| Fractogel SO3 | 69 | 77 | 70 | 76 |
| Toyopearl GigaCap S | 64 | 83 | 64 | 88 |
Capacities were determined by breakthrough analysis with buffer containing 20 mM phosphate and 20 mM NaCl (conductivity 4.3 mS/cm). Experiments were performed at a residence time of 5 min (mAb02; 0.62 mg/mL; 5% breakthrough) or 2 min (mAb03; 1.5 mg/mL; 10% breakthrough) at pH 6 or pH 5.5, respectively.
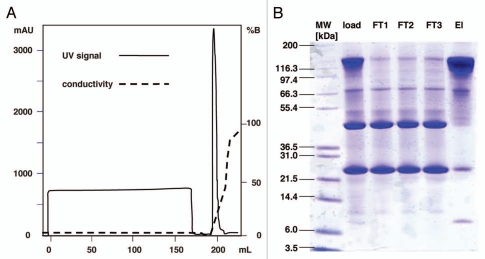
The chromatogram for direct capture of mAb02 from diluted cell culture supernatant on Eshmuno™ S is shown in Figure 8. The column was slightly overloaded (5% breakthrough) and 107 mg protein per mL of resin was applied to the column. The antibody was eluted with a linear salt gradient in a narrow peak. The recovery rate for the antibody was 99% and the yield 94%.
Figure 8.
Chromatogram of direct capture of mAb02 (0.62 mg/mL) from diluted cell culture supernatant on Eshmuno™ S (A). A 1 mL Scout column was loaded to 5% breakthrough. Experiments were performed with binding buffer pH 6 containing 20 mM phosphate and 20 mM NaCl (conductivity 4.3 mS/cm) at a residence time of 5 min. Bound protein was eluted by a linear gradient from binding buffer to elution buffer containing 20 mM phosphate and 0.8 M NaCl in 20 column volumes. Sample, flowthrough fractions (FT) and the pooled elution fractions (El) were analysed by SDS page under non-reducing conditions (B).
For the purification of 10 kg antibody (2,000 L bioreactor, 5 g/L titer) a protein A capture column of 250 L (US $250,000 resin costs, DBC 40 g/L, US $10,000 per liter) is required, while the same quantity of antibody can be bound to 100 L of high capacity ion exchange resins (less than 1/10 of the protein resin costs, DBC 100 g/L). Additional cost savings can be achieved due to shorter process times and a longer resin life span.
To evaluate the purity of the mAb, the eluate peak was pooled and analyzed by SDS-PAGE using a NuPAGE 4–12% BisTris gel with MES running buffer (Fig. 8). The protein bands were stained with Coomassie. Only traces of intact antibody could be detected in the flowthrough fractions, and the amount of impurities seen in the load and flowthrough is significantly reduced in the eluate pool.
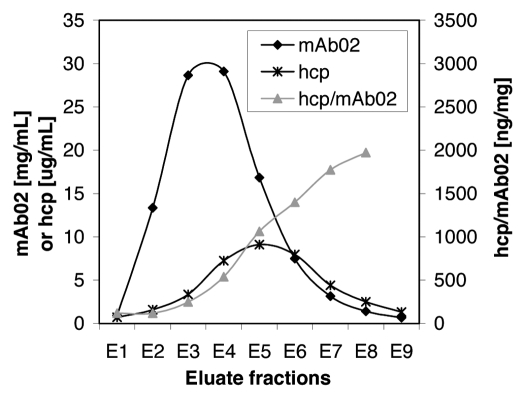
The collected fractions were further analyzed by SEC and ELISA. The total amount of hcp in fraction E1 to E9 and the antibody concentration is shown in Figure 9. The amount of hcps/mg of eluted antibody increases notably in later fractions, indicating that hcps and antibody are not co-eluting. The overall hcp reduction factors are summarized in Table 4.
Figure 9.
mAb02 and hcp concentrations in the eluate fractions. The antibody concentration was determined by analytical SEC. Hcp concentration was measured with an ELISA assay specific for the host cells. Most of the hcp elute after the main antibody peak is desorbed from the column.
Table 4.
Removal of hcps during capture and post protein A purification using different cation exchangers1
When used as a capture step Eshmuno™ S provides 150 fold hcp removal, which is three times more than Fractogel® EMD SO3− and 25% more than Toyopearl GigaCapS-650M for mAb02. On the other hand, results obtained for mAb04 indicate better removal of hcps when using Fractogel® EMD SO3− compared to Eshmuno™ S (77 fold compared to 108 fold). This might be caused by the higher total mAb load for Eshmuno™ S compared to Fractogel® EMD SO3−.
For the post protein A pool, Eshmuno™ S reduces hcp levels about 5- to 7-fold, whereas Fractogel® EMD SO3− shows nearly 4-fold clearance at 4 mS/cm and pH 5.5. There was no difference in removal between experiments performed at 2 min or 5 min residence time (data not shown).
Removal of hcp can vary quite widely, and experiments have indicated that these variations are linked to differences in surface chemistry of the chromatographic resin, as well as cell culture and harvest conditions.5 Data presented here indicate a contribution to hcp removal in a range that can be normally achieved by a cation-exchange chromatography step; however, the influence of the post load wash conditions were not studied, and thus further investigations are required.
Mechanical stability of Eshmuno™ S.
In order to save time and effort later in development, large scale manufacturing considerations should be taken into account at the beginning of process development. Compared to packing on a laboratory scale, larger column diameters can become problematical due to increasing back pressures. The best resin and separation conditions must be identified and additionally a test has to be conducted to see whether the chosen chromatographic media can be operated at the desired flow rates independent of column sizes. Scale-up of ion-exchange chromatography operations is usually achieved by increasing the column diameter while keeping the resin bed height and linear flow rate constant. This ensures that the residence time is always the same.
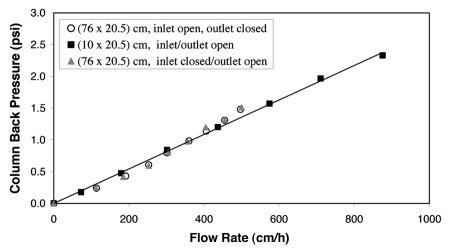
Since pressure drop across chromatography beds employing soft media can be a significant problem in the operation of large-scale preparative chromatography columns, the mechanical stability of Eshmuno™ S was examined in 10 and 76 cm i.d. columns. With respect to rigidity and compressibility, vinylether-based Eshmuno™ S behaved similarly to the semi-rigid polymethacrylate-based resins Toyopearl and Fractogel® EMD SO3−. In order to achieve a properly packed column, the percent compression for Eshmuno™ S is in the range of 8–10.5% with respect to settled resin. The linear relationship between back-pressure and velocity is shown in Figure 10. Pressure-flow profiles for 10.5% are in a linear range up to flow rates of about 800 cm/h, experimental data using the 76 cm i.d. column were limited by the maximum flow rate of the pump at 420 cm/h. Due to linear pressure versus flow curves for Eshmuno™ S, pressure drops and flow velocities can be predicted for industrial-scale columns by just a few experiments on a laboratory scale.
Figure 10.
Pressure-flow-data for Eshmuno™ S. Eshmuno™ S was flow packed into columns of 20.5 cm bed height in 0.01 M NaOH with 10.5% bed compression. The resin showed similar pressure-flow curves with 10 cm or 76 cm i.d. column.
Materials and Methods
Resins and columns.
The strong cation exchangers Fractogel® EMD SO3− (M), Eshmuno™ S (Merck KGaA Darmstadt) and Toyopearl GigaCap S-650 (Tosoh Bioscience GmbH) were used in this study. Resins were packed in 1 mL Scout Columns (Merck KGaA Darmstadt, Germany), Superformance columns (Götec-Labortechnik GmbH, Germany) or MediaScout® MiniChrom columns (Atoll, Germany). Properties of the stationary phases used in this work are summarized in Table 1.
Table 1.
Properties of strong cation exchangers
| Trade name | Base matrix | Mean particle size (µm) | Ion capacity (µequ/mL) | Lysozyme dynamic binding capacity at 10% breakthrough (mg/mL settled resin) | Polyclonal hIgG dynamic binding capacity at 10% breakthrough (mg/mL settled resin) |
| Eshmuno™ S | cross-linked hydrophilic vinylether with “tentacle” polymer functional groups | 85 | 50–100 | 1001 | 802 |
| Fractogel* EMD SO3− (M) | Methacrylate with “tentacle” polymer functional groups | 65 | 70–110 | 903 | 602 |
| Toyopearl* GigaCap S-650 M | Methacrylate with proprietary polymer functional groups | 75 | 100–00 | 1674 | 1002 |
residence time 1 min; pH 7.0.
residence time 2 min; pH 5.0.
residence time 2 min; pH 7.0.
residence time 0.85 min; pH 4.7.28
Buffers and samples.
Different buffers were used for the experimental work: phosphate/acetate buffer consisting of 21.5 mM NaH2PO4, 3.4 mM Na2HPO4, 16.5 mM sodium acetate and 0.48 g acetic acid for pH 5 and 5.5, 30 mM Na-citrate buffer at pH 6 and buffer containing 20 mM NaH2PO4 for pH values between 4.5 and 6. PH values were adjusted with NaOH or HCl. All buffers were prepared both without sodium chloride (buffer A) as described above and with additional 1 M NaCl (buffer B). Salt concentrations between 0 and 1 M NaCl could be prepared by mixing these two buffers.
Experiments were performed with the monoclonal antibodies mAb01, mAb02 and mAb03, which were either diluted in buffer or diafiltrated.
Chromatography systems.
Experiments were carried out with the liquid chromatography systems ÄKTA UPC 100, ÄKTApurifier 100 or ÄKTApurifier UPC 100 (GE Healthcare). A 76 cm i.d. Eastern Rivers, Inc. column equipped with hydraulic pistons to lower the head was used for measuring pressure versus flow curves.
Determination of dynamic binding capacities.
Dynamic binding capacities (DBC) for different antibodies and resins were determined by breakthrough curves. Proteins were diluted with binding buffer and applied on the column until either 5 or 10% breakthrough was reached. After removal of unbound protein by washing, bound protein was eluted by increasing the salt concentration. DBC were determined with varying residence time, pH value, and conductivity of the binding buffer.
Linear gradient elutions.
Linear gradient elutions to determine GH-IR-plots were performed with mAb01 and mAb03 and the cation exchangers Fractogel® EMD SO3− (M) and Eshmuno™ S. The antibodies were diluted in buffer A and applied to the columns equilibrated with the same buffer to a protein load of 0.44 mg/mL of packed resin. After a washing step a linear salt gradient from buffer A to buffer B was applied. The lengths of the gradients were in the range of 15–90 column volumes. The linear flow rate F/Ac was 119 cm/h. Gradient elutions were performed at pH 5.0, 5.5 and 6.0.
The peak position was determined by fitting the elution curve with an EMG-Fit using the program TableCurve 2D (Systat Software Inc.,). The ionic strength IR [M] was calculated from the conductivity at this position. GH-IR-curves were determined as shown by Ishihara and Yamamoto.16
Stirred batch experiments.
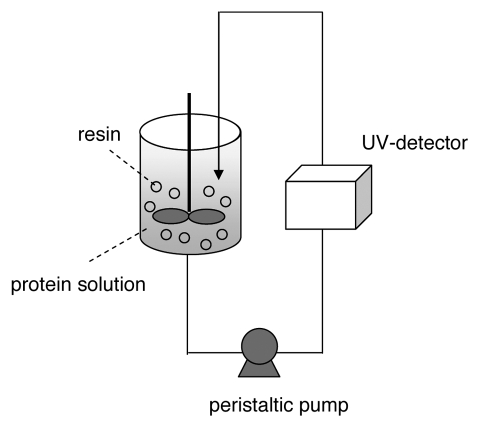
Uptake curves for Fractogel® EMD SO3− (M) and Eshmuno™ S with mAb01 were obtained by stirred batch experiments. In this method, gel particles are suspended in a vessel containing the protein solution. The amount of bound protein is determined by recirculation of the protein solution through a UV-detector (Fig. 1).
Figure 1.
Experimental set-up for stirred batch experiments.
The gel particles were suspended by agitation with a stirrer and held back in the vessel with a frit while protein solution was continuously recirculated through a UV flow cell back into the vessel with a peristaltic pump. Experiments were performed by injection of 0.5 mL sedimented resin (VM) in 100 mL (V) antibody solution with a protein concentration C0 of 1 mg/mL. The absorbance at 280 nm was measured to determine the concentration of unbound protein C and thereby calculate the amount of bound protein per mL resin q with the following equation:
The maximum adsorption capacities based on the volume of resin q0 were fitted from the uptake-curves with equations able to describe mass transfer processes in stationary phases.19–21
Confocal laser scanning microscopy.
Confocal laser scanning microscopy (CLSM) using a mAb labelled with ALEXA® Fluor 546 (Molecular Probes, Eugene Oregon, USA) was conducted as described by Stanislawski.29 Fluorophore-labelled mAb03 was scanned under Leica CLSM TCS SL using oil immersion objective (40 fold magnification).
Protein analysis.
SDS-PAGE was performed using NuPAGE 4–12% BisTris gels (Invitrogen, Carlsbad, CA, USA) run with MES buffer according to the manufacturer's instructions and visualized with Coomassie staining. Mark12 Unstained Standard (Invitrogen) was used as protein standard.
Analytical size-exclusion chromatography (SEC) was conducted using a G3000SWXL column (Tosoh Bioscience GmbH) with a GFC-3000 guard cartridge (Phenomenex). The mobile phase was a 25 mM NaH2PO4 × H2O buffer solution (pH adjusted to 7.0 with 5 M NaOH) containing 150 mM Na2SO4 and 0.05% NaN3. The column was operated isocratically at a constant flow rate (1 mL/min) using a LaChromHPLCsystem (Merck-Hitachi, Darmstadt, Germany).
Hcp were detected using commercial microtitre plate ELISA methods provided by Cygnus Technologies, NC, USA according to the manual.
Conclusions
Cation-exchange chromatography is currently part of all mAb manufacturing processes and has been proven to give high step yields and to reduce the level of hcp very effectively. Its potential as capture step is still underestimated, although cost savings can be realized through use of ion-exchange chromatography as the first column step. However, detailed knowledge of the relevant resin's properties and optimal process parameters is required.
Therefore many parameters, including binding strength, adsorption capacities, mass transfer rates as well as the influence of salt concentrations, pH, and flow rate have to be assessed to evaluate the strengths and weaknesses of ion exchange resins.
In this study higher binding capacities were determined for Eshmuno™ S compared with the other tested resins Fractogel® EMD SO3− and Toyopearl GigaCap S-650M. Increased DBC were obtained for different mAbs, pH-values and conductivities. Fast mass transfer as found by stirred batch experiments allowed high DBC even at high flow rates.
Superior DBC of Eshmuno™ S obtained for pure mAbs were also found for direct capture of mAbs from cell culture supernatant. The removal of hcp was in the same range as for Fractogel® EMD SO3− and Toyopearl GigaCap S-650M. Results of this study show that the increase in binding capacity is not at the expense of specificity, and indicate the applicability of this novel cation-exchanger for high capacity antibody capture.
With respect to production processes the excellent pressure flow behavior of Eshmuno™ S allows the resin to be operated in process scale columns. Fast mass transfer rates enable small elution volumes, which directly influences the duration and performance of a chromatographic step. The results achieved in this study showed that novel cation-exchange resins can be implemented as an alternative antibody capture step. It combines high capacities, yields and the ability to significantly reduce host cell impurities and allows high flow rates, and therefore high throughput.
Acknowledgements
The author would like to acknowledge the contributions of Andreas Stein, Sigrid Sturmfels and Tessa Chao. Additional thanks are due to Bernd Stanislawski for providing CLSM images and his helpful discussions.
Abbreviations
- CLSM
confocal laser scanning microscopy
- DBC
dynamic binding capacity [mg/mL gravity settled resin]
- hcp
host cell protein
- LGE
linear gradient elution
- A
parameter from the GH-IR-plot
- A includes the equilibrium constant
the ionic capacity of the resin and B [MB]
- B
number of charges involved in protein adsorption
- C
concentration of unbound protein [mg/mL]
- C0
initial protein concentration in the sample [mg/mL]
- GH
normalized gradient slope [M]
- IR
ionic strength at peak position [M]
- q
amount of bound protein [mg/mL gravity settled resin]
- q0
maximum adsorption capacity [mg/mL gravity settled resin]
- V
volume of protein sample [mL]
- VM
sample volume of gravity settled resin [mL]
Footnotes
Previously published online: www.landesbioscience.com/journals/mabs/article/12303
References
- 1.Kelley B. Industrialization of mAb production technology—The bioprocessing industry at a crossroads. MAbs. 2009;1:443–452. doi: 10.4161/mabs.1.5.9448. [DOI] [PMC free article] [PubMed] [Google Scholar]
- 2.Kelley B. Very large scale monoclonal antibody purification: The case for conventional unit operations. Biotechnol Prog. 2007;23:995–1008. doi: 10.1021/bp070117s. [DOI] [PubMed] [Google Scholar]
- 3.Hober S, Nord K, Linhult M. Protein A chromatography for antibody purification. J Chromatogr B. 2007;848:40–47. doi: 10.1016/j.jchromb.2006.09.030. [DOI] [PubMed] [Google Scholar]
- 4.Fahrner RL, Knudsen HL, Basey CD, Galan W, Feuerhelm D, Vanderlaan M, et al. Industrial purification of pharmaceutical antibodies: development, operation and validation of chromatography processes. Biotechnol Genet Eng Rev. 2001;18:301–327. doi: 10.1080/02648725.2001.10648017. [DOI] [PubMed] [Google Scholar]
- 5.Shukla AA, Hubbard B, Tressel T, Guhan S, Low D. Downstream processing of monoclonal antibodies—application of platform approaches. J Chromatogr B. 2007;848:28–39. doi: 10.1016/j.jchromb.2006.09.026. [DOI] [PubMed] [Google Scholar]
- 6.Glynn J. Process-scale precipitation of impurities in mammalian cell culture broth if certain engineering challenges can be addressed, precipitation may prove to be a valuable tool for antibody purification. BioPharm Int Suppl. 2008 [Google Scholar]
- 7.Wang J, Diehl T, Aguiar D, Dai X, Arunakumari A. Precipitation of process-derived impurities in non-protein a purification schemes for antibodies. BioPharm Int Suppl. 2009 [Google Scholar]
- 8.Przybycien TM, Pujar NS, Steele LM. Alternative bioseparation operations life beyond packed-bed chromatography. Curr Op Biotechnol. 2004;15:469–478. doi: 10.1016/j.copbio.2004.08.008. [DOI] [PubMed] [Google Scholar]
- 9.Lain B, Cacciuttolo MA, Zarbis-Papastoitsis G. Development of a high-capacity mab capture step based on cation-exchange chromatography. BioProcess International. 2009 [Google Scholar]
- 10.Arunakumari A. Implementing cost reduction strategies for humAb manufacturing processes. BioProcess International. 2009 [Google Scholar]
- 11.Arunakumari A, Wang J, Ferreira G. Alternatives to protein A: improved downstream process design for human monoclonal antibody production. BioPharm Int. 2007;20:36–40. [Google Scholar]
- 12.Ferreira GM, Dembecki KP, Arunakumari A. A two-column process to purify antibodies without protein a. BioPharm Int. 2007;20:32–43. [Google Scholar]
- 13.Wang J, Diehl T, Watkins-Fischl M, Perkins D, Aguiar D, Arunakumari A. Optimizing the primary recovery step in nonaffinity purification schemes for humAbs. BioPharm Int. 2008;21:6–10. [Google Scholar]
- 14.Follman DK, Fahrner RL. Factorial screening of antibody purification processes using three chromatography steps without protein A. J Chromatogr A. 2004;1024:79–85. doi: 10.1016/j.chroma.2003.10.060. [DOI] [PubMed] [Google Scholar]
- 15.Bruch T, Graalfs H, Jacob L, Frech C. Influence of surface modification on protein retention in ion-exchange chromatography—evaluation using different retention models. J Chromatogr A. 2009;1216:919–926. doi: 10.1016/j.chroma.2008.12.008. [DOI] [PubMed] [Google Scholar]
- 16.Ishihara T, Yamamoto S. Optimization of monoclonal antibody purification by ion-exchange chromatography. Application of simple methods with linear gradient elution experimental data. J Chromatogr A. 2005;1069:99–106. doi: 10.1016/j.chroma.2004.10.040. [DOI] [PubMed] [Google Scholar]
- 17.Yamamoto S, Nakanishi K, Matsuno R, Kamikubo T. Ion exchange chromatography of proteins—prediction of elution curves and operating conditions I. Theoretical considerations. Biotechnol Bioeng. 1983;25:1465–1483. doi: 10.1002/bit.260250605. [DOI] [PubMed] [Google Scholar]
- 18.Yamamoto S, Nakanishi K, Matsuno R, Kamikubo T. Ion exchange chromatography of proteins—prediction of elution curves and operating conditions II. Experimental verification. Biotechnol Bioeng. 1983;25:1373–1391. doi: 10.1002/bit.260250516. [DOI] [PubMed] [Google Scholar]
- 19.Carta G, Ubiera AR, Pabst TM. Protein mass transfer kinetics in ion exchange media: Measurements and interpretations. Chem Eng Technol. 2005;28:1252–1264. [Google Scholar]
- 20.Fernandez MA, Carta G. Characterization of protein adsorption by composite silica-polyacrylamide gel anion exchangers I. Equilibrium and mass transfer in agitated contactors. J Chromatogr A. 1996;746:169–183. [Google Scholar]
- 21.Hunter AK, Carta G. Protein adsorption on novel acrylamido-based polymeric ion exchangers II. Adsorption rates and column behaviour. J Chromatogr A. 2000;897:81–97. doi: 10.1016/s0021-9673(00)00865-7. [DOI] [PubMed] [Google Scholar]
- 22.Langford JF, Xu X, Yao Y, Maloney SF, Lenhoff AM. Chromatography of proteins on charge-variant ion exchangers and implications for optimizing protein uptake rates. J Chromatogr A. 2007;1163:190–202. doi: 10.1016/j.chroma.2007.06.028. [DOI] [PMC free article] [PubMed] [Google Scholar]
- 23.Bowes BD, Koku H, Czymmek KJ, Lenhoff AM. Protein adsorption and transport in dextran-modified ion-exchange media I: Adsorption. J Chromatogr A. 2009;1216:7774–7784. doi: 10.1016/j.chroma.2009.09.014. [DOI] [PMC free article] [PubMed] [Google Scholar]
- 24.Stone MC, Giorgio Carta G. Protein adsorption and transport in agarose and dextran-grafted agarose media for ion exchange chromatography. J Chromatogr A. 2007;1146:202–215. doi: 10.1016/j.chroma.2007.02.041. [DOI] [PubMed] [Google Scholar]
- 25.Stone MC, Tao Y, Carta G. Protein adsorption and transport in agarose and dextran-grafted agarose media for ion exchange chromatography: Effect of ionic strength and protein characteristics. J Chromatogr A. 2009;1216:4465–4474. doi: 10.1016/j.chroma.2009.03.044. [DOI] [PubMed] [Google Scholar]
- 26.Müller E. Comparison between mass transfer properties of weak-anion-exchange resins with graft-functionalized polymer layers and traditional ungrafted resins. J Chromatogr A. 2003;1006:229–240. doi: 10.1016/s0021-9673(03)00555-7. [DOI] [PubMed] [Google Scholar]
- 27.Hashim MA, Chu KH, Tsan PS. Determination of lumped rate coefficients of proteins: Effect of adsorption. Chem Eng Technol. 1996;19:137–142. [Google Scholar]
- 28.Pabst TM, Suda EJ, Thomas KE, Mensah P, Ramasubramanyan N, Gustafson ME. Binding and elution behavior of proteins on strong cation exchangers. J Chromatogr A. 2009;1216:7950–7956. doi: 10.1016/j.chroma.2009.09.040. [DOI] [PubMed] [Google Scholar]
- 29.Stanislawski B, Schmit E, Ohser J. Imaging of fluorophores in spherical beads and stereological estimation of radial density distributions. Submitted to Image Anal Stereol. [Google Scholar]
- 30.DePhillips P, Lenhoff AM. Determinants of protein retention characteristics on cation-exchange adsorbents. J Chromatogr A. 2001;933:57–72. doi: 10.1016/s0021-9673(01)01275-4. [DOI] [PubMed] [Google Scholar]
- 31.Hardin AM, Harinarayan C, Malmquist G, Axén A, van Reis R. Ion exchange chromatography of monoclonal antibodies: Effect of resin ligand density on dynamic binding capacity. J Chromatogr A. 2009;1216:4366–4371. doi: 10.1016/j.chroma.2008.08.047. [DOI] [PMC free article] [PubMed] [Google Scholar]
- 32.Harinarayan C, Mueller J, Ljunglöf A, Fahrner R, Van Alstine J, van Reis R. An exclusion mechanism in ion exchange chromatography. Biotechnol Bioeng. 2006;95:775–787. doi: 10.1002/bit.21080. [DOI] [PubMed] [Google Scholar]
- 33.Hart DS, Harinarayan C, Malmquist G, Axén A, Sharma M, van Reis R. Surface extenders and an optimal pore size promote high dynamic binding capacities of antibodies on cation exchange resins. J Chromatogr A. 2009;1216:4372–4376. doi: 10.1016/j.chroma.2008.11.083. [DOI] [PubMed] [Google Scholar]


