Abstract
Prostate cancer that has progressed to metastatic disease remains largely untreatable. Nearly 90% of patients with advanced prostate cancer develop skeletal metastases, resulting in a substantial reduction in the quality of life and a drastic worsening of patient prognosis. The mechanisms involved in prostate cancer cell dissemination, however, remain poorly understood. We previously reported the identification of a highly tumorigenic E-cadherin positive prostate tumor stem cell subpopulation that expressed the embryonic stem cell markers SOX2 and OCT3/4. We herein demonstrate that this subpopulation is also highly invasive and, importantly, is capable of altering its E-cadherin expression during the process of invasion. The non-tumorigenic E-cadherin negative subpopulation which minimally expresses SOX2 or OCT3/4 was found to be poorly invasive. In addition, targeted knockdown of SOX2 or OCT3/4 markedly suppressed the invasion of prostate cancer cells. Taken together, these findings indicate that the expression of SOX2 or OCT3/4 is required for invasive cell capacity, but the ability to modulate E-cadherin is the key permissive factor enabling cancer stem cell invasion in vitro. We therefore propose a model in which the post-epithelial to mesenchymal transition phenotype progresses to a frank, aggressive, and invasive phenotype by a process requiring the acquisition of E-cadherin plasticity. Considering the clinical significance of the metastatic complications of prostate adenocarcinoma, the identification of factors that promote the dissemination of the malignant prostate phenotype is essential to establish effective therapies to combat this disease in future.
Keywords: Prostate cancer invasion, cancer stem cell, E-cadherin, SOX2; OCT3/4
Introduction
Prostate cancer has become the most frequently diagnosed cancer and the second leading cause of cancer-related deaths in North American men [1, 2]. Surgery and radiation therapy are widely used to treat prostate cancer patients and although largely successful, they have an unacceptable rate of failure. The most common reason for these failures is the inability to control tumor progression and metastases [3, 4]. As a consequence the prognosis for advanced prostate cancer patients remains particularly grim, and current therapies for metastatic prostate cancer have short-term clinical benefits at best.
The dissemination of tumor cells is an early event in the metastatic cascade, and correlates with a loss of epithelial cell differentiation and the acquisition of a migratory and invasive phenotype. This phenomenon, referred to as the epithelial to mesenchymal transition (EMT), is critical for appropriate embryogenesis and plays a crucial role in carcinogenesis and tumor progression. In particular, the molecular alterations involved in this process correlate with the significant down-regulation of the homotypic cellular adhesion molecule E-cadherin [5]. E-cadherin has been shown in numerous clinical studies to be down-regulated, silenced, or aberrantly expressed in multiple cancer types [6], particularly in more advanced disease [7]. However, several recent studies describe E-cadherin expression, notably re-expression, in advanced metastatic tumors compared to their primary tumor counterparts [8, 9], which was found to correlate with invasion and poor patient prognosis [10-12]. The mechanism responsible for the latter observation is poorly understood, but may rely on gene de-repression of E-cadherin [13, 14] or a post-translational mechanism, such as stabilization of E-cadherin at the membrane. In particular, the role of E-cadherin in cancer progression to the metastatic phenotype remains unclear.
We have previously shown using flow cytometry that E-cadherin can serve as a distinct surface marker to isolate prostate tumor initiating cells [15]. In particular we demonstrated that only E-cadherin positive (E-cad+) cell subpopulations expressed high levels of the embryonic stem cell markers (SOX2, OCT3/4, Nanog, Klf4 and c-Myc), formed colonies, grew as spheres under non-adherent conditions, and exhibited a high degree of tumorigenicity in immunodeficient mice [15]; all of these characteristics are indicative of the cancer stem cell phenotype [16]. Furthermore, knockdown of SOX2 or OCT3/4 abolished the tumor-forming ability of these cells [15].
Although cancer stem cells can vary by definition, they generally comprise less than 10% of the population of a tumor [17]. However, cancer stem cells have been implicated as a key component in the formation and spread of human cancers to distant sites [16]. In the present study we examined the invasive ability of isolated stem and non-stem prostate cancer cell populations, and the role of E-cadherin plasticity in the invasion process.
Materials and methods
Cell lines and targeted RNA knockdown
DU145 and PC3 prostate cancer cell lines were obtained from the American Tissue Type Culture Collection (ATCC, Manassas, VA) and maintained in cell culture medium under the recommended conditions. shRNA-mediated knockdown of OCT3/4 or SOX2 was performed as previously described [15]. E-cadherin SmartPool siRNAs (Dharmacon, Lafayette, CO) were transfected using the DharmaFECT 1 reagent (Dharmacon) for DU145 and Oligofectamine (Invitrogen, Carlsbad, CA) in PC3 cells according to the manufacturer's instructions. After 72 h, the expression levels of target proteins were analyzed by western blot.
Real-time PCR
Total RNA was isolated with the RNAqueous-Micro reagent (Ambion, Austin, TX). Reverse transcription was performed with the Verso cDNA Kit (Thermo Scientific, Waltham, MA) according to the manufacturer's recommendations. Quantitative real-time PCR (qPCR) was performed to determine the expression levels of EMT-related genes (E-cadherin, Slug, Snail, and Vimentin). PCR was carried out with primers (1 μl), SYBR Green PCR Master Mix (both from Applied Biosystems, Carlsbad, CA) and cDNA (20 ng) using the ABI 7500 Fast Real-Time PCR System (Applied Biosystems). The sequences of the primers were as follows: E-cadherin Forward 5'-ACCAGAATAAAGACCAAGTGACCA-3', Reverse 5'-AGCAAGAGCAGCAGAATCAGAAT-3'; Slug Forward 5'-GAGTCTGTAATAGGATTTCCCATAG-3', Reverse 5'-CTTTAGTTCAACAATGGCAAC-3'; Snail Forward 5'-TTGGATACAGCTGCTTTGAG-3', Reverse 5'-ATTGCATAGTTAGTCACACCTC-3'; Vimentin Forward 5'-AATGGCTCGTCA CCTTCGTGAAT-3', Reverse 5'-CAGATTAGTTTCCCTCAGGTTCAG-3'; Ac-tin Forward 5'-CTCCTCC TGAGCGCAAGTACTC-3', Reverse 5'-TCCTGC TTGCTGATCCACATC-3'. The mRNA expression levels of target genes were normalized to actin expression levels using the ΔΔCt method. Gene expression values of the initiating (t=0) samples were assigned as 1.0.
Invasion assays
Matrigel invasion assays were performed according to the manufacturer's instructions (BD Biosciences, San Jose, CA). Cells were washed, resuspended in serum-free medium, and plated into the top chamber. FBS was used as a chemoattractant in the bottom chamber. Chambers were incubated for 24 h. Uninvaded cells, which remained in the top chamber, were removed with a cotton swab, and invaded cells lying on the bottom face of the membrane were fixed with 4% paraformaldehyde and stained with crystal violet. The membranes were mounted on slides, and the invaded cells were quantified when viewed under light microscopy. To examine E-cadherin expression in the top and bottom chambers, invasion chambers were used in parallel. Top-chamber cells were stained with E-cadherin after removing invaded cells. In duplicate samples, the top chamber cells were removed, and the invaded cells were stained. For experiments examining E-cadherin re-expression, the chambers were incubated for 4 h, and the top-chamber cells were removed. The invaded cells were incubated for an additional 5, 10 or 15 h. At the end of each incubation time, cells were fixed and stained with E-cadherin. For qPCR, top-chamber cells were collected by trypsinization.
Immunofluorescence staining
Immunofluorescence staining was performed on cells fixed to invasion membranes. Cells were fixed with 4% paraformaldehyde and permeabilized with 0.2% Triton X-100. Nonspecific antigen binding sites were blocked with 10% goat serum/0.05% Triton X-100/PBS and incubated with E-cadherin (BD Biosciences) or CD44 (Cell Signaling Technology, Danvers, MA) for 2 h at room temperature. Slides were washed, incubated with AlexaFluor594- or AlexaFluor488-conjugated secondary antibodies (Invitrogen), and mounted with Vectashield plus DAPI (Vector Laboratories, Southfield, MI) to visualize nuclei. Cells were examined under light fluoroscopy using a Zeiss Axiophot microscope (Carl Zeiss Meditec, Dublin, CA).
Immunoblot analyses
Western blot analyses were performed as previously described [15]. Antibodies against c-Myc, c-Met and β-actin (Cell Signaling), OCT3/4, SOX2 and tubulin (Santa Cruz Biotechnology), and Nestin, β-catenin and E-cadherin (BD Biosciences) were used for the analyses.
Flow cytometry and cell sorting
Flow cytometry and cell sorting were performed as previously described [15].
Prostate spheroid formation assays
E-cad+ and E-cad- cells were collected by trypsinization after invasion, and spheroid formation assays were performed as previously outlined [15].
Statistical analysis
Differences were analyzed using Student's t-test. P-values of less than 0.05 were considered statistically significant.
Results
Highly invasive E-cad+ cells isolated from heterogeneous DU145 and PC3 cell populations possess cellular stemness
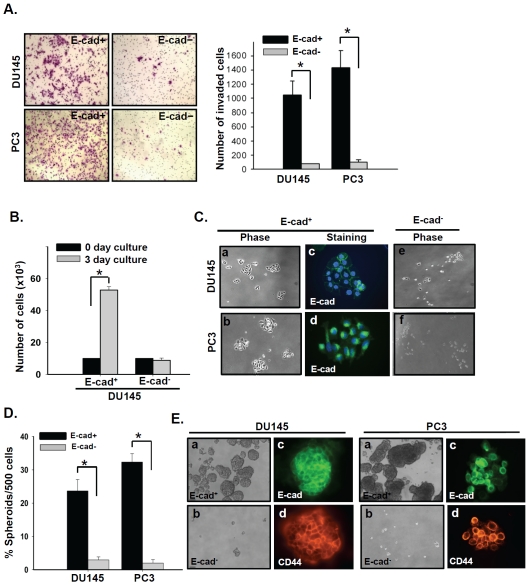
We have previously shown that the E-cad+ cells derived from DU145 and PC3 human prostate cancer cells possess stem-like properties, including the ability to form spheroids, expression of the embryonic stem cell markers SOX2, OCT3/4, Nanog, Klf4, and c-Myc, and the ability to form tumors with a high efficiency when injected into SCID mice [15]. In the present study, the invasive properties of the E-cad+ and E-cad-subpopulations isolated from DU145 and PC3 cells were examined in detail using these isolated prostate cancer cell subpopulations. As shown in Figure 1A, highly purified DU145 and PC3 E-cad+ cells efficiently invaded through the Matrigel-coated membrane, but E-cad- cells from each cell line were only minimally invasive.
Figure 1.
E-cad+ subpopulations isolated from DU145 and PC3 prostate cancer cells have a high invasive capacity and sustain stemness post-invasion. (A) Invasion was evaluated in E-cad+ and E-cad- subpopulations isolated from DU145 and PC3 cells. E-cad+ and E-cad-cells were plated in invasion chambers immediately after cell sorting. Twenty-four hours later, non-invaded (top-chamber) cells were removed, and the invaded cells were fixed and stained with crystal violet. *, P < 0.001. (B) Growth of invaded E-cad+ and E-cad- DU145 cells. After a 24 h invasion period, invaded E-cad+ and E-cad-cells were collected and plated under adherent culture conditions for 3 days and quantified. *, P < 0.001. (C) Phase-contrast photographs of invaded E-cad+ and E-cad-DU145 and PC3 cells after 3 days of culture, a, b, c and d, Invaded E-cad+ cells exhibited a holoclone-type morphology (10x) as well as E-cadherin expression (40x). e and f, phase-contrast photographs of invaded E-cad- cells after 3 days of culture. (D) In vitro quantification of prostate cell spheroids formed by invaded E-cad+ and E-cad- cells. The data are represented by the percentage of spheroids formed per 500 seeded cells ± SD. *, P < 0.001. (E) a and b, Phase-contrast images of DU145 (left panel) and PC3 (right panel) spheroids seeded by invaded E-cad+(top) and E-cad- (bottom) cells (10x). c and d, Images of spheroids immunostained with antibodies against E-cadherin (E-cad, green) and CD44 (red) (40x).
Cancer cells that retain stemness have been shown to be efficiently and aggressively metastatic [16, 18, 19]. Understanding the mechanisms that contribute to this aggressive and frankly invasive state is critical for future treatment strategies seeking to impede the metas-tatic process. To examine this property in the highly invasive E-cad+ DU145 and PC3 cells, we collected E-cad+ and E-cad- cells that had invaded through the membrane of Matrigelcoated invasion chambers and cultured these cells under adherent or non-adherent conditions.
After 3 days of culture under adherent conditions, invaded E-cad+ cells efficiently proliferated (Figure 1B) and formed colonies of holoclonal-type morphology (Figure 1C-a and b), which is one of the stem cell characteristics previously demonstrated in DU145 and PC3 cells [20, 21]. These holoclonal cells from E-cad+prostate stem cells exhibited high levels of E-cadherin expression (Figure 1C-c and d). In contrast, E-cad- cells from both cell lines proliferated poorly after invasion (Figure 1C-e and f). Invaded DU145 and PC3 E-cad+cells cultured under non-adherent conditions efficiently formed spheroids (Figure 1D and E) and expressed both E-cadherin and the prostate cancer stem cell marker CD44 at high levels (Figure 1E-c and d). In contrast, E-cad-cells were unable to form spheroids (Figure 1D and E). These results indicated that E-cad+ cells retain their cancer stemness after invasion, while E-cad- cells, even those that did invade, failed to demonstrate stem cell characteristics.
E-cadherin expression can be modulated by E-cad+ cells during invasion
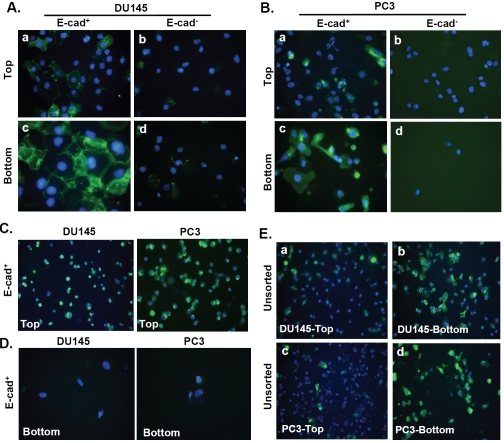
According to the E-cadherin literature, we expected E-cad+ cells to invade poorly and E-cad-cells to be highly invasive [22]. Instead, the robust invasion of E-cad+ cells was repeatedly observed. However, the mechanism by which E-cad+ cells successfully invaded remained unclear. To gain insights into this observation, we examined the E-cadherin expression levels of E-cad+ and E-cad-cells during the invasion process. At the end of a 24 h invasion period, the non-invaded cells E-cad+ cells residing in the top chamber (Figure 2A-a and 2B-a) exhibited decreased E-cadherin expression compared to the invaded E-cad+ cells on the underside of the membrane (Figure 2A-c and 2B-c). In contrast, neither the E-cad-cells remaining in the top chamber (Figure 2A-b and 2B-b) nor those that invaded exhibited E-cadherin staining (Figure 2A-d and 2B-d).
Figure 2.
Analysis of E-cadherin expression during invasion in E-cad+, E-cad- and unsorted DU145 and PC3 cells. (A) and (B) Images of E-cad+ and E-cad- DU145 and PC3 cells immunostained with E-cadherin antibody after 24 h of invasion. Duplicate Matrigel invasion chambers were used: one each for staining invaded (bottom chamber) and non-invaded (top chamber) cells. Cells that were not stained were removed from each insert. Non-invaded cells from plated E-cad+and E-cad- subpopulations of DU145 and PC3 cells stained on the upper face of the membrane are shown in A-a/b and B-a/b, respectively. Invaded cells from both cell subpopulations (DU145 and PC3) were stained on the underside of the membrane, as shown in A-c/d and B-c/d. Magnification, 40x. (C) After 1 h, E-cad+ cells in the top chamber (DU145; left panel, PC3; right panel) were stained for E-cadherin (10x). (D) After 4 h, invaded E-cad+ cells at the bottom of the membrane (DU145; left panel, PC3; right panel) were stained for E-cadherin (40x). (E) Top-chamber (a and c) or invaded (b and d) unsorted DU145 and PC3 cells respectively were immunostained with an E-cadherin antibody at the conclusion of a 24 h invasion assay.
To confirm that altered E-cadherin expression was concomitant with progressive invasion, sorted E-cad+ DU145 and PC3 cells residing in the top chamber or underside of the membrane were stained with an E-cadherin antibody either 1 hour or 4 hours after initiating invasion. While the majority of E-cad+ cells in the top invasion chamber exhibited extensive and largely uniform E-cadherin expression at the beginning of invasion (Figure 2C), cells that invaded through the Matrigel and emerged at the underside of the membrane 4 h later were completely devoid of E-cadherin expression (Figure 2D). These findings implied that E-cad+ cells can functionally modulate membrane E-cadherin expression during invasion. Consistent with this hypothesis, a greater proportion of unsorted DU145 and PC3 cells expressing E-cadherin were found on the underside of the membrane at the end of a 24 h invasion period (Figure 2E-b and d) compared to the number of cells residing on the top side of the membrane (Figure 2E-a and c). Taken together, these observations suggested that E-cad+ cells capable of invading maintain a high invasive capacity by altering E-cadherin expression.
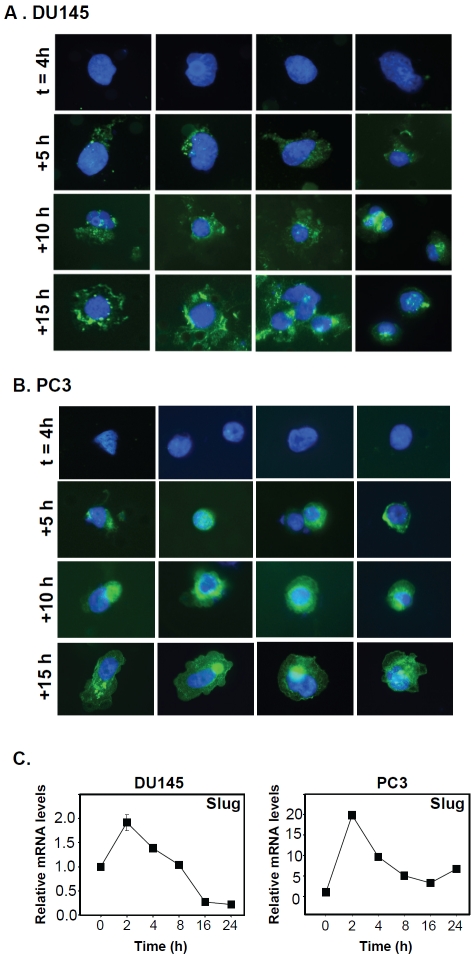
To further confirm the changes in surface E-cadherin expression during cellular invasion of E-cad+ prostate cancer cells, we characterized the time course of E-cadherin expression throughout invasion. Four hours after setting up E-cad+ cells in invasion assays, cells residing in the top chamber were removed. Invaded cells on the underside of the membrane were either stained immediately with E-cadherin antibody (t = 4 h) or incubated for additional time periods (5, 10 or 15 h) prior to staining. Invaded E-cad+ DU145 and PC3 cells initially (t = 4 h) did not express E-cadherin, began to re-express E-cadherin 5 h later, and showed progressively increasing E-cadherin expression thereafter (Figure 3A and B). These findings suggested that during the course of invasion, the E-cad+ subpopulation effectively modulated E-cadherin expression in a time-dependent manner.
Figure 3.
Modulation of E-cadherin and Slug expression in E-cad+ cells during invasion. (A) and (B) Invaded E-cad+ cells immunostained for E-cadherin. After 4 h of culture (t=4 h), top-chamber (non-invaded) cells were removed, and the invasion chambers were incubated for an additional 5, 10, or 15 h. At each time point, DU145 (A) and PC3 (B) cells were immunostained for E-cadherin. Magnification, 40x. (C) The relative Slug expression levels in E-cad+ cells from DU145 and PC3 cells residing in the top chambers of invasion assays were evaluated by qPCR at various time points (0, 2, 4, 8,16 and 24 h). Expression levels were normalized to actin. The data are reported as the mean ± SD.
The E-cadherin repressor protein Slug participates in E-cadherin modulation during invasion in E-cad+ cells
To examine the mechanism of E-cadherin modulation observed in DU145 and PC3 E-cad+ cells, E-cad+ cells from each cell line were plated in the top invasion chamber and analyzed at various times (0, 2, 4, 8, 16 and 24 h) for the expression of E-cadherin and the E-cadherin repressors Slug and Snail [23, 24]. No significant changes in Snail expression were observed (data not shown). However, Slug expression increased sharply at 2 h in each cell line (Figure 3C); in particular, the PC3 cells exhibited an approximately 20-fold increase in Slug expression (Figure 3C). Furthermore, Slug expression levels fell dramatically at later time points, consistent with invasion time-course experiments demonstrating that invaded E-cad+ cells first appear in the bottom chamber 4 h after plating (Figure 3A and B). These findings suggested that Slug abrogates E-cadherin transcription at early times during prostate cancer stem cell invasion, which is consistent with a recent report implicating Slug in the regulation of invasiveness of metastatic prostate cancer cell lines [25]. Upon examination of E-cad” cells from the DU145 and PC3 cell lines, we confirmed that these cellular subpopulations were non-invasive despite high expression of EMT markers such as Slug, Snail, and Vimentin compared to E-cad+ cells (Figure 4A and B). These results are consistent with the current paradigm of E-cadherin expression and EMT, in which the loss of E-cadherin expression is inversely related to the expression of Slug, Snail, and Vimentin. This finding suggests that although E-cad- prostate cancer cells display what is commonly referred to as the mesenchymal phenotype, characterized by low E-cadherin and high Slug, Snail, and Vimentin expression [5], this cellular subpopulation cannot drive cellular invasion without possessing key genomic cancer stem cell properties. Therefore, we hypothesized that the modulation of surface E-cadherin expression acts as a permissive factor for cells already capable of invading; in other words, E-cad+ cells that display the stem cell signature—high expression of OCT3/4 or SOX2—have robust cellular invasion that is driven by these stem cell markers.
Figure 4.
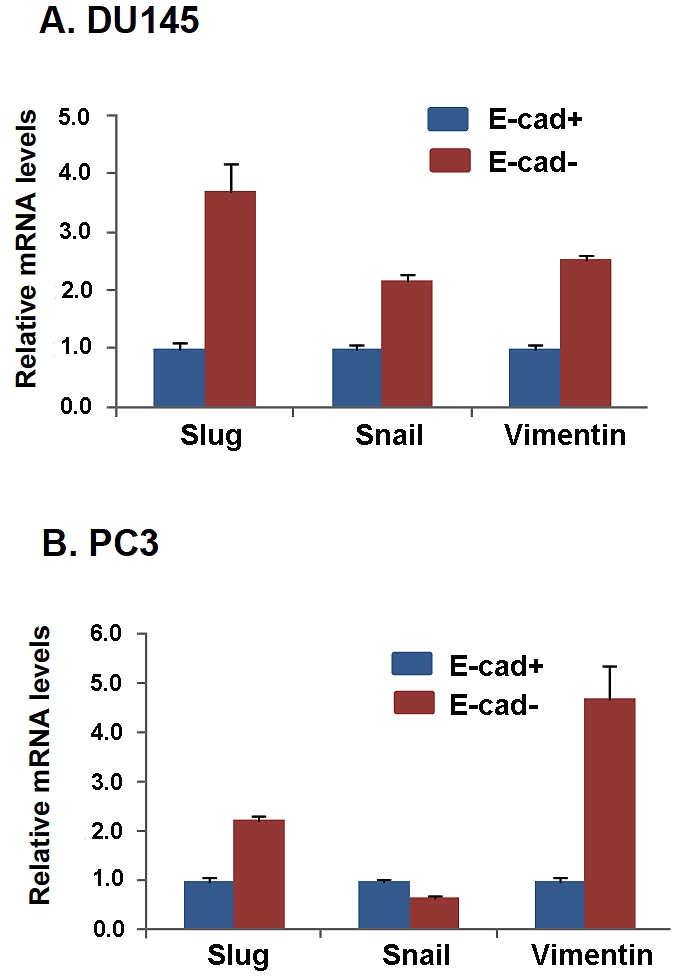
Difference of expression levels of Slug, Snail and Vimentin between E-cad+and E-cad- cells isolated from parental DU145 and PC3 cells. Both E-cad+ and E-cad- DU145 (A) and PC3 (B) cells were analyzed for expression levels of Slug, Snail, and Vimentin by qPCR. Expression levels were normalized to actin. The data are reported as the mean ± SD.
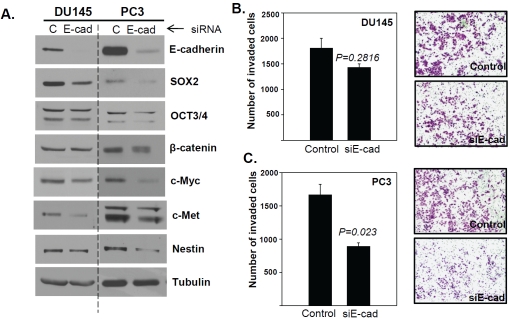
To test this possibility, we examined whether targeted knockdown of E-cadherin affected the invasion of parental DU145 and PC3 cells. We had already observed that the E-cad-cells were poorly invasive; therefore, E-cadherin knockdown in the parental population effectively targeted E-cad+ cells. We hypothesized that a reduction in E-cadherin expression, functionally mimicking Slug activity, would increase the invasive capacity of this cell line. Contrary to our expectations, we consistently observed the opposite results in PC3 cells: siRNA-mediated E-cadherin knockdown (Figure 5A, right panel) significantly reduced the invasive capacity of these cells compared to control cells (Figure 5C). However, in this cell line, efficient E-cadherin knockdown also resulted in markedly reduced levels of the embryonic stem cell markers SOX2, OCT3/4 and c-Myc, as well as β-catenin [26], c-Met [27] and Nestin [28], which are known to be involved in cancer stemness and cellular invasiveness (Figure 5A, right panel). In contrast, DU145 cells with efficient E-cadherin knockdown (Figure 5A, left panel) did not display either significantly reduced cellular invasion (Figure 5B) or reduced expression of SOX2, OCT3/4, c-Myc, β-catenin and Nestin, with the exception of c-Met (Figure 5A, left panel). These results suggested that E-cadherin expression may affect the expression of SOX2 and OCT3/4, as observed in PC3 cells (Figure 5A), thereby reducing embryonic stem cell marker-driven invasion (Figure 5C). However, in the absence of efficient knockdown of these embryonic stem cell markers, E-cadherin knockdown was not sufficient to significantly reduce cellular invasion (Figure 5A, left panel; 5B), demonstrating that the down-regulation of E-cadherin alone is not sufficient to allow cellular invasion.
Figure 5.
E-cadherin knockdown is insufficient to drive cellular invasion. (A) Immunoblot analysis of E-cadherin, SOX2, OCT3/4, β-catenin, c-Myc, c-Met, Nestin, and tubulin as a loading control. (B) and (C) The number of DU145 and PC3 cells invading through Matrigel-coated membranes after transient transfection with E-cadherin or control siRNA. All invasion assays were performed in triplicate.
Knockdown of OCT3/4 or SOX2 inhibits cell invasion
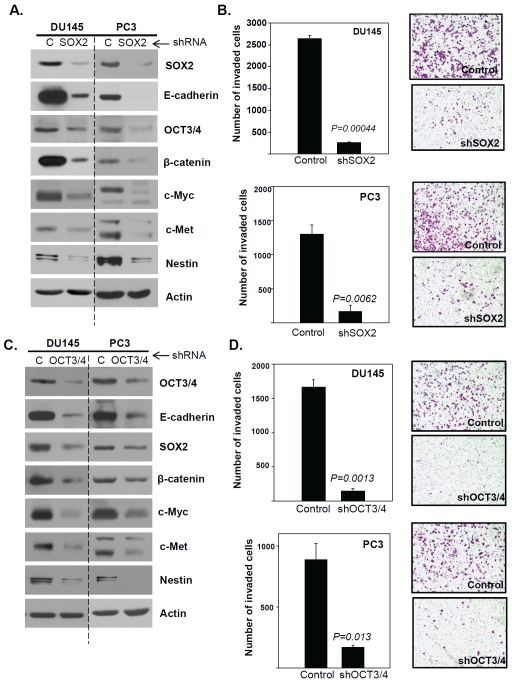
To evaluate the role of embryonic stem cell markers in prostate cancer stem cell invasion, we examined whether targeted knockdown of OCT3/4 or SOX2 affected the invasion of parental DU145 and PC3 cells. As shown in Figure 6, targeted knockdown of the embryonic stem cell factors SOX2 (Figure 6A) or OCT3/4 (Figure 6C) resulted in significantly reduced levels of E-cadherin, β-catenin, c-Myc, c-Met and Nestin, as well as a statistically significant reduction in cellular invasion (Figure 6B and D), demonstrating that the expression of one or more of these embryonic stem cell markers is required for invasion. Significantly, targeted knockdown of OCT3/4 or SOX2 in the DU145 and PC3 cell lines resulted in reduced E-cadherin expression, thereby confirming that the loss of E-cadherin expression is insufficient to drive cellular invasion.
Figure 6.
Knockdown of OCT3/4 or SOX2 inhibits prostate cancer cell invasion. (A) Western blot analyses of E-cadherin, SOX2, OCT3/4, β-catenin, c-Myc, c-Met and Nestin in shSOX2-knockdown DU145 and PC3 cells compared to control-shRNA knockdown cells. Actin was used as a loading control. (B) Invasion of DU145 and PC3 cells with targeted SOX2 knockdown compared to cells transfected with control shRNA. (C) Western blot analyses of E-cadherin, SOX2, OCT3/4, β-catenin, c-Myc, c-Met and Nestin in shOCT3/4 DU145 and PC3 cells compared to control knockdown cells. Actin was used as a loading control. (D) Invasion of DU145 and PC3 cells with targeted knockdown of OCT3/4, compared to control shRNA.
Discussion
Characterization of the cancer stem cell population remains a controversial issue. Because of the diverse etiologies of tumor types that arise in organs, the related cancer stem cell marker subset appears to depend on the microenvironment in which these cells arise. Although many studies have examined the cancer stem cell marker profiles derived from primary and cultured tumor cell populations, little consensus exists concerning the definition of this elusive cell subpopulation. The expression of the embryonic stem cell markers SOX2, OCT3/4, and Nanog results in a highly plastic, dedifferentiated and tumor-initiating stem cell phenotype [29]. Cell surface markers such as CD133 and CD44 have also been used extensively, although their expression appears to be cell type-specific [30]. While it is clear that enriched cancer stem-like cell populations form tumors with a high degree of efficiency when injected into SCID mice, few studies have examined the invasive properties of these cells. Recently, it has been reported that CD133+ pancreatic cancer cells [18], CD44+CD24- breast cancer cells [31] and CD44+ prostate cancer cells were more invasive than their non-stem-like counterparts [19]. The present study characterized the invasive ability of high SOX2- and OCT3/4-expressing prostate cancer stem cells, and the role of E-cadherin modulation in this process.
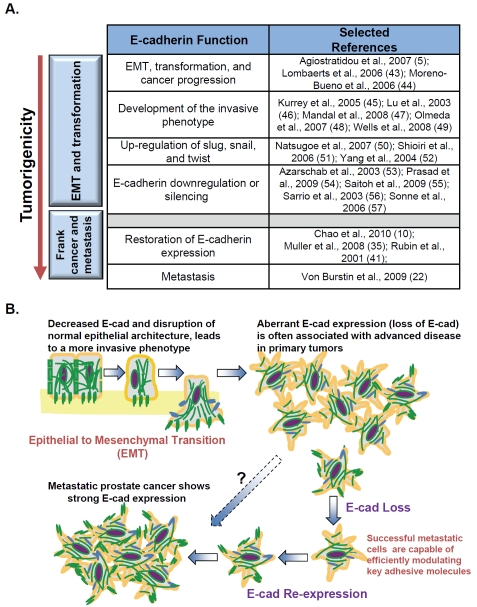
The process of Epithelial to Mesenchymal Transition, or EMT, is essential for development and is an important part of neoplastic transformation [32, 33]. The EMT program involves the initiation of a genetic and epigenetic program resulting in the transition from an epithelial to a mesenchymal or fibroblastic phenotype, and is a complex process that remains poorly understood. A process termed the cadherin switch has been described, in which E-cadherin-expressing epithelial cells begin to down-regulate E-cadherin and up-regulate the mesenchymal cell marker N-cadherin, has been well documented during the EMT process in vitro. A large portion of the literature examining the significance of E-cadherin expression (Figure 7A) suggests that E-cadherin expression is positively correlated with cancer patient prognosis [34]. However, not all studies concur. Indeed there is mounting evidence of high expression or re-expression of E-cadherin in advanced metastatic tumors that may serve as a marker for tumor recurrence [10, 35]. In prostate cancer, compared to the molecular profiles of the primary neoplastic lesions, E-cadherin has been shown to be re-expressed in advanced disease [23] and in metastases [24]. The mechanism responsible for the re-expression of E-cadherin in advanced disease and metastases is not clear. To our knowledge, the present study is the first to propose a mechanism that may reconcile early E-cadherin silencing and late-stage E-cadherin involvement in prostate cancer invasion.
Figure 7.
Proposed role of E-cadherin modulation in prostate cancer cell invasion. (A) Selected literature examining the role of E-cadherin in progressive tumor formation (EMT and transformation) as well as in the development of the aggressive and frankly metastatic phenotype (5, 10, 22, 35, 41, 43-57). (B) Schema of the modulation of E-cadherin expression in the post-epithelial to mesenchymal (post-EMT) acquisition of the aggressive phenotype. E-cadherin is indicative of the pre-EMT state. Parental DU145 and PC3 cells, which exhibit a mixed-marker EMT phenotype, are believed to have already undergone EMT and normally express E-cadherin at relatively low levels. Highly metastatic lesions arising from primary prostate tumors, but not the primary tumors themselves, exhibit high levels of E-cadherin. The present proposed mechanism for post-EMT upregulation of E-cadherin is that plasticity of E-cadherin expression is a permissive factor for cellular invasion, but requires expression of the embryonic stem cell markers SOX2 and OCT3/4.
Our data indicate that the E-cad+ prostate cancer cell subpopulation displayed the characteristics associated with cancer stem cells (Figure 1, Ref [15]), while the E-cad- subpopulation lacked these features (Figure 1, Ref [15]). Our finding that the stem cell subpopulation is highly invasive would seem intuitively obvious but that this population strongly expresses E-cadherin is not. Indeed this result appears to be in conflict with reports indicating loss of E-cadherin expression to be associated with increased invasion [5, 29]. However, the relationship between E-cadherin and cell invasion is controversial and far from clear. For example, in the same prostate cancer cell line (DU145), E-cadherin knock-down has been paradoxically reported to increase [36] and not increase [37] invasion and migration. Furthermore, while the agent luteolin was shown to inhibit PC3 cell invasion through E-cadherin modulation [38], an E-cadherin neutralizing antibody had no effect on DU145 cell invasion [39]. The present data indicate that E-cad+ prostate cancer stem cells exhibit plasticity of E-cadherin expression during the dynamic process of cell invasion. Indeed, the present time-course studies of E-cadherin expression of invading E-cad+ cells, in which cells invade after activation of the E-cadherin repressor Slug, and once invaded, are totally devoid of E-cadherin (Figure 3), are not inconsistent with published studies describing E-cadherin as an anti-invasive factor [34]. Our results therefore suggest that the ability to modulate E-cadherin, rather than the absolute levels of E-cadherin expression, may be a more reliable indicator of cancer cell stemness and invasive capacity.
We propose that the acquisition, or re-acquisition, of E-cadherin protein expression in DU145 and PC3 prostate cancer cells is a post-EMT process, and is required for the progression to an invasive phenotype (Figure 7B). E-cadherin is highly expressed in various types of metastatic lesions [22, 40, 41], but the mechanism of E-cadherin re-expression in these cancer cells remains poorly understood. Because the DU145 and PC3 cells exhibit a mixed EMT phenotype and are believed to have already undergone EMT [42], these cells display both epithelial and mesenchymal markers and do not fit into the conventional EMT molecular profiles. Consistent with those studies, we observed that the mesenchymal markers Slug, Snail, and Vimentin were expressed both in the parental DU145 and PC3 cells and at high levels in E-cad ? cells when compared to E-cad+ cells (Figure 4). E-cad- DU145 and PC3 cells represent non-invasive subpopulations, indicating that low E-cadherin expression and high Slug, Snail, and Vimentin expression are not sufficient to constitute an invasive phenotype. Rather, successful invasion requires the stemness signature; expression of SOX2 or OCT3/4, along with plasticity of E-cadherin expression, suggesting that E-cad+ cells are the subset of cells retaining stem-cell functionality, and are therefore able to form metastatic colonies at distant sites.
In summary, the events we described in the present study occurred after the EMT-like process, and not as part of EMT itself. The post-EMT evolution of a tumor into frank aggressive neo-plasia appears to involve the emergence and perhaps the enrichment of a highly invasive E-cad+ cell subpopulation. In addition to the expression of embryonic stem cell markers SOX2 and OCT3/4, the ability of this tumor cell sub-population to modulate E-cadherin expression should be considered an indicator of prostate cancer stemness. Therefore, the regulation of E-cadherin plasticity may be a target for novel therapies designed to interfere with the metastatic dissemination of cancer stem cells.
Acknowledgments
We are grateful to Steve McClellan and the University of Florida Shands Cancer Center Flow Cytometry Core for support and assistance with FACS sorting.
References
- 1.Arya M, Bott SR, Shergill IS, Ahmed HU, William son M, Patel HR. The metastatic cascade in prostate cancer. Surg Oncol. 2006;15:117–128. doi: 10.1016/j.suronc.2006.10.002. [DOI] [PubMed] [Google Scholar]
- 2.Jemal A, Siegel R, Ward E, Hao Y, Xu J, Thun MJ. Cancer statistics, 2009. CA Cancer J Clin. 2009;59:225–249. doi: 10.3322/caac.20006. [DOI] [PubMed] [Google Scholar]
- 3.Rassweiler J, Schulze M, Teber D, Marrero R, Seemann O, Rumpelt J, Frede T. Laparo-scopic radical prostatectomy with the Heilbronn technique: oncological results in the first 500 patients. J Urol. 2005;173:761–764. doi: 10.1097/01.ju.0000153486.94741.e5. [DOI] [PubMed] [Google Scholar]
- 4.Coleman RE. Clinical features of metastatic bone disease and risk of skeletal morbidity. Clin Cancer Res. 2006;12:6243s–6249s. doi: 10.1158/1078-0432.CCR-06-0931. [DOI] [PubMed] [Google Scholar]
- 5.Agiostratidou G, Hulit J, Phillips GR, Hazan RB. Differential cadherin expression: potential markers for epithelial to mesenchymal transformation during tumor progression. J Mammary Gland Biol Neoplasia. 2007;12:127–133. doi: 10.1007/s10911-007-9044-6. [DOI] [PubMed] [Google Scholar]
- 6.Sharma S, Lichtenstein A. Aberrant splicing of the E-cadherin transcript is a novel mechanism of gene silencing in chronic lymphocytic leukemia cells. Blood. 2009;114:4179–4185. doi: 10.1182/blood-2009-03-206482. [DOI] [PMC free article] [PubMed] [Google Scholar]
- 7.Mayer B, Johnson JP, Leitl F, Jauch KW, Heiss MM, Schildberg FW, Birchmeier W, Funke I. E-cadherin expression in primary and metastatic gastric cancer: down-regulation correlates with cellular dedifferentiation and glandular disintegration. Cancer Res. 1993;53:1690–1695. [PubMed] [Google Scholar]
- 8.Mitselou A, Batistatou A, Nakanishi Y, Hirohashi S, Vougiouklakis T, Charalabopoulos K. Comparison of the dysadherin and E-cadherin expression in primary lung cancer and metastatic sites. Histol Histopathol. 2010;25:1257–1267. doi: 10.14670/HH-25.1257. [DOI] [PubMed] [Google Scholar]
- 9.De Marzo AM, Knudsen B, Chan-Tack K, Epstein JI. E-cadherin expression as a marker of tumor aggressiveness in routinely processed radical prostatectomy specimens. Urology. 1999;53:707–713. doi: 10.1016/s0090-4295(98)00577-9. [DOI] [PubMed] [Google Scholar]
- 10.Chao YL, Shepard CR, Wells A. Breast carcinoma cells re-express E-cadherin during mesenchymal to epithelial reverting transition. Mol Cancer. 2010;9:179–196. doi: 10.1186/1476-4598-9-179. [DOI] [PMC free article] [PubMed] [Google Scholar]
- 11.Paredes J, Correia AL, Ribeiro AS, Milanezi F, Cameselle-Teijeiro J, Schmitt FC. Breast carcinomas that co-express E- and P-cadherin are associated with p120-catenin cytoplasmic localisation and poor patient survival. J Clin Pathol. 2008;61:856–862. doi: 10.1136/jcp.2007.052704. [DOI] [PubMed] [Google Scholar]
- 12.Hudson LG, Zeineldin R, Stack MS. Pheno-typic plasticity of neoplastic ovarian epithelium: unique cadherin profiles in tumor progression. Clin Exp Metastasis. 2008;25:643–655. doi: 10.1007/s10585-008-9171-5. [DOI] [PMC free article] [PubMed] [Google Scholar]
- 13.Chao YL, Shepard CR, Wells A. Breast carcinoma cells re-express E-cadherin during mesenchymal to epithelial reverting transition. Mol Cancer. 2010;9:179–196. doi: 10.1186/1476-4598-9-179. [DOI] [PMC free article] [PubMed] [Google Scholar]
- 14.Farias EF, Petrie K, Leibovitch B, Murtagh J, Chornet MB, Schenk T, Zelent A, Waxman S. Interference with Sin3 function induces epi-genetic reprogramming and differentiation in breast cancer cells. Proc Natl Acad Sci U S A. 2010;107:11811–11816. doi: 10.1073/pnas.1006737107. [DOI] [PMC free article] [PubMed] [Google Scholar]
- 15.Bae KM, Su Z, Frye C, McClellan S, Allan RW, Andrejewski JT, Kelley V, Jorgensen M, Steindler DA, Vieweg J, Siemann DW. Expression of pluripotent stem cell reprogramming factors by prostate tumor initiating cells. J Urol. 2010;183:2045–2053. doi: 10.1016/j.juro.2009.12.092. [DOI] [PMC free article] [PubMed] [Google Scholar]
- 16.Hermann PC, Huber SL, Herrler T, Aicher A, Ellwart JW, Guba M, Bruns CJ, Heeschen C. Distinct populations of cancer stem cells determine tumor growth and metastatic activity in human pancreatic cancer. Cell Stem Cell. 2007;1:313–323. doi: 10.1016/j.stem.2007.06.002. [DOI] [PubMed] [Google Scholar]
- 17.Prince ME, Sivanandan R, Kaczorowski A, Wolf GT, Kaplan MJ, Dalerba P, Weissman IL, Clarke MF, Ailles LE. Identification of a subpopulation of cells with cancer stem cell properties in head and neck squamous cell carcinoma. Proc Natl Acad Sci U S A. 2007;104:973–978. doi: 10.1073/pnas.0610117104. [DOI] [PMC free article] [PubMed] [Google Scholar]
- 18.Moriyama T, Ohuchida K, Mizumoto K, Cui L, Ikenaga N, Sato N, Tanaka M. Enhanced cell migration and invasion of CD133+ pancreatic cancer cells cocultured with pancreatic stromal cells. Cancer. 2010;116:3357–3368. doi: 10.1002/cncr.25121. [DOI] [PubMed] [Google Scholar]
- 19.Klarmann GJ, Hurt EM, Mathews LA, Zhang X, Duhagon MA, Mistree T, Thomas SB, Farrar WL. Invasive prostate cancer cells are tumor initiating cells that have a stem cell-like genomic signature. Clin Exp Metastasis. 2009;26:433–446. doi: 10.1007/s10585-009-9242-2. [DOI] [PMC free article] [PubMed] [Google Scholar]
- 20.Locke M, Heywood M, Fawell S, Mackenzie IC. Retention of intrinsic stem cell hierarchies in carcinoma-derived cell lines. Cancer Res. 2005;65:8944–8950. doi: 10.1158/0008-5472.CAN-05-0931. [DOI] [PubMed] [Google Scholar]
- 21.Li H, Chen X, Calhoun-Davis T, Claypool K, Tang DG. PC3 human prostate carcinoma cell holoclones contain self-renewing tumor-initiating cells. Cancer Res. 2008;68:1820–1825. doi: 10.1158/0008-5472.CAN-07-5878. [DOI] [PubMed] [Google Scholar]
- 22.von Burstin J, Eser S, Paul MC, Seidler B, Brandl M, Messer M, von Werder A, Schmidt A, Mages J, Pagel P, Schnieke A, Schmid RM, Schneider G, Saur D. E-cadherin regulates metastasis of pancreatic cancer in vivo and is suppressed by a SNAIL/HDAC1/HDAC2 repressor complex. Gastroenterology. 2009;137:361–371. doi: 10.1053/j.gastro.2009.04.004. 371e361-365. [DOI] [PubMed] [Google Scholar]
- 23.Batlle E, Sancho E, Franci C, Dominguez D, Monfar M, Baulida J, Garcia De Herreros A. The transcription factor snail is a repressor of E-cadherin gene expression in epithelial tumour cells. Nat Cell Biol. 2000;2:84–89. doi: 10.1038/35000034. [DOI] [PubMed] [Google Scholar]
- 24.Bolos V, Peinado H, Perez-Moreno MA, Fraga MF, Esteller M, Cano A. The transcription factor Slug represses E-cadherin expression and induces epithelial to mesenchymal transitions: a comparison with Snail and E47 repressors. J Cell Sci. 2003;116:499–511. doi: 10.1242/jcs.00224. [DOI] [PubMed] [Google Scholar]
- 25.Emadi Baygi M, Soheili ZS, Essmann F, Deezagi A, Engers R, Goering W, Schulz WA. Slug/ SNAI2 regulates cell proliferation and invasive-ness of metastatic prostate cancer cell lines. Tumour Biol. 2010;31:297–307. doi: 10.1007/s13277-010-0037-5. [DOI] [PubMed] [Google Scholar]
- 26.Bisson I, Prowse DM. WNT signaling regulates self-renewal and differentiation of prostate cancer cells with stem cell characteristics. Cell Res. 2009;19:683–697. doi: 10.1038/cr.2009.43. [DOI] [PubMed] [Google Scholar]
- 27.Boccaccio C, Comoglio PM. Invasive growth: a MET-driven genetic programme for cancer and stem cells. Nat Rev Cancer. 2006;6:637–645. doi: 10.1038/nrc1912. [DOI] [PubMed] [Google Scholar]
- 28.KleebergerW, Bova GS, Nielsen ME, Herawi M, Chuang AY, Epstein JI, Berman DM. Roles for the stem cell associated intermediate filament Nestin in prostate cancer migration and metastasis. Cancer Res. 2007;67:9199–9206. doi: 10.1158/0008-5472.CAN-07-0806. [DOI] [PMC free article] [PubMed] [Google Scholar]
- 29.Schoenhals M, Kassambara A, De Vos J, Hose D, Moreaux J, Klein B. Embryonic stem cell markers expression in cancers. Biochem Biophys Res Commun. 2009;383:157–162. doi: 10.1016/j.bbrc.2009.02.156. [DOI] [PubMed] [Google Scholar]
- 30.Al-Hajj M, Clarke MF. Self-renewal and solid tumor stem cells. Oncogene. 2004;23:7274–7282. doi: 10.1038/sj.onc.1207947. [DOI] [PubMed] [Google Scholar]
- 31.Sheridan C, Kishimoto H, Fuchs RK, Mehrotra S, Bhat-Nakshatri P, Turner CH Goulet R Jr., Badve S., Nakshatri H. CD44+/CD24- breast cancer cells exhibit enhanced invasive properties: an early step necessary for metastasis. Breast Cancer Res. 2006;8:R59. doi: 10.1186/bcr1610. [DOI] [PMC free article] [PubMed] [Google Scholar]
- 32.Peinado H, Portillo F, Cano A. Transcriptional regulation of cadherins during development and carcinogenesis. Int J Dev Biol. 2004;48:365–375. doi: 10.1387/ijdb.041794hp. [DOI] [PubMed] [Google Scholar]
- 33.Huber MA, Kraut N, Beug H. Molecular requirements for epithelial-mesenchymal transition during tumor progression. Curr Opin Cell Biol. 2005;17:548–558. doi: 10.1016/j.ceb.2005.08.001. [DOI] [PubMed] [Google Scholar]
- 34.Gravdal K, Halvorsen OJ, Haukaas SA, Akslen LA. A switch from E-cadherin to N-cadherin expression indicates epithelial to mesenchymal transition and is of strong and independent importance for the progress of prostate cancer. Clin Cancer Res. 2007;13:7003–7011. doi: 10.1158/1078-0432.CCR-07-1263. [DOI] [PubMed] [Google Scholar]
- 35.Muller S, Su L, Tighiouart M, Saba N, Zhang H, Shin DM, Chen ZG. Distinctive E-cadherin and epidermal growth factor receptor expression in metastatic and nonmetastatic head and neck squamous cell carcinoma: predictive and prognostic correlation. Cancer. 2008;113:97–107. doi: 10.1002/cncr.23557. [DOI] [PubMed] [Google Scholar]
- 36.Syed V, Mak P, Du C, Balaji KC. Beta-catenin mediates alteration in cell proliferation, motility and invasion of prostate cancer cells by differential expression of E-cadherin and protein kinase D1. J Cell Biochem. 2008;104:82–95. doi: 10.1002/jcb.21603. [DOI] [PMC free article] [PubMed] [Google Scholar]
- 37.Kumper S, Ridley AJ. p120ctn and P-cadherin but not E-cadherin regulate cell motility and invasion of DU145 prostate cancer cells. PLoS One. 2010;5:e11801. doi: 10.1371/journal.pone.0011801. [DOI] [PMC free article] [PubMed] [Google Scholar]
- 38.Zhou Q, Yan B, Hu X, Li XB, Zhang J, Fang J. Luteolin inhibits invasion of prostate cancer PC3 cells through E-cadherin. Mol Cancer Ther. 2009;8:1684–1691. doi: 10.1158/1535-7163.MCT-09-0191. [DOI] [PubMed] [Google Scholar]
- 39.Chunthapong J, Seftor EA, Khalkhali-Ellis Z, Seftor RE, Amir S, Lubaroff DM, Heidger PM Jr, Hendrix MJ. Dual roles of E-cadherin in prostate cancer invasion. J Cell Biochem. 2004;91:649–661. doi: 10.1002/jcb.20032. [DOI] [PubMed] [Google Scholar]
- 40.Imai T, Horiuchi A, Shiozawa T, Osada R, Kikuchi N, Ohira S, Oka K, Konishi I. Elevated expression of E-cadherin and alpha-, beta-, and gamma-catenins in metastatic lesions compared with primary epithelial ovarian carcinomas. Hum Pathol. 2004;35:1469–1476. doi: 10.1016/j.humpath.2004.09.014. [DOI] [PubMed] [Google Scholar]
- 41.Rubin MA, Mucci NR, Figurski J, Fecko A, Pienta KJ, Day ML. E-cadherin expression in prostate cancer: a broad survey using high-density tissue microarray technology. Hum Pathol. 2001;32:690–697. doi: 10.1053/hupa.2001.25902. [DOI] [PubMed] [Google Scholar]
- 42.Beach S, Tang H, Park S, Dhillon AS, Keller ET, Kolch W, Yeung KC. Snail is a repressor of RKIP transcription in metastatic prostate cancer cells. Oncogene. 2008;27:2243–2248. doi: 10.1038/sj.onc.1210860. [DOI] [PMC free article] [PubMed] [Google Scholar]
- 43.Lombaerts M, van Wezel T, Philippo K, Dierssen JW, Zimmerman RM, Oosting J, van Eijk R, Eilers PH, van de Water B, Cornelisse CJ, Cleton-Jansen AM. E-cadherin transcriptional downregulation by promoter methylation but not mutation is related to epithelial-to-mesenchymal transition in breast cancer cell lines. Br J Cancer. 2006;94:661–671. doi: 10.1038/sj.bjc.6602996. [DOI] [PMC free article] [PubMed] [Google Scholar]
- 44.Moreno-Bueno G, Cubillo E, Sarrio D, Peinado H, Rodriguez-Pinilla SM, Villa S, Bolos V, Jorda M, Fabra A, Portillo F, Palacios J, Cano A. Genetic profiling of epithelial cells expressing E-cadherin repressors reveals a distinct role for Snail, Slug, and E47 factors in epithelial-mesenchymal transition. Cancer Res. 2006;66:9543–9556. doi: 10.1158/0008-5472.CAN-06-0479. [DOI] [PubMed] [Google Scholar]
- 45.Kurrey NK, K A, Bapat SA. Snail and Slug are major determinants of ovarian cancer invasiveness at the transcription level. Gynecol Oncol. 2005;97:155–165. doi: 10.1016/j.ygyno.2004.12.043. [DOI] [PubMed] [Google Scholar]
- 46.Lu Z, Ghosh S, Wang Z, Hunter T. Down-regulation of caveolin-1 function by EGF leads to the loss of E-cadherin, increased transcriptional activity of beta-catenin, and enhanced tumor cell invasion. Cancer Cell. 2003;4:499–515. doi: 10.1016/s1535-6108(03)00304-0. [DOI] [PubMed] [Google Scholar]
- 47.Mandal M, Myers JN, Lippman SM, Johnson FM, Williams MD, Rayala S, Ohshiro K, Rosenthal DI, Weber RS, Gallick GE, El-Naggar AK. Epithelial to mesenchymal transition in head and neck squamous carcinoma: association of Src activation with E-cadherin down-regulation, vimentin expression, and aggressive tumor features. Cancer. 2008;112:2088–2100. doi: 10.1002/cncr.23410. [DOI] [PubMed] [Google Scholar]
- 48.Olmeda D, Jorda M, Peinado H, Fabra A, Cano A. Snail silencing effectively suppresses tumour growth and invasiveness. Oncogene. 2007;26:1862–1874. doi: 10.1038/sj.onc.1209997. [DOI] [PubMed] [Google Scholar]
- 49.Wells A, Yates C, Shepard CR. E-cadherin as an indicator of mesenchymal to epithelial reverting transitions during the metastatic seeding of disseminated carcinomas. Clin Exp Metastasis. 2008;25:621–628. doi: 10.1007/s10585-008-9167-1. [DOI] [PMC free article] [PubMed] [Google Scholar]
- 50.Natsugoe S, Uchikado Y, Okumura H, Matsumoto M, Setoyama T, Tamotsu K, Kita Y, Sakamoto A, Owaki T, Ishigami S, Aikou T. Snail plays a key role in E-cadherin-preserved esophageal squamous cell carcinoma. Oncol Rep. 2007;17:517–523. [PubMed] [Google Scholar]
- 51.Shioiri M, Shida T, Koda K, Oda K, Seike K, Nishimura M, Takano S, Miyazaki M. Slug expression is an independent prognostic parameter for poor survival in colorectal carcinoma patients. Br J Cancer. 2006;94:1816–1822. doi: 10.1038/sj.bjc.6603193. [DOI] [PMC free article] [PubMed] [Google Scholar]
- 52.Yang J, Mani SA, Donaher JL, Ramaswamy S, Itzykson RA, Come C, Savagner P, Gitelman I, Richardson A, Weinberg RA. Twist, a master regulator of morphogenesis, plays an essential role in tumor metastasis. Cell. 2004;117:927–939. doi: 10.1016/j.cell.2004.06.006. [DOI] [PubMed] [Google Scholar]
- 53.Azarschab P, Stembalska A, Loncar MB, Pfister M, Sasiadek MM, Blin N. Epigenetic control of E-cadherin (CDH1) by CpG methylation in metastasising laryngeal cancer. Oncol Rep. 2003;10:501–503. [PubMed] [Google Scholar]
- 54.Prasad CP, Rath G, Mathur S, Bhatnagar D, Parshad R, Ralhan R. Expression analysis of E-cadherin, Slug and GSK3beta in invasive ductal carcinoma of breast. BMC Cancer. 2009;9:325. doi: 10.1186/1471-2407-9-325. [DOI] [PMC free article] [PubMed] [Google Scholar]
- 55.Saitoh M, Shirakihara T, Miyazono K. Regulation of the stability of cell surface E-cadherin by the proteasome. Biochem Biophys Res Commun. 2009;381:560–565. doi: 10.1016/j.bbrc.2009.02.098. [DOI] [PubMed] [Google Scholar]
- 56.Sarrio D, Moreno-Bueno G, Hardisson D, Sanchez-Estevez C, Guo M, Herman JG, Gamallo C, Esteller M, Palacios J. Epigenetic and genetic alterations of APC and CDH1 genes in lobular breast cancer: relationships with abnormal E-cadherin and catenin expression and microsatellite instability. Int J Cancer. 2003;106:208–215. doi: 10.1002/ijc.11197. [DOI] [PubMed] [Google Scholar]
- 57.Sonne SB, Hoei-Hansen CE, Nielsen JE, Herlihy AS, Andersson AM, Almstrup K, Daugaard G, Skakkebaek NE, Leffers H, Rajpert-De Meyts E. CDH1 (E-cadherin) in testicular germ cell neoplasia: suppressed translation of mRNA in pre-invasive carcinoma in situ but increased protein levels in advanced tumours. Apmis. 2006;114:549–558. doi: 10.1111/j.1600-0463.2006.apm_445.x. [DOI] [PubMed] [Google Scholar]


