Abstract
In this study, we explore a mathematical model to characterize the clustered microcalcifications on mammograms for predicting the pathological classification and grading. Our database consists of both retrospective cases (78 cases) and prospective cases (31 cases) with pathologically diagnosed clusters of microcalcifications on mammograms. The microcalcifications were divided into four grades: grade 0, benign breast disease including mastopathies (n = 12) and fibroadenomas (n = 20); grade 1, well-differentiated infiltrating ductal carcinoma (n = 12); grade 2, moderately differentiated infiltrating ductal carcinoma (n = 38); grade 3, poorly differentiated infiltrating ductal carcinoma (n = 27). A feature parameter, defined as the pattern form factor of microcalcification cluster θ by us, combines five computer-extracted image parameters of microcalcification clusters of those mammograms. In every case, only one imaging was selected for modeling analysis. A total of 109 imagings were adopted in current study. We find the existence of a positive relationship between the feature parameter θ and pathological grading G of microcalcifications in retrospective cases, which was expressed as G = 6.438 + 1.186 × Ln <θ>. The model above has been verified further by the prospective study with a comparative evaluation accuracy of approximately 77.42%. The binary predication simply for both benignancy and malignancy was also included using same but reshuffled data, and the receiver operating characteristic (ROC) analysis was performed with ROC value 0.74351∼0.79891. As one candidate for feature parameter in computer-aided diagnosis, the pattern form factor θ of clustered microcalcifications may be useful to predict the pathological grading and classification of microcalcification clusters on mammography in breast cancer.
Keywords: Algorithms, computer-aided diagnosis (CAD), mammography CAD, breast diseases, clustered microcalcification detection
Introduction
Breast cancer is the most frequently diagnosed non-skin cancer in women and has become one of the leading causes of death in women over the age of 40 years [1, 2]. Early detection of breast cancer is vital to the prognostic outcome of treatment [3]. Currently, mammography is well accepted as the most convenient examination available for the detection of early signs of breast cancer; therefore, mammography screening has been recommended for women aged 40 and over [4–6].
Clustered microcalcifications are often an early sign of breast cancer but are not breast-cancer-specific. The characteristics of clustered microcalcifications are the main parameters for classifying lesions on mammograms. Analysis of microcalcifications is usually based on the radiologist’s subjective judgment; this process is sometimes difficult as well as inaccurate, resulting in many unnecessary breast biopsies performed on benign calcification clusters. Several articles have described computerized methods that extract features of clustered microcalcifications to improve radiologists’ performance in differentiating malignant from benign clustered microcalcifications [7–9]. To improve accuracy of identifying clustered microcalcification patterns through both computer-aided feature extraction and classification methods, it is worth developing mathematically a model or method, by which radiologists can evaluate quantitatively the difference between benign clustered microcalcification and its malignant counterpart. These methods include estimating the likelihood of malignancy by using an artificial neural network [7] or analyzing malignant and benign microcalcifications through various feature classifiers with morphologic and texture features [8]. Nakayama et al. [9] developed a computerized method for distinguishing between five different types of histological classifications: invasive carcinomas, noninvasive carcinomas of the comedo type, noninvasive carcinomas of the noncomedo type, mastopathies, and fibroadenomas. Nakayama et al. [9] also indicated that quantitative features can be extracted and analyzed by a computer not only for distinguishing malignant from benign clustered microcalcifications but also for classifying the histological subtype of breast cancer. Generally, these computer-aided analyses can help radiologists on their decisions with patient management.
In this study, we introduce a new feature parameter, defined as the pattern factor of microcalcification clusters and derived from the five specific computer-extracted image parameters in combination, which expresses a general texture feature of clustered microcalcifications and may serve as a discriminatory descriptor for the classification of microcalcification cluster. In order to correlate the texture feature of microcalcification clusters with the relevant pathological classification of patients, we analyzed systematically the retrospective cases of breast cancer and proposed a novel formula to mathematically model the relationship between the feature parameter and the histological classifications and grading. Our work aims not only at facilitating radiologists in identifying and assessing precisely the microcalcification clusters in their routine review of mammograms but also paving the way for a large-scale prospective analysis in mammography.
Materials and Methods
An institutional review board exemption was obtained to perform this retrospective study.
Materials
Clinical Cases
All of the mammograms were obtained from the cancer center of Sun Yat-sen University between year 2004 and 2008. A total of 109 mammographic images with histologically proven microcalcifications from 109 women patients, including 78 patients for the retrospective study and 31 patients for the prospective study, were selected for modeling analysis in this study. The selection criteria were that the mammograms contain a cluster of microcalcifications, and the histological classifications of the clustered microcalcifications were determined by open surgical biopsy and histological analysis. All of these cases were selected by experienced radiologists, without knowledge of the histological findings, on a basis of the criteria that a mammogram includes one clustered microcalcification. The mean age of these 109 women was 51 years (ranging from 35 to 69 years). Histological tissues were stained with hematoxylin and eosin, and the data were drawn from pathological reports that were made by two pathologists with 5 years of experience in breast disease. Of all breast cancer cases in the present material, the histological grading were assigned to poorly, intermediately, and well-differentiated categories according to the combined nuclear grade, tubule formation, and mitotic rates [10].
The first stage of the study was to define a morphologic feature parameter based upon a set of 78 digital mammograms showing a cluster of microcalcifications from 78 patients, including 54 patients with breast cancer and 24 patients with benign breast disease. All of the microcalcifications were divided into four grades according to the histopathologic type: grade 0, benign breast disease including mastopathies (n = 10) and fibroadenomas (n = 14); grade 1, well-differentiated infiltrating ductal carcinoma (n = 9); grade 2, moderately differentiated infiltrating ductal carcinoma (n = 27); grade 3, poorly differentiated infiltrating ductal carcinoma (n = 18).
For the sake of a prospective study to verify the effectiveness of our modeling analysis, we also selected, in a double-blind method, 31 digital mammograms at random from 31 patients who underwent surgery for clustered microcalcifications independently. The grades of the microcalcifications according to the histopathologic type in this set of data were as follows: grade 0, benign breast disease including mastopathies (n = 2) and fibroadenomas (n = 6); grade 1, well-differentiated infiltrating ductal carcinoma (n = 3); grade 2, moderately differentiated infiltrating ductal carcinoma (n = 11); grade 3, poorly differentiated infiltrating ductal carcinoma (n = 9).
Imaging Protocol
Bilateral mammograms were obtained by using a full-field digital mammographic system (Senographe DS; GE Medical Systems, Buc, France). All patients underwent a standard two-view examination (craniocaudal and mediolateral oblique mammograms) of each breast performed by an experienced radiologic technologist (we utilized five technologists with 5–15 years of experience). In total, there were 154 mammographic images from the 77 patients with breast cancer and 64 mammographic images from the 32 women with benign mammographic findings.
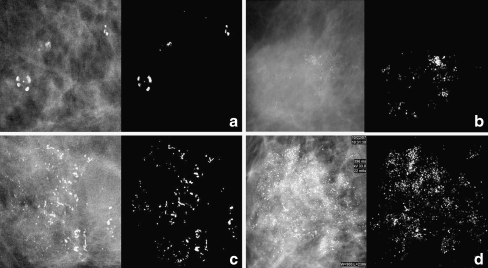
All mammograms were reviewed in consensus by two radiologists with 3–10 years of experience with breast imaging by using the Seno Advantage Review Workstation (GE Medical Systems, Buc, France). Only one image, with well-defined clustered microcalcification, was selected from each patient for modeling analysis. In total, 109 imagings were adopted in this study. Figure 1 displays four kinds of typical microcalcification images in our database that were pathologically classified as the benign Grade 0 and Grades 1, 2, 3 with increasing malignancy.
Fig. 1.
Representative images of four types of microcalcification clusters in our database which were pathologically classified as a grade 0 of a benign tumor and grades 1 (b), 2 (c), 3 (d) with increasing malignant tumors. Each image is presented in its original form (left) and in situ segmented form (right) of clustered microcalcification
Methodology
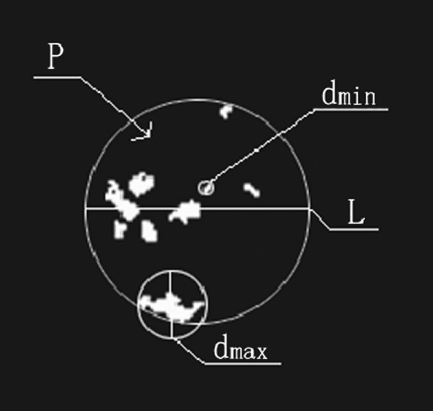
All original mammograms were processed using the leading commercial image analytical software Image Pro Plus (IPP) for biology and medicine in order to extract microcalcification spots precisely. The margin of clustered microcalcification was located and marked out automatically through filtering original mammograms, and then a clear and correct region of interest (ROI) was obtained by adjusting the segmenting threshold to a suitable value. We extracted the clustered microcalcifications from the original mammogram and transformed them into a high-fidelity dark-white image format. In this study, the pattern of microcalcification clusters marked out by software IPP on each mammogram was checked with the original mammogram and justified by both experienced radiologists and breast surgeons to ensure only true microcalcification clusters were involved in the analysis. We measured five specific image parameters of microcalcification clusters that are usually adopted by clinical radiologists in their routine diagnosis of breast lesions. The five image parameters of the ROI are described specifically as below: (1) the population density P of dispersive microcalcification spots within the ROI, (2) the smallest diameter of the outline L to encircle the margin of the clustered region of microcalcification spots, (3) the diameter dmax of the largest microcalcification spot within the ROI, (4) the diameter dmin of the smallest microcalcification spot inside the ROI, and (5) the mean diameter dmean ensemble averaging over all microcalcification spots of the ROI. Figure 2 presents specifically the schematics of the five image parameters. The measurements of the five image parameters were also performed using the software IPP.
Fig. 2.
The schematic illustration of specific feature parameters measured
We also defined, for the first time, a new feature parameter θ termed the microcalcification pattern form factor to characterize the general feature of clustered microcalcification patterns. Generally, the pattern feature of clustered microcalcification corresponds to a certain pathological grading G of breast tumor, and we attempted to correlate the feature parameter θ with the pathological grading G on a basis of either mathematical or statistical formulation. Based upon the abovementioned five specific image parameters, we measured and computed the microcalcification pattern form factor θ for each case of the 78 retrospective patients with carcinoma, mastopathy, and fibroadenoma using Eq. 1 (see below). The average value of the pattern form factor, <θ>, was calculated statistically when several specific clusters of microcalcification spots are involved within a mammogram, and the pathological grading Gp of retrospective patients was taken into account to derive, through a mathematical modeling approach, an equation of the parameter Gp versus <θ>. Least squares nonlinear fitting of multiple parameters was performed to relate the parameter Gp with <θ> statistically, as given in the Eq. 2. Listed below are the two equations that correlate the feature parameters <θ> with the pathological grading Gp of retrospective data best:
 |
1 |
 |
2 |
where both a and b are two regression constants, and Ln is the symbol of natural logarithm. It is necessary to specify the formulation of the pattern form factor θ that we defined in the Eq. 1. Considering mathematically the general morphological feature of clustered microcalcification spots as illustrated in Figure 2, we formulated Eq. 1 that could combine concisely the five specific image parameters and render down them into a univariate general feature parameter. Judged by the unit of measurement, furthermore, the parameters l, dmax, dmin, and dmean all are of a unit of length, and one can figure out from the Eq. 1 that the microcalcification pattern form factor θ actually maintains a unit of density similar to that of parameter P and owns a same connotation as P, although both of them are likely quite different in magnitude. Finally, the theoretical grading Gt could be determined after the microcalcification pattern form factor θ of a patient was measured and calculated by using Eqs. 1 and 2.
The mammograms of an additional 31 prospective cases were chosen at random in a double-blind fashion to make a preliminary verification for our modeling analysis derived from the preceding retrospective cases. The feature parameters of prospective cases were measured by the same procedure as specified above for the analysis of retrospective data, and the relevant microcalcification pattern form factor θ was calculated by Eq. 1 independently. The theoretical grading Gt was calculated by the Eq. 2, and the comparison between the theoretical grading Gt and pathological grading Gp was performed case by case. We should point out the difference between the Gt and Gp in terms of Eq. 2: the symbol G in the Eq. 2 stands for Gp when the microcalcification pattern form factor <θ> of retrospective data are used in the process of data fitting and mathematical modeling; however, the symbol G in the Eq. 2 denotes Gt if the microcalcification pattern form factor <θ> of prospective data are included and theoretical grading is expected from the computation of averaged microcalcification pattern form factor <θ> by Eq. 2.
The data processing and receiver operating characteristic (ROC) analysis were carried out using the software SPSS, and the relevant statistics are detailed in every plot. The area under the ROC curve (Az) was used as a summary index of evaluating accuracy.
Results
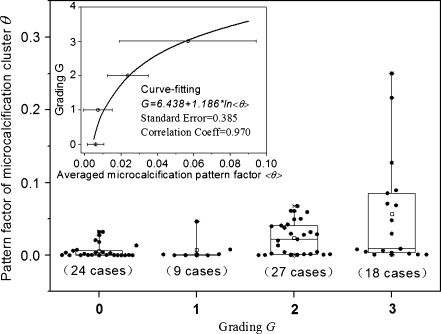
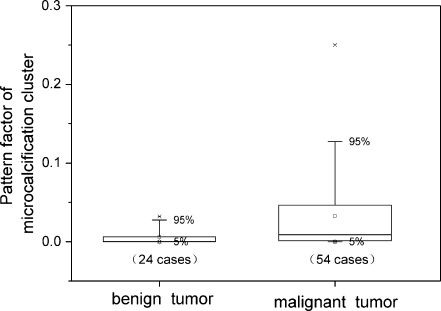
Figure 3 presents the original box-data overlap plot of 78 retrospective patients as well as the dependence of the patients’ histopathologic grading Gp on the averaged pattern form factor <θ> of microcalcification cluster. Generally, the pattern form factor value θ of malignant microcalcification was larger than the counterpart of benign microcalcification, but a considerable overlap between the malignant and benign microcalcification was also observed. Note that there is a fine direct dependence of the pathological grading Gp upon the averaged pattern form factor <θ>, formulated as G = 6.438 + 1.186 × Ln <θ> through the data-fitting of the retrospective data, which reflects to some extent the correlation between the feature parameters and histopathological grading. Statistically, a larger value of averaged pattern form factor <θ> corresponded to a higher grading G. The three lists of malignant data grading from 1 to 3 were reduced to a list of data of malignant tumors, and the original dataset was reshuffled in binary format simply as benign against malignant tumors. The binary plot of the reclassified dataset was displayed in Figure 4. In comparison with its benign counterpart, a malignant tumor has a higher and more dispersive pattern form factor θ, as shown in Figure 4.
Fig. 3.
The box-data overlap plot of original retrospective data (78 cases), and the outliers outside 95% confidence interval are marked. Inset the graphic dependence of pathological grading G upon the averaged microcalcification pattern factor <θ>. The curve is fitted to the retrospective data by the method of least squares nonlinear fit, and the pattern factorθ becomes larger as well as more dispersive with increasing grade G
Fig. 4.
Pattern factor of microcalcification cluster θ of 78 retrospective cases regraded into two groups (benign or malignant) of tumors
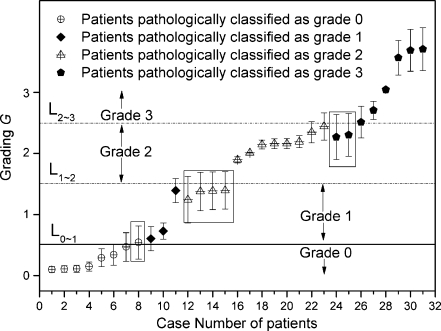
The theoretical grading Gt for the image feature parameter of 31 prospective patients was also assessed according to Eqs. 1 and 2, and Figure 5 compares directly the estimated theoretical grading results and the corresponding pathological grading. Nearly all data points pathologically classified as benign (grade 0) are situated below the solid line L0∼1 with G <0.5, which we refer to as the benign–malignant grading; data points pathologically classified as malignant grade 1 were within the range of 0.5 <G < 1.5; most of the data points pathologically classified as malignant grade 2 were scattered between the levels of 1.5 < G < 2.5; similarly, most of the data points pathologically classified as malignant grade 3 were situated above the level of G > 2.5. To protect the privacy of investigated patients, only the identifying case numbers of the patients are listed in Figure 5. Of note, there were seven cases among the 31 prospective cases investigated where the theoretical grading Gt and pathologically classified grading Gp did not match with each other (shown within a box in Fig. 5). Therefore, the contrastive evaluation accuracy of 31 prospective cases was estimated directly as follows: 1−7/31 = 77.42%.
Fig. 5.
The theoretical grading G (scattered data points) derived (by Eqs. 1 and 2) from mammographic data of 31 prospective patients, who were selected at random in a double-blind mode and were classified pathologically as benign (grade 0) or malignant (grades 1 to 3) with increasing malignancy. Solid horizontal line L0∼1 refers to the pathologically grading boundary between benign grade 0 and malignant grade 1. Dash horizontal lines L1∼2, L2∼3 represents the pathologically grading boundaries between grades 1 and 2, grades 2 and 3, respectively. Error bars were obtained by the difference of theoretical grading Gt and pathological grading Gp, namely, Abs(Gt−Gp)/2, where Abs() is a mathematical function to obtain an absolute value. Boxed data points are those mismatched between theoretical and pathological grading. To protect the privacy of investigated patients, only case numbers of patients are listed
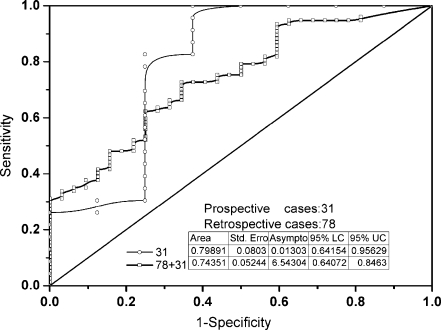
Further to the binary plot of benign against malignant case in Figure 4, both retrospective and prospective data were examined independently using ROC analysis, and their ROC curves are displayed in Figure 6. The relevant statistics, such as area under ROC curve, were also inserted in Figure 6. According to the statistics, the Az values of prospective data equals to 0.79891. We made no difference between the prospective and retrospective data when both of them are merged into a single data to plot the ROC curve of whole data (109 cases). The Az values of the whole data are 0.74351 and more reliable than that of simple prospective data (31 cases).
Fig. 6.
ROC curves of both prospective data (31 cases) and retrospective plus prospective data (78 + 31). Insets listed are the relevant statistics and the diagonal is a reference line
Discussion
Comparison between Malignant and Benign Microcalcifications
The calcifications in mammograms appear as relatively bright regions in comparison with the surrounding breast tissue or masses. Benign calcifications are generally larger, more rounded, and smaller in number. On the other hand, malignant calcifications tend to be irregular, numerous, clustered, small, varying in size and shape, angular, irregularly shaped, and branched in orientation [11]. Traditionally, radiologists have assessed microcalcifications according to criteria such as size, shape, number, and distribution. Because a radiologist’s diagnosis is made on a basis of subjective judgment, the difference in diagnosis between inter- and intra-observer sometimes could be significant. The computer-aided quantification of image features and analysis of these feature parameters is instrumental in improving radiologists’ capability to differentiate objectively malignant breast lesions from benign ones [12]. It is of importance to select suitable quantitative feature parameters for a computer-aided analysis in order to accomplish a high level of discrimination between benign and malignant microcalcifications.
In this study, we defined a new feature parameter θ for analyzing clustered microcalcifications by a novel mathematical model. This new feature parameter θ combines five morphological variables of clustered microcalcifications. The population density of dispersive microcalcification clusters and the smallest diameter encircling the margin of the segmented region of microcalcification clusters describe the distribution and the range of microcalcification clusters. The largest, smallest, and mean diameters of microcalcification spots describe the size of microcalcification. These five image parameters are commonly used by experienced radiologists to distinguish benign from malignant microcalcification.
Our results show that the pattern form factor value θ of malignant microcalcifications is larger than the value θ of its benign counterpart. A reasonable explanation for this observation is that malignant calcifications are smaller in size, and a malignant calcification cluster tends to have more calcification spots and a larger cluster area than a benign one. In Fondrinier’s analysis, the total number of calcifications per cluster and the greatest diameter of the cluster larger than 25 mm were both significant in the univariate analyses, and the greatest diameter of the cluster larger than 25 mm was also significant in the multivariate analyses [13]. Leichter et al. found that the mean distance between microcalcifications was lower, and the mean number of neighbors was higher in malignant than in benign lesions and these two feature variables can represent the distribution characteristics of the microcalcifications within the cluster [14]. Our results indicate the utility of the value θ as a new feature parameter for discriminating between benign and malignant microcalcifications.
In our investigation, the benign cases included both mastopathies and fibroadenomas. The microcalcifications of fibrocystic origin are usually smaller in size, and distributed diffusely in both breasts. The calcifications of fibrocystic disease are most often confused with the calcifications associated with cancer. It may explain why a considerable overlap of the value θ between the malignant and benign microcalcification, especially between the grade 0 and grade 1. In future studies, we may be able to improve the accuracy of the current microcalcification classification scheme of pattern form factor θ by including a neural-network classifier in the model.
Relationship Between the Feature Parameter and Histological Grading
Many studies have attempted to discriminate benign microcalcifications from malignant ones by using a computer-based method, but the histological classification of clustered microcalcifications on mammograms can be difficult. In ductal carcinoma in situ (DCIS), linear or branching calcifications are more likely to be associated with comedo subtype, whereas granular-type are often observed with noncomedo subtype. However, there is a considerable overlap of subtypes, and the predominant histological subtype cannot be predicted on the basis of the microcalcification type with a high degree of accuracy [15]. Nakayama et al. had developed a computer-aided diagnosis scheme for identifying histological classifications of clustered microcalcifications on magnified mammograms [16]; however, they did not demonstrate any relationship between histological grade and the feature parameters.
Since breast cancer is known to be a heterogeneous disease, the nominal category of the diagnosis alone does not provide the clinician with sufficient information for treatment decisions. Therefore further classification systems, such as histological grading, have been developed. Several studies have demonstrated that the histological malignancy grading of invasive ductal breast cancer is one of the most important prognostic factor for survival [16, 17]. The value of inferring the histopathologic grade of a mammographically malignant lesion is in its potential influence on the therapeutic approach and management.
It had been debated whether feature patterns of calcifications on mammograms can predict the histologic grade of breast cancer accurately. Lee et al. demonstrated a good correlation between the nuclear grade of DCIS and the mammographic features [18]. Thurfjell et al. revealed that fine linear and branching calcifications alone were associated with not only DCIS nuclear grades 3 and 2 but also with invasive ductal carcinoma grade 3 [19]. In contrast, several investigators have reported that there was a considerable overlap on mammographic appearances, and the histological type of DCIS cannot be predicted prospectively [20, 21]. We noted that the microcalcifications were only categorized by radiologists in previous studies. In contrast, the features of microcalcifications were extracted and analyzed by the computer scheme in our study. We also defined the pattern form factor of microcalcification cluster θ, a new feature parameter worked out from five basic computer-extracted feature parameters, and developed a mathematical model to relate the form factor θ with the grading of patient tumors. Both retrospective and prospective cases demonstrated a positive correlation between value θ and the pathological grading of breast cancer. It must emphasize that all of the malignant cases in our study were invasive ductal carcinoma and not DCIS. In light of the present results, the feature parameter θ may bring in a certain enlightenment to clinical diagnosis as an aid to the treatment decisions of patients with invasive ductal breast cancer. Making clinical decisions for biopsy or follow-up by taking into account possible histological classifications of microcalcifications on mammograms may reduce the number of unnecessary biopsies.
Limitations of Our Study
Although significant differences of the feature parameter value θ were observed between benign and malignant calcifications, a considerable overlap was also found in our study. Development of a quantitative feature extraction and classification scheme will require continuing efforts. Accuracy rate and ROC number for the benignancy/malignancy in our series is a bit small for a mathematical model. The databases, on a basis of 109 cases, cannot be large enough to allow extracting a strict model statistically.
Our Future Work
In the next stage of our studies, it will be necessary to combine other feature parameters, especially the shape and distribution parameters, to improve the accuracy of microcalcification classification scheme. The underlying mechanism that the pattern form factor value θ increased gradually with the grades of ductal carcinoma is yet unclear. The correlation of microcalcification feature parameters with histopathologic findings should help one gain a better understanding of the positive relationship between the value θ and pathological grading of breast cancer. A relatively small number of sampling patients was included in current study; therefore, our results should been confirmed by a larger sampling data in future studies.
Summary
We investigated quantitatively the image feature of clustered microcalcification on the mammograms of 109 women who were divided into the retrospective data (78 cases) and prospective data (31 cases), respectively. We put forth, for the first time, a new image feature parameter θ referred to as the pattern form factor of microcalcification cluster. There exists a positive relationship between the value θ and pathological grading G of breast cancer, which was modeled mathematically as G = 6.438 + 1.186 × Ln <θ>. As one candidate for feature parameter in computer-aided diagnosis, the pattern form factor θ of clustered microcalcifications may be useful to predict the pathological grading and classification of microcalcification clusters on mammography in breast cancer.
Acknowledgments
This work was supported by the National Natural Science Foundation of China under Grant No. 10875178 and 80171207, the Fundamental Research Funds for the Central Universities under Grant No. 10ykjcll, the Open Funds of State Key Laboratory of Oncology in Southern China, Guangzhou Technology Support Program under Grant No. 2010J-E151, and Science and Technology Planning Project of Guangdong Province, China under Grant No. 2010A030500004.
Footnotes
Yuan-Zhi Shao and Lizhi Liu contributed equally to this work.
References
- 1.Ferlay J, Shin HR, Bray F, Forman D, Mathers C, Parkin DM. Estimates of worldwide burden of cancer in 2008: GLOBOCAN 2008. Int J Cancer. 2010 doi: 10.1002/ijc.25516. [DOI] [PubMed] [Google Scholar]
- 2.Jemal A, Murray T, Ward E. Cancer statistics. CA Cancer J Clin. 2005;55:10–30. doi: 10.3322/canjclin.55.1.10. [DOI] [PubMed] [Google Scholar]
- 3.Howell A. The emerging breast cancer epidemic: early diagnosis and treatment. Breast Cancer Res. 2010 doi: 10.1186/bcr2739. [DOI] [PMC free article] [PubMed] [Google Scholar]
- 4.Breast cancer facts. Available at: http://www.uthscsa.edu/hscnews/pdf/. Accessed: April 2010.
- 5.Fletcher SW, Elmore JG. Mammographic screening for breast cancer. N Engl J Med. 2003;348:1672–1680. doi: 10.1056/NEJMcp021804. [DOI] [PMC free article] [PubMed] [Google Scholar]
- 6.Elmore JG, Armstrong K, Lehman CD, Fletcher SW. Screening for breast cancer. JAMA. 2005;293:1245–1256. doi: 10.1001/jama.293.10.1245. [DOI] [PMC free article] [PubMed] [Google Scholar]
- 7.Jiang Y, Nishikawa RM, Wolverton DE. Malignant and benign clustered microcalcifications: automated feature analysis and classification. Radiology. 1996;198:671–678. doi: 10.1148/radiology.198.3.8628853. [DOI] [PubMed] [Google Scholar]
- 8.Chan HP, Sahiner B, Lam KL. Computerized analysis of mammographic microcalcifications in morphological and texture feature spaces. Med Phys. 1998;25:2007–2019. doi: 10.1118/1.598389. [DOI] [PubMed] [Google Scholar]
- 9.Nakayama R, Uchiyama Y, Watanabe R, Katsuragawa S, Namba K, Doi K. Computer-aided diagnosis scheme for histological classification of clustered microcalcifications on magnification mammograms. Med Phys. 2004;31:789–799. doi: 10.1118/1.1655711. [DOI] [PubMed] [Google Scholar]
- 10.Elston CW. The assessment of histological differentiation in breast cancer. Aust N Z J Surg. 1984;54:11–15. doi: 10.1111/j.1445-2197.1984.tb06677.x. [DOI] [PubMed] [Google Scholar]
- 11.Sickles EA. Breast calcifications: mammographic evaluation. Radiology. 1986;160:289–293. doi: 10.1148/radiology.160.2.3726103. [DOI] [PubMed] [Google Scholar]
- 12.Jiang Y, Nishikawa RM, Schmidt RA, Metz CE, Giger ML, Doi K. Improving breast cancer diagnosis with computer-aided diagnosis. Acad Radiol. 1999;6:22–33. doi: 10.1016/S1076-6332(99)80058-0. [DOI] [PubMed] [Google Scholar]
- 13.Fondrinier E, Lorimier G, Guerin-Boblet V, Bertrand AF, Mayras C, Dauver N. Breast Microcalcifications: Multivariate Analysis of Radiologicand Clinical Factors for Carcinoma. World J Surg. 2002;26:290–296. doi: 10.1007/s00268-001-0220-3. [DOI] [PubMed] [Google Scholar]
- 14.Leichter I, Lederman R, Buchbinder S, Bamberger P, Novak B, Fields S. Optimizing parameters for computer-aided diagnosis of microcalcifications at mammography. Acad Radiol. 2000;7:406–412. doi: 10.1016/S1076-6332(00)80380-3. [DOI] [PubMed] [Google Scholar]
- 15.Stomper PC, Connolly JL. Ductal carcinoma in situ of the breast: correlation between mammographic calcification and tumor subtype. AJR. 1992;159:483–485. doi: 10.2214/ajr.159.3.1323923. [DOI] [PubMed] [Google Scholar]
- 16.Bloom HJG, Richardson WW. Histological grading and prognosis in breast cancer. Br J Cancer. 1957;11:359–377. doi: 10.1038/bjc.1957.43. [DOI] [PMC free article] [PubMed] [Google Scholar]
- 17.Spiethoff A, Schenck A, Bohrer M. Relationship of DNA ploidy to hormone receptor status and proliferation in invasive breast carcinoma. J Cancer Res Clin Oncol. 2000;126:707–710. doi: 10.1007/s004320000166. [DOI] [PubMed] [Google Scholar]
- 18.Lee KS, Han BH, Chun YK, Kim HS, Kim EE. Correlation between mammographic manifestations and averaged histopathologic nuclear grade using prognosis-predict scoring system for the prognosis of ductal carcinoma in situ. Clin Imaging. 1999;23:339–346. doi: 10.1016/S0899-7071(00)00166-2. [DOI] [PubMed] [Google Scholar]
- 19.Thurfjell MG, Lindgren A, Thurfjell E. Nonpalpable breast cancer: mammographic appearance as predictor of histologic type. Radiology. 2002;222:165–170. doi: 10.1148/radiol.2221001471. [DOI] [PubMed] [Google Scholar]
- 20.Dinkel HP, Gassel AM, Tschammler A. Is the appearance of microcalcifications on mammography useful in predicting histological grade of malignancy in ductal carcinoma in situ? Br J Radiol. 2000;73:938–944. doi: 10.1259/bjr.73.873.11064645. [DOI] [PubMed] [Google Scholar]
- 21.Slanetz PJ, Giardino AA, Oyama T. Mammographic appearance of ductal carcinoma in situ does not reliably predict histologic subtype. Breast. 2001;7:417–421. doi: 10.1046/j.1524-4741.2001.07607.x. [DOI] [PubMed] [Google Scholar]


