

Non-technical summary
Axons are long process of nerve cells that mediate communication and control within the organism. Mammalian neurons have developed a complex ion channel clustering mechanism in axons to optimize rapid signalling. It has been discovered recently that intricate details of the spatial pattern of channel clustering play a critical role in signal processing in the axon. The electrical properties of axons, however, have been difficult to study using electrodes because axons are very small in diameter. We took advantage of a critical methodological improvement in the high sensitivity membrane potential imaging (Vm imaging) technique to study electrical correlates of channel clustering in the axon of cortical neurons. Voltage imaging revealed the location and length of the axonal site for nerve impulse initiation as well as the pattern of saltatory conduction in myelinated axons in the form of dynamic spatial maps of transmembrane potential.
Abstract
Abstract
The spatial pattern of Na+ channel clustering in the axon initial segment (AIS) plays a critical role in tuning neuronal computations, and changes in Na+ channel distribution have been shown to mediate novel forms of neuronal plasticity in the axon. However, immunocytochemical data on channel distribution may not directly predict spatio-temporal characteristics of action potential initiation, and prior electrophysiological measures are either indirect (extracellular) or lack sufficient spatial resolution (intracellular) to directly characterize the spike trigger zone (TZ). We took advantage of a critical methodological improvement in the high sensitivity membrane potential imaging (Vm imaging) technique to directly determine the location and length of the spike TZ as defined in functional terms. The results show that in mature axons of mouse cortical layer 5 pyramidal cells, action potentials initiate in a region ∼20 μm in length centred between 20 and 40 μm from the soma. From this region, the AP depolarizing wave invades initial nodes of Ranvier within a fraction of a millisecond and propagates in a saltatory fashion into axonal collaterals without failure at all physiologically relevant frequencies. We further demonstrate that, in contrast to the saltatory conduction in mature axons, AP propagation is non-saltatory (monotonic) in immature axons prior to myelination.
Introduction
There is little disagreement over attributing action potential initiation to a site in the axon initial segment (AIS) under most circumstances. The question of the exact location and length, however, of the spike trigger zone (TZ) in the axon, as defined in functional terms, is not resolved (Colbert & Johnston, 1996; Khaliq & Raman, 2006; Palmer & Stuart, 2006; Kole et al. 2007; Shu et al. 2007). In these studies, the spike TZ was characterized by a single parameter, the distance from the soma, implying a point of initiation. The length of the initiation site, however, is fundamentally important because successful initiation and propagation of the action potential wave requires that a certain length of an axon is brought to the threshold for excitation (Rushton, 1937). Besides the fundamental importance of characterizing the action potential (AP) initiation site, the spike TZ location and length have a recently discovered specific role in tuning neuronal computation underlying a well defined function in auditory neurons which mediate sound source localization (Carr & Boudreau, 1993; Kuba et al. 2006; Kuba & Ohmori, 2009). Moreover, subsequent studies of Kuba et al. (2010) and Grubb & Burrone (2010) reported a novel finding that the structure of the spike TZ mediates an intrinsic plasticity of the axon and regulates the final stage of integration of synaptic inputs. This places a great significance on our ability to directly probe the location and length of the spike TZ under different conditions. The available information regarding TZ plasticity is based on structural data (Grubb & Burrone, 2010; Kuba et al. 2010). Molecular structure of the spike TZ, however, is indirectly correlated with function in a way that is not fully understood (Fleidervish et al. 2010; Johnston, 2010). Thus, the anatomical data require functional confirmation. The location and length of the spike TZ has been difficult to measure directly using electrodes because extracellular recordings cannot be interpreted with sufficient accuracy and intracellular recordings lack the necessary spatial resolution (e.g. Meeks & Mennerick, 2007). Membrane potential imaging (Vm imaging) offers the advantage of high spatial resolution compared with electrical recordings and has been used to directly measure the location of action potential initiation in invertebrate neurons (Zecevic, 1996; Antic et al. 2000) and mammalian axonal arbours (Palmer & Stuart, 2006; Palmer et al. 2010). However, the small size of spike-evoked fluorescence transients necessitated averaging large numbers of trials (>100) to achieve signal-to-noise ratios appropriate for detecting spike initiation. Even after extensive averaging, the length of the TZ could not be determined because the sensitivity of these measurements was low. Here, we utilize a recent critical improvement in the sensitivity of Vm imaging by a factor of approximately 50 (Canepari et al. 2010; Foust et al. 2010; Holthoff et al. 2010) to characterized functionally relevant parameters of the spike TZ in cortical layer 5 pyramidal neurons.
Methods
Ethical approval
All surgical and experimental procedures were performed in accordance with ethical standards as outlined in Drummond (2009) as well as with national and institutional animal welfare guidelines.
Slices, neuron selection, patch-clamp recording and intracellular application of dyes
Experiments were carried out on somatosensory cortex slices from 5- to 9-day-old mice for experiments on unmyelinated, and 15- to 30-day-old mice for experiments on myelinated, axons. In a small percentage of experiments (∼5%) we used wild-type mice (Swiss Webster (CFW), The Jackson Laboratory, Bar Harbor, ME, USA) while most of the data were obtained using a transgenic mouse line (Gene symbol: Crym) characterized by enhanced green fluorescent protein (EGFP) positive pyramidal neurons in cortical layers 5 and 6. Crym mice were obtained from the GENSAT Project at The Rockefeller University. All measurements were carried out at 32–34°C. The mice were decapitated following deep sodium pentobarbital (50 mg kg−1) anaesthesia, the brain was quickly removed, and 300 μm thick coronal cortical slices were cut in ice-cold solution using either a custom made rotary slicer with ceramic circular blade (Specialty Blades Inc., Staunton, VA, USA) or a Leica VT1000 vibrating blade microtome. Slices were incubated at 37°C for ∼30 min and then maintained at room temperature (23–25°C). The standard extracellular solution used during recording contained (in mm): 125 NaCl, 25 NaHCO3, 20 glucose, 2.5 KCl, 1.25 NaH2PO4, 2 CaCl2 and 1 MgCl2, pH 7.4 when bubbled with a gas mixture (95% O2, 5% CO2). Slicing was done in modified extracellular solution (in mm): 110 choline-Cl, 25 NaHCO3, 20 glucose, 2.5 KCl, 1.25 NaH2PO4, 0.5 CaCl2 and 7 MgCl2. Somatic whole-cell recordings were made with 4–6 MΩ patch pipettes using a Multiclamp 700A amplifier (Axon Instruments Inc., Union City, CA, USA). The pipette solution contained (in mm): 120 potassium gluconate, 3 KCl, 7 NaCl, 4 Mg-ATP, 0.3 Na-GTP, 20 Hepes and 14 Tris-phosphocreatin (pH 7.3, adjusted with KOH) and 0.8 mm of the voltage-sensitive dye JPW3028 (Zecevic & Antic, 1995; synthesized and kindly provided by J. P. Wuskell and L. M. Loew, University of Connecticut, Farmington, CT, USA). The somatic whole cell recording data were not corrected for liquid junction potential.
In experiments using wild-type mice, an attempt was made to identify layer 5 pyramidal cells with intact axons in one plane of focus close to the surface of the slice (to minimize light scattering) using infrared differential-interference contrast (DIC) video-microscopy. This approach is inefficient because thin axons can very rarely be resolved under DIC for more than 10–20 μm distal to the soma. Thus, even after substantial experience, more than two out of three neurons loaded with the dye were subsequently found to be badly chosen (axon cut or not running parallel to the plane of focus). The selection of neurons with long and intact axonal processes positioned close to the surface of the slice (<30 μm) was greatly facilitated using the Crym transgenic mouse line expressing EGFP in layer 5 pyramidal neurons. The EGFP labelling allowed us to select appropriate neurons prior to dye loading by visually inspecting a slice under 488 nm excitation EGFP fluorescence using spinning disk confocal video-microscopy mode at 5–20 frames per second (CSU-10 or CSU–XAH Yokogawa confocal scanner; Solamere Tech., Salt Lake City, UT, USA). The axons of individual nerve cells were readily visible under fluorescence as illustrated in Fig. 1. This approach is possible because EGFP fluorescence does not interfere with voltage–sensitive dye signals due to the non–overlapping emission spectra of these two fluorophores. This is, however, not the case with yellow fluorescent protein (YFP) labelled preparations. The selection of neurons under EGFP fluorescence was carried out under low light level and, in agreement with previous results on cerebellar Purkinje cells (Foust et al. 2010), caused no detectable changes in electrical behaviour of neurons.
Figure 1. Selection of L5 cortical neurons for Vm imaging.
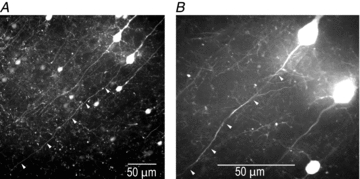
Confocal images of L5 pyramidal neurons expressing EGFP in a cortical slice (Crym transgenic mouse line). Low (A) and high (B) magnification images of the same slice region; 488 nm excitation using Yokogawa spinning disk scanner. Axons of individual neurons are clearly visible. Cells with long intact axons (white arrows) in one plane of focus close to the surface of the slice were selected.
Individual neurons were selectively labelled with the membrane impermeant voltage sensitive dye by allowing free diffusion of the probe from a somatic patch pipette in the whole-cell configuration. We used the most successful voltage probe for intracellular application, JPW3028, which is a doubly positively charged analogue of the ANEP series of lipophilic styryl dyes that is still sufficiently water soluble to be used for microinjection. Its close analogue (JPW1114; Zecevic, 1996) characterized by the same voltage sensitivity is available from Invitrogen as D6923. Glass pipettes were first filled from the tip with dye-free solution by applying negative pressure for about 15 s and then back-filled with the solution containing of the indicator dye (0.8 mm). Intracellular staining was accomplished in 15–60 min, depending on access resistance. After a sufficient amount of the dye diffused into the cell body, as determined by measuring the resting fluorescence intensity from the soma, the patch-electrode with the dye was detached from the neuron by forming an outside-out patch. The staining level was determined empirically as a compromise between attaining a high level of fluorescence without causing damage by prolonged dialysis from the patch pipette. After the dye diffusion was completed, the preparation was typically incubated for an additional 1.5–2 h at room temperature to allow the voltage-sensitive dye to spread into the axonal arbour. To obtain electrical recordings from the soma, the cell body was repatched using an electrode filled with dye-free intracellular solution before making optical measurements. APs were evoked either by transmembrane current pulses delivered via a recording electrode attached to the soma in whole cell configuration or, in some experiments, by localized activation of excitatory synapses on basal dendrites using an extracellular stimulating electrode.
Optical recording
We used a stationary stage upright microscope (Model BX51WI Olympus Inc., Japan) equipped with three camera ports. One camera port had a standard, high spatial resolution CCD camera for infrared DIC video-microscopy (CCD-300-RC, Dage-MTI, Michigan City, IN, USA). The second camera port had a fast data acquisition camera with relatively low spatial resolution (80 × 80 pixels) but outstanding dynamic range (14 bits) and exceptionally low read noise (NeuroCCD-SM, RedShirtImaging LLC, Decatur, GA, USA). The third camera port had a CCD camera with high spatial resolution (1392 × 1024 pixels; Pixelfly-qe, PCO Imaging, Kelheim, Germany) mounted on a spinning-disc confocal scanner (specified above) used to collect z-stacks of confocal images for detailed morphological reconstruction of the stained cell.
The brain slice was placed on the stage of the microscope and the fluorescence image of the stained neuron projected by a water immersion objective (60×/1.0 NA, Nikon) onto the fast data acquisition CCD positioned in the primary image plane. This objective was selected as a compromise between imaging area, spatial resolution and signal-to-noise ratio (S/N). Optical recording of voltage-sensitive dye signals from individual axons was carried out in the wide-field epi-fluorescence microscopy mode. The superior spatial resolution of confocal and two-photon fluorescence microscopy techniques as well as the second harmonic generation (SHG) microscopy technique are difficult to utilize in Vm imaging from axons as these methods cannot generate sufficient sensitivity in terms of the S/N, mainly because of the high fractional shot noise related to small number of photons available for collection (Kuhn et al. 2004; Dombeck et al. 2005; Kerr & Denk, 2008). A frequency-doubled 300–500 mW diode-pumped Nd:YVO4 continuous wave (CW) laser emitting at 532 nm (MLL532, Changchun New Industries Optoelectronics Tech. Co., Ltd, Changchun, China) was the source of excitation light. The laser beam was directed to a light guide coupled to the microscope via a single-port epifluorescence condenser (TILL Photonics GmbH, Gräfelfing, Germany) designed to overfill the back aperture of the objective. In this way, approximately uniform illumination of the object plane was attained. The fractional noise of low-noise solid-state lasers (<0.5%) is below typical fractional shot-noise in fluorescence voltage-sensitive dye recordings (Iwasato et al. 2000; Matsukawa et al. 2003; Zhou et al. 2007; Canepari et al. 2010; Foust et al. 2010). The laser was used in place of a conventional xenon arc-lamp as a light source to maximize the sensitivity of Vm imaging by: (1) using a monochromatic excitation light at the red wing of the absorption spectrum to maximize Vm sensitivity of the dye (Loew, 1982; Kuhn et al. 2004; Holthoff et al. 2010) and (2) increasing the intensity of the excitation light beyond the level that can be achieved by an arc-lamp. The excitation light was reflected to the preparation by a dichroic mirror with the central wavelength of 560 nm and the fluorescence light was passed through a 610 nm barrier filter (Schott RG610). The image of a stained neuron was projected by a 60× objective onto a CCD chip via a variable gain (0.09–0.11×) optical coupler (RedShirtImaging). At this magnification the full CCD frame (80 × 80 pixels) corresponded to approximately a 300 × 300 μm area in the object plane with each individual pixel receiving light from an area of ∼4 × 4 μm. With the improved sensitivity of Vm imaging, relatively good signal-to-noise ratios could be obtained in single-trial recordings (e.g. Figs 10 and 12). Modest signal-averaging (typically 4–9 and rarely up to 25 trials) was used to improve the signal-to-noise ratio further. The conclusions derived from our measurements are based on the direct comparison of optical signals recorded from different axonal locations. Such a comparison is valid only if the light intensity is linearly proportional to the membrane potential over the entire range of signal amplitudes. This has been demonstrated repeatedly in experiments where the same dye has been shown to track the full-size action potential exactly in several neuronal types (Zecevic, 1996; Antic et al. 1999; Antic, 2003, Djurisic et al. 2004; Palmer & Stuart, 2006), a result that implies a strictly linear relationship between the dye signal and the membrane potential in the entire physiological range.
Figure 10. Initiation and propagation of an AP in unmyelinated axon.
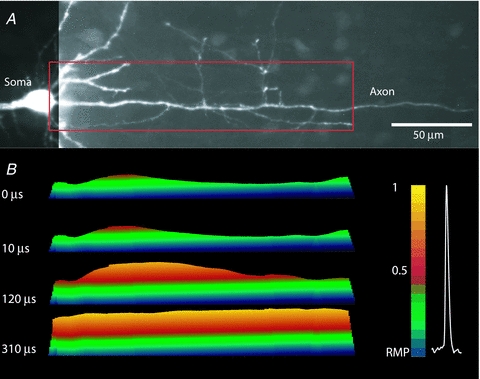
A, fluorescence confocal image of a dye loaded P6 pyramidal neuron; the soma, basal dendrites and a proximal part of the axon with several collaterals are clearly visible. Recording region indicated by red rectangle. B, time sequence of frames showing spatial profile of colour coded relative Vm amplitude in the axon at four characteristic time points: 0 μs – AP initiation at TZ; 10 and 120 μs – gradual depolarization; 310 μs – peak depolarization. Note the monotonic character of AP propagation. Membrane potential colour scale shown on right. See supplementary Movie 2.
Figure 12. Stability of spike TZ during repetitive firing.
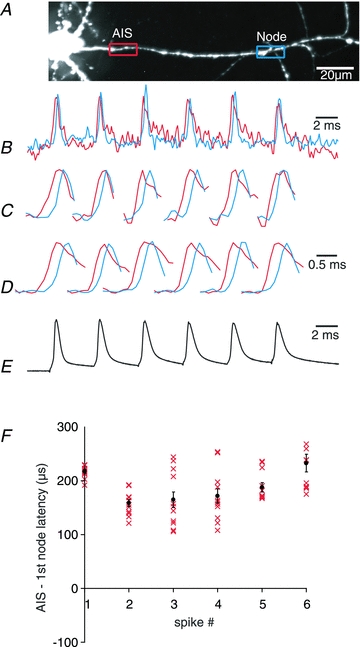
A, fluorescence confocal image of a dye loaded L5 pyramidal neuron; axon in recording position. Spike TZ location and the 1st node of Ranvier are indicated by red and blue rectangles. B, single trial recording of a train of APs from two locations (red: TZ; blue: 1st node). C, expanded traces of six individual AP signals from (B). Note that the signal from TZ consistently precedes the signal from the 1st node (delay > 0). D, average signals from 12 repetitions of single trial measurements shown in (B). E, electrical recording from the soma. F, plot of TZ–1st node AP latency values for individual spikes (1–6) in the train. Single trial measurements and average values ± SEM are shown.
Data analysis
Membrane potential signals were recorded typically for 10–20 ms at a frame rate of 10 KHz using a partial readout mode (a strip of 12 × 80 pixels of an 80 × 80 pixels CCD chip). The analysis and display of data were carried out using the NeuroPlex program (RedShirtImaging) written in IDL (ITT Visual Information Solutions, Boulder, CO, USA) and custom Visual Basic routines. Under the conditions of low light levels, the background fluorescence becomes a significant determinant of the ΔF/F signal size. The raw data were first corrected for this effect by subtracting the average background fluorescence intensity determined from an unstained area on the slice. Subsequently, the signal alignment software was used to correct for temporal jitter in AP initiation as well as for possible small movements of the preparation during averaging. In the temporal domain, AP signals were aligned by cross correlation of the electrically recorded APs in each trial to the reference signal acquired at the start of averaging (Fig. 2B). In the spatial domain, camera images were aligned in two dimensions offline by image cross-correlation (e.g. Gonzalez & Woods, 1992) to compensate for possible small lateral movements of the preparation. The correct focus of the image in the z-dimension was verified before each individual trial; small adjustments were often necessary. The spatially and temporally aligned signals were averaged as shown in Fig. 2B. Slow changes in light intensity due to bleaching of the dye were corrected by dividing the data by an appropriate dual exponential function derived from the recording trials with no stimulation (Fig. 2B; Grinvald et al. 1982). Dual exponential fitting requires an algorithm for least-squares estimation of non-linear parameters. We used the Levenberg–Marquardt algorithm (Marquardt, 1963). Implementation in Visual Basic was taken from http://digilander.libero.it/foxes/optimiz/Optimiz1.htm. The waveform of the AP signal was reconstructed from a set of data points using Cubic Spline Interpolation, a piecewise continuous curve passing through each data point (Mathews & Fink, 2004). To confirm that the voltage-sensitive dye signal tracks membrane potential without significant distortion at the millisecond time scale, the electrical AP signal from the soma was compared to the optical AP signal from the adjacent axon hillock as shown in Fig. 2C and D. The two signals superimpose very closely, allowing for the shot noise in optical recording. The small discrepancy between the electrical and the optical transient observed late in the repolarizing phase is likely to be due to incomplete bleach correction. The imperfect bleach correction had no effect on the AP upstroke waveform because the residual change due to bleaching of the dye was small and approximately 100 times slower than the rising phase of the spike. Figure 2C and D illustrate two additional points. First, the available sensitivity of Vm imaging was sufficient for accurate monitoring of the subthreshold depolarization preceding the regenerative AP signal. Additionally, the comparison of the optical AP signals from the soma/axon hillock and from a more distal node of Ranvier confirmed that APs have markedly different dynamics at these two locations (Kole et al. 2007; Shu et al. 2007); both the upstroke and the downstroke of the AP were faster in the node of Ranvier.
Figure 2. Signal processing.
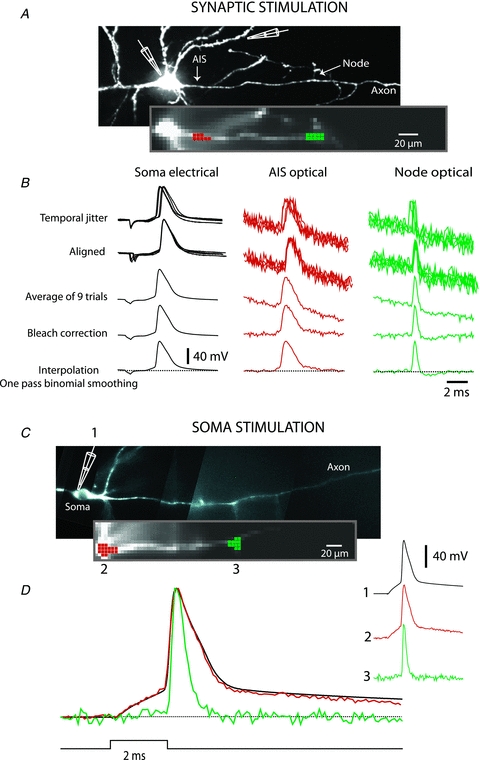
A, synaptic stimulation. Upper image, high resolution confocal image of a stained neuron with axon in recording position. Recording electrode attached to soma and stimulating electrode next to basal dendrite shown schematically. Lower image, low spatial resolution fluorescence image of the axon obtained by CCD used for Vm imaging. B, electrode recordings from soma, optical recordings from spike TZ (red), and from node of Ranvier (green). Top traces: row data from 9 trials showing temporal jitter in AP initiation following synaptic activation. Second row of traces: temporally aligned signals. Third row of traces: averaged signal. Fourth raw of traces: bleach correction. Bottom traces: cubic spline interpolation with one pass of temporal smoothing. C, somatic stimulation. Upper image, high resolution confocal image of another neuron with axon in recording position. Lower image, low spatial resolution fluorescence image of the axon obtained by CCD used for Vm imaging. Traces on right: AP transients from three locations: 1-electrode recording from soma; 2-optical recording from axon hillock; 3-optical recording from the first node of Ranvier. Bottom traces: superimposed signal from same three locations.
A critical methodological concern for this study is how accurate is the reconstruction of the AP waveform from different axonal regions at the finer, microsecond time scale used to determine the location and length of the spike initiation zone? It is known from electrode measurements that accurate recording of the fastest frequency components of the axonal AP (maximum dV/dt of 1100–1200 V s−1 at 32–37°C) requires sampling rates of 20–80 kHz (further increase in the sampling rate gave similar results; Yu et al. 2008). While this range of sampling frequencies cannot be realized in optical recordings because of limited sensitivity, it was possible to effectively apply a frame rate of 10 kHz. To determine the accuracy in reconstructing rapid AP transients from optical data acquired at 10 kHz, we generated a numerical simulation of a fast axonal AP signal digitized at 200 kHz and characterized by the maximum rate of rise corresponding to physiological values in the axon (∼1100 V s−1; Fig. 3). The simulated signal was re-sampled at 10 kHz, the new waveform was reconstructed by cubic spline interpolation, and the result was compared with the original signal. The same procedure was carried out for the AP from the soma characterized by slower dynamics (maximum rate of rise of 480 V s−1; Kole et al. 2008; Yu et al. 2008). This analysis showed that filtering of the AP transient caused by sampling at 10 kHz underestimates the AP peak amplitude from the spike TZ and from the nodes of Ranvier by ∼3%; the maximum rate of rise was reduced from 1100 V s−1 to ∼600 V s−1. The filtering effect, as expected, was less for the slower somatic spike (peak amplitude underestimated by ∼1%; maximum dV/dt reduced from 480 V s−1 to 400 V s−1).
Figure 3. Accuracy of AP waveform reconstruction.
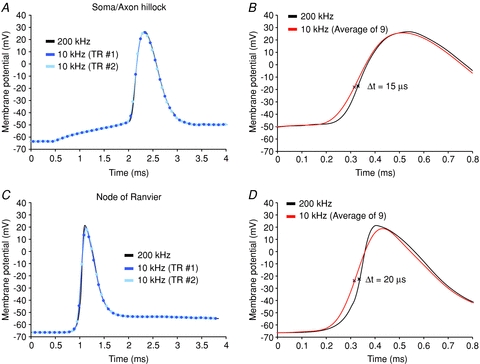
A, simulated AP signal from axon hillock characterized by the maximum rate of rise of 480 mV ms−1 sampled at 10 kHz. Two exemplar results of sampling at 10 kHz (light and dark blue) superimposed with simulated signal (black). B, simulated AP signal from axon hillock (black) superimposed with average of nine trials sampled at 10 kHz (red). The filtering effect of sampling at 10 kHz: the peak amplitude underestimated by 1%; the time to reach 50% of maximum amplitude shifted to the left on the time axis by 15 μs. C, simulated AP signal from node of Ranvier characterized by the maximum rate of rise of 1100 mV ms−1 (black) re-sampled at 10 kHz. Two exemplar results of sampling at 10 kHz (light and dark blue) superimposed with simulated signal (black). D, simulated AP signal from axon hillock (black) superimposed with average of nine trials sampled at 10 kHz (red). The filtering effect of sampling at 10 kHz: the peak amplitude underestimated by 3%; the time to reach 50% of maximum amplitude shifted to the left on the time axis by 20 μs.
As illustrated in Fig. 3, the described filtering effect of insufficiently high sampling rate had a very small effect on determining soma–axon delays used to establish the location and length of the spike TZ. The filtering effect of accumulating photons for 100 μs for each data point (frame rate of 10 kHz) caused the somatic/axon hillock spike to appear 15 μs earlier than the actual depolarizing wave. All other axonal spikes were shifted to the left by 20 μs on the time axis (Fig. 3B and D). This systematic error, causing a net shift of 5 μs in the timing of axonal spikes from different locations relative to the soma/axon hillock APs, was neglected. In other words, we assumed that the AP waveform reconstructed by cubic spline interpolation from the data obtained at a sampling rate of 10 kHz is an adequate approximation of the true AP shape for the purpose of this study. Thus, we treated the reconstructed waveform as an analog signal that has a known value at all times. The continuous cubic spline interpolation curve, re-sampled at 100 kHz, was used to characterize timing information.
Pharmacological effects and photodynamic damage associated with the voltage sensitive dye technique
A number of previous studies have documented that loading neurons with the voltage-sensitive dye used here (JPW 3028) at concentrations that are appropriate for imaging does not have a detectable pharmacological effect on action potential and resting membrane properties. Although the excitation of this dye does eventually cause phototoxic effects to neuronal processes, this damage only becomes evident after multiple trials. Thus, it is possible to obtain significant numbers (up to hundreds) of action potentials prior to any evidence of phototoxic effects in both invertebrate (Antic & Zecevic, 1995; Antic et al. 2000) and vertebrate neurons (Antic et al. 1999; Antic, 2003; Djurisic et al. 2004, 2008; Palmer & Stuart, 2006; Canepari et al. 2007, 2010; Foust et al. 2010; Holthoff et al. 2010). In the present study, we accepted only those trials for analysis in which there was no evidence for phototoxic damage, as indicated by the lack of a significant change in the rate of rise or fall or width of action potentials as recorded in the soma and imaged from processes (see also Canepari et al. 2007; Foust et al. 2010). We limited or reduced the laser stimulation of the soma and proximal dendrites on most trials through position of the field stop diaphragm of the microscope, in order to prevent phototoxic damage resulting from the high levels of dye in these regions. Imaging was only performed for brief periods (10–20 ms) and ∼1 min was allowed between trials. We confirmed that this electrochromic dye does not significantly increase the membrane capacitance of the labelled neuron as evident from a number of control measurements showing that the waveform of the electrically recorded action potentials remains identical after intracellular application of the dye (e.g. Canepari et al. 2007). The physical basis for the lack of the capacitive load effect, which is characteristic for some fluorescence resonance energy transfer probes as well as some protein voltage sensors, is that the interaction of the electric field with electrochromic dyes, such as that used here, leads to a charge movement across only a very small fraction of the membrane field (the size of the chromophore; Blunck et al. 2005).
Results
Spatiotemporal resolution and sensitivity of recording
It was necessary, at the start, to determine how accurate are optical measurements of the location and length of the spike TZ in the AIS of L5 pyramidal neurons. The accuracy of our measurements is a function of the available sensitivity of Vm imaging which, in turn, is a function of both spatial and temporal resolution. Thus, these parameters must be considered first. It is known from previous studies that the initiation of the AP in the sub-region of the AIS and its propagation to the first node of Ranvier is accomplished in less than 100 μs in layer-5 pyramidal neurons (Palmer & Stuart, 2006) and in Purkinje cells (Foust et al. 2010). Therefore, to characterize the temporal profile of AP initiation, it is necessary to probe Vm transients at temporal resolution on the order of 10 μs or better. The necessary spatial resolution is dictated by the anticipated length of the spike TZ shown to be a sub-region of the AIS which extends from the soma to the beginning of myelin in layer 5 pyramidal neurons. The average length of the AIS has been determined to be ∼40–50 μm (Palmer & Stuart, 2006). The length of the spike TZ (defined in functional terms) is unknown because there are no direct recordings of this parameter. A plausible prediction for the length of the TZ could be made from structural studies based on immunocytochemical methods as well as from indirect measurements based on extracellular and intracellular electrode recordings and modelling. One study reported a rather uniform distribution of Nav 1.6 in the entire AIS (Lorincz & Nusser, 2008). More recent studies indicated that Na+ channel subtypes may be specifically targeted to different AIS regions (Van Wart et al. 2007; Hu et al. 2009). A polarized distribution of Nav1.2 (proximal) and Nav1.6 (distal) along the AIS of pyramidal neurons in the rat prefrontal cortex (Hu et al. 2009) indicated that the length of the spike TZ is likely to be in the range of 10–40 μm. The combination of extracellular and intracellular electrode recordings and numerical simulations suggested that the spike TZ is a region extending from 10 to 100 μm from the soma in unmyelinated fibres (Meeks & Mennerick, 2007; Shu et al. 2007). According to these values, we estimated that the spatial resolution of ∼4 μm is an adequate compromise between a spatial resolution and sensitivity in the measurements of the location and length of the spike TZ. Accordingly, we adjusted optical magnification of our system so that 1 pixel of the CCD used for Vm imaging received light from a surface area of ∼4 × 4 μm in the object plane.
We next considered the sensitivity (amplitude resolution) of our optical measurement at the spatiotemporal resolution described above (10 μs; 4 μm). We first take into account relevant Vm changes during AP initiation that are likely to occur at the temporal scale on the order of 10 μs. The steepest slope (dV/dt) of the AP upstroke measured optically at 32–34°C, was ∼400–550 mV ms−1 in the soma and ∼550–700 mV ms−1 in the axon (Methods; Fig. 4D). The slope of the axonal AP upstroke signal indicates that the membrane potential will change by ∼5–7 mV in 10 μs during a maximum rate of depolarization. Thus, a meaningful optical readout of Vm transients with a temporal resolution of 10 μs requires that the sensitivity of optical recording (expressed as the S/N) is sufficient to reliably resolve Vm changes of this magnitude. Figure 4 addresses the question of available amplitude resolution. In the measurement shown in Fig. 4C, AP signals were recorded optically from an axonal region 4 μm in length. The trace on the left is a temporal average of optical data from four trials characterized by an S/N of 7. The middle trace is a temporal average of 16 trials characterized by an increase in sensitivity by a factor of 2 (S/N = 14). The noise in the signal can cause an error in the measurement of the time of the transition to a given signal amplitude. Figure 4C illustrates that this error was negligible. The slow noise of relatively small amplitude recorded at the resting membrane potential did not have a significant effect on amplitude measurement during the most rapidly changing phase of the signal. The upstroke of the AP recorded at two different sensitivities and superimposed on an expanded time scale (Fig. 4C, right traces) showed no detectable difference. In other words, increases in the sensitivity from S/N ∼7 did not change the result. We concluded, conservatively, that our measurement with the S/N ≥ 7 could accurately resolve amplitude differences during an upstroke of the AP if they are larger than 4 mV. Thus, our measurements of AP initiation in the axon were limited to the spatial resolution of 4 μm, temporal resolution of 10 μs and amplitude resolution of ∼4 mV. It was necessary to employ modest temporal averaging (4 to 25 trials) to attain this sensitivity in different experiments, depending on the level of intracellular staining and on axon location relative to the surface of the slice. It is noteworthy that temporal averaging has strict limitations. Because the S/N increases with the square root of the number of trials averaged, it is possible to improve the sensitivity by a factor of 2–5 (by averaging 4–25 trials) without significant difficulties. Further improvement in the sensitivity, however, by a factor of only 2 would requiring extensive averaging (>100 trials), which is not easily realizable because of the preparation run-down with time and because repetitive exposure to high-intensity excitation light results in photodynamic damage (Methods). Thus, the improvement in sensitivity of Vm imaging technique (Holthoff et al. 2010) was critical for this study.
Figure 4. Spatiotemporal resolution and recording sensitivity.
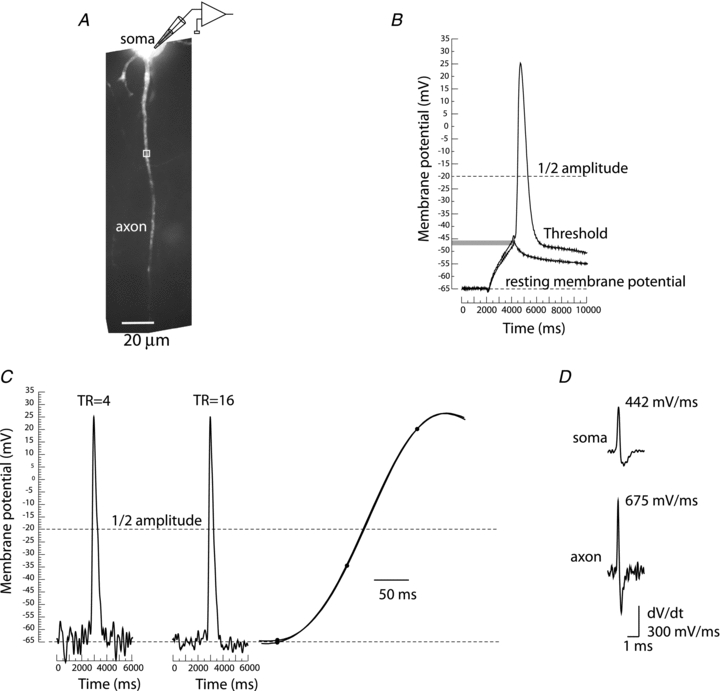
A, fluorescence confocal image of a dye loaded pyramidal neuron with proximal axon in recording position. B, the size and shape of the AP recorded from the soma of layer 5 pyramidal neuron at 32–34°C. C, optical recording of AP related signal from axonal region 4 μm in length indicated by white rectangle in A. Left trace, average of 4 trials. Middle trace, average of 16 trials. Right trace, superimposed upstroke of the two AP signals on expanded time scale. D, first derivative (dV/dt) of the somatic and axonal action potential.
The location and length of the spike TZ
In the first series of measurements, we employed Vm imaging to obtain simultaneous recordings of AP signals from multiple locations along the axon during spike initiation. Figure 5 illustrates a typical measurement. Signals related to an evoked AP from 10 selected locations are illustrated in Fig. 5C. The objective of this experiment was to determine the location and length of the spike initiation site. These two parameters are obtained directly from multisite optical recording of the membrane potential transients either by investigating spike latencies at the soma/axon hillock and more distal axonal recording locations or by the inspection of the spatial distribution of membrane potential as a function of time. The soma–axonal latency is plotted against recording distance from the edge of the soma in Fig. 5D. The delay of axonal fluorescence AP signals relative to the signal from the soma was measured at 50% of the maximum amplitude which approximately corresponds to the voltage at which the rate of depolarization is the highest (Palmer & Stuart, 2006; Foust et al. 2010). The half-maximum point was chosen because this was a more reliable parameter than either the peak amplitude or the voltage AP threshold for two main reasons. First, the accuracy of measurements based on the comparison of time to half-amplitude is better than the 0.1 ms sampling interval when the measurements are made along the most rapidly changing phase of the signal. Second, the greater the rate of change of the signal amplitude as it traverses a given amplitude level, the less will be the error in transition time caused by noise (Malmstadt et al. 1974; Ross & Krauthamer, 1984). Moreover, additional analysis showed that the same result regarding the location and length of the TZ was obtained by using just above threshold value of the membrane potential (−50 to −45 mV in different neurons) as a parameter specifying the timing of spike initiation. In Fig. 5D, the two latency curves constructed by using two different criteria (50% amplitude and 30% amplitude) were very nearly identical in the AIS. Thus, the soma-axon latency was not sensitive to the criteria used to specify timing of the AP depolarizing wave within the tested range of 30–50% of the maximum AP amplitude. The graphs in Fig. 5D were obtained by plotting the latency value for AP signals from consecutive axonal regions of 4 μm in length (a distance covered by one pixel) after the data were smoothed by spatial filtering to remove local extremes caused by noise in optical measurements. This improved the accuracy of measurements without causing detectable distortions of the data (Supplementary Fig. 1S). The data show that, in this representative experiment, an axonal region of ∼16 μm in length (four pixels) centred ∼30 μm from the edge of the soma reached the voltage threshold for AP as well as the maximum rate of depolarization simultaneously (at 10 μs temporal resolution) and with the shortest delay. This region was identified as the spike TZ.
Figure 5. Measurement of the spatial distribution of membrane potential as a function of time along the proximal axon during AP initiation.
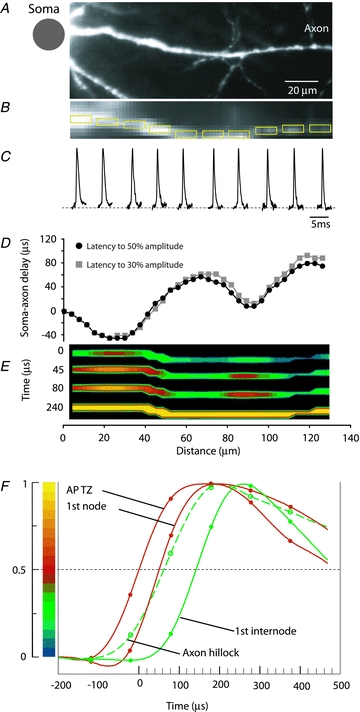
A, high resolution confocal image of the axon in recording position. B, low spatial resolution fluorescence image of the axon obtained by CCD used for Vm imaging. C, AP signals from 10 locations indicated by yellow rectangles, each 10 μm in length. D, soma–axon latency to 30% (grey) and 50% (black) AP amplitude as a function of distance from the cell body. The first minimum identifies the location and length of the spike TZ. E, time sequence of frames showing spatial profile of colour coded relative Vm amplitude in the axon at four characteristic time points: 0 μs – AP initiation at TZ; 45 μs and 80 μs – invasion of the first node; 240 μs – peak depolarization. F, comparison of AP signals from four characteristic locations on an expanded time scale. The measured data points and cubic spline interpolation curves are shown. Red traces – TZ and first node; green dashed trace – axon hillock; green trace – 1st internodal region. Membrane potential colour scale shown on left.
An alternative way to derive the same information from the data is to analyse a time sequence of frames showing the spatial maps of AP amplitude (Fig. 5E). To generate this display, a relative colour scale was applied separately to each optical channel (pixel) as shown in Fig. 5F. To make the use of the relative scale possible, we applied a mask that revealed only detectors to which the image of the axon was projected. The result of this analysis was a temporal series of individual frames separated by 10 μs, each showing the spatial map of membrane potential at one point in time. In Fig. 5E, four frames from this series were selected to illustrate characteristic regions along the axon that can be clearly identified during AP initiation. The red region closest to the soma was the first to cross the threshold value and reach 50% amplitude (time point 0 μs) and was identified as the AP TZ. The more distal red region appearing with a delay (45 μs time point) is likely to be the first node of Ranvier, corresponding to the issuance of an axon collateral, as indicated in the high resolution image in Fig. 5A. The same data are shown in Fig. 5F as AP signals scaled to the same height and compared on an expanded time scale. The two red traces show AP signals from the two red areas in Fig. 5E corresponding to the spike TZ and the first node. The green dashed trace is the AP signal from the axon hillock. The green trace is the AP signal from the first internodal region. The delay versus distance plot and the colour-coded display, as well as the comparison of AP signals on an expanded time scale, all indicate that the depolarizing wave reached the first node of Ranvier with a delay of 45 μs from its initiation in the spike TZ. The entire axonal section of about 130 μm was depolarized to the peak of the AP (yellow in Fig. 5E) within 240 μs. In agreement with the argument illustrated in Fig. 4C, the location and length of the TZ shown in Fig. 5 was not dependent on the sensitivity of recording after S/N of ∼7 was reached. Figure 6 illustrates how further increase in sensitivity by additional averaging did not alter the recorded location and length of the TZ. These two parameters, measured for spikes evoked by a brief (2 ms) depolarizing current pulse delivered from an electrode to the cell body, were determined in 20 neurons. The mean length of the TZ was 16.5 ± 1.1 μm with the mean centre located at 28.9 ± 1.0 μm from the edge of the soma.
Figure 6. Increase in sensitivity of optical recording above S/N of ∼7 does not alter the recorded length and location of the spike TZ.
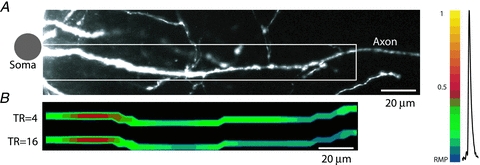
A, high resolution confocal image of the axon in recording position. B, spatial profile of colour coded relative Vm amplitude in the axon identifies location and length of the spike TZ at two levels of sensitivity (4 trials averaged; S/N = 7 and 14 trials averaged; S/N = 14). No significant difference was found. Membrane potential colour scale shown on right.
TZ location and length as a function of stimulus characteristics
Previous studies have shown that cortical pyramidal neurons have a dynamic voltage threshold for AP initiation. For example, a rapid rise in somatic voltage (Vsoma) causes spike initiation at a low voltage, whereas a slow rise leads to a higher threshold (Wilent & Contreras, 2005; Farries et al. 2010). We examined whether the location and length of the spike TZ are stable in a given neuron. Alternatively, these parameters could be a function of stimulus characteristics. In a series of measurements, the location and length of the TZ for spikes evoked by a short (2 ms) depolarizing current pulse were compared, in the same neuron (n = 3 neurons), to spikes evoked by a longer (20 ms) stimulus adjusted in amplitude to evoke an AP during prolonged depolarization with a delay of approximately 15 ms (Fig. 7). Although we found a difference in action potential threshold measured in the soma as a minimal depolarization necessary to evoke a spike (short pulse: 20.2 ± 0.5 mV vs. long pulse: 23.3 ± 0.3 mV; P < 0.01; n = 16 measurements from 3 neurons), we did not find significant changes in spike TZ location and length for spikes elicited with short or long pulses (see below). In another series of measurements the control location and length of the TZ for spikes evoked by a short depolarizing current pulse were compared, in the same neuron (n = 3 neurons), to spikes evoked by localized activation of excitatory synapses on basal dendrites using an extracellular stimulating electrode (Fig. 8). The action potential threshold for synaptically evoked spikes was 20.8 ± 0.4 mV, not different from the control (short pulse) measurement (P > 0.2; n = 16 measurements from 3 neurons). The TZ location and length also remained unaltered. Compared to the control (short pulse) measurements normalized to 1, the TZ location and length for long pulses were determined to be 1.04 ± 0.1 and 1.07 ± 0.1, respectively. For synaptic stimulation, these values were 1.06 ± 0.1 and 0.94 ± 0.1. None of these values were significantly different from the control results with P > 0.3 in all cases.
Figure 7. Location and length of the TZ are independent of stimulus duration.
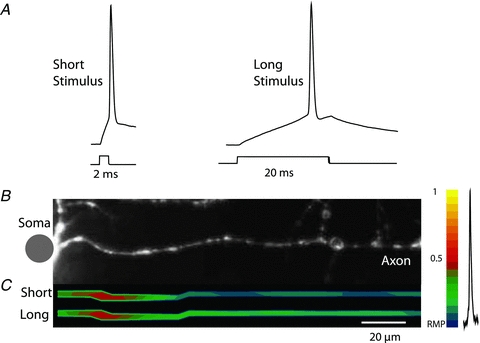
A, electrical recordings of APs evoked by short (2 ms) and long (20 ms) current pulse. B, high resolution confocal image of the axon in recording position. Bubles on the axon are artefacts from photo-damage from confocal imaging at the end of experiment. C, spatial profile of colour coded relative Vm amplitude in the axon identifies location and length of the initiation site for APs evoked by short and long depolarizing current pulse. No significant difference was found. Membrane potential colour scale shown on right.
Figure 8. Location and length of the TZ are similar for APs evoked by somatic current pulse and by synaptic stimulation.
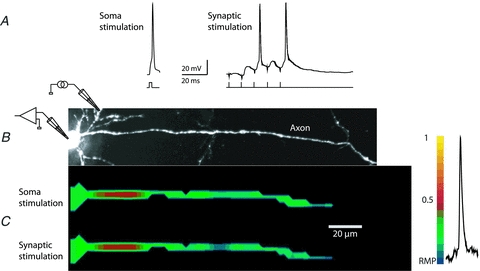
A, electrical recordings of APs evoked by short current pulse and by synaptic input. B, high resolution confocal image of the axon in recording position. Intracellular stimulating electrode in the soma and extracellular stimulating electrode for localized activation of synapses on basal dendrites are indicated schematically. C, spatial profile of colour coded relative Vm amplitude in the axon identifies the location and length of the initiation site for APs evoked by short depolarizing current pulse and by synaptic stimulation. No significant difference was found. Membrane potential colour scale shown on right.
AP propagation in myelinated and unmyelinated axons
Vm imaging can be used to analyse the spatial pattern of AP propagation as revealed by monitoring transmembrane potential over longer sections of individual myelinated axons. Previously, this information was not available for any neuron. A representative experiment (well stained neuron characterized by long axons in one plane of focus close to the surface of the slice) is illustrated in Fig. 9. The spatial plot of the soma–axon latency along an axonal section of approximately 300 μm clearly identified the position of the spike TZ and putative nodes of Ranvier, all characterized by localized reduction in soma–axon latency typical for saltatory conduction (Fig. 9A). It is likely that the internodal regions, invaded by the depolarizing wave with a delay, were myelinated (see Discussion). The spatial plot of AP latency provides a functional readout for the position of the nodes of Ranvier. In this experiment the AP onset latency between the spike TZ and the first node was ∼30 μs while the latency between the first and the second node was too short to be resolved with 10 μs temporal resolution. The third node was invaded with a delay of 60 μs relative to the spike TZ. The summary data showed that the AP propagation velocity determined between the spike TZ and the soma was 0.5 ± 0.08 m s−1 (n = 15), between the spike TZ and the first node was 0.97 ± 0.16 m s−1 (n = 15), between the 1st and the 2nd node was 2.1 ± 0.4 m s−1 (n = 6) and between the 2nd and the 3rd was 4.5 ± 2.3 m s−1 (n = 2).
Figure 9. Spatial pattern of AP initiation and propagation in an individual axon.
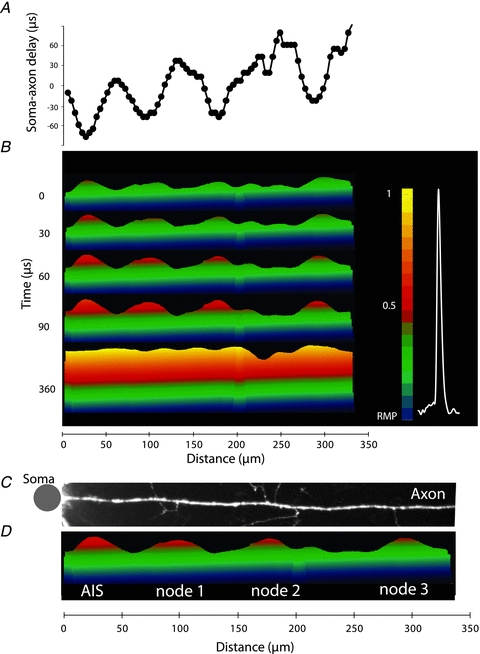
A, soma–axon latency to 50% AP amplitude as a function of distance from the soma. B, time sequence of frames showing spatial profile of colour coded relative Vm amplitude in the axon at five characteristic points in time: 0 μs – AP initiation at TZ; 30, 60 and 90 μs – invasion of the nodes; 360 μs – the peak depolarization. Membrane potential colour scale shown on right. C,D. Alignment of image of the axon, showing axonal collaterals, and membrane potential changes at spike initiation. Note that each point of issuance of an axon collateral appears functionally to be a node of Ranvier. Grey dot denotes the location of the soma. See Supplementary Movie 1.
Figure 9B shows the initiation and the propagation of an AP as revealed by a time sequence of the colour-coded spatial maps of the depolarizing AP wave. The time sequence of spatial maps shows the colour coded representation of the relative Vm amplitude on the y-axes (omitted for clarity) at five characteristic points in time – spike initiation at time 0, the gradual invasion of the three putative nodes of Ranvier during the following 90 μs, and the peak depolarization at 360 μs. It is noteworthy that the entire section of the axon, about 300 μm in length, is invaded by the peak of the AP depolarization wave within a fraction of a millisecond from the time the Vm threshold for excitation was reached. Figure 9C and D illustrates the clear correlation between the positions of the putative nodes of Ranvier determined by functional imaging with anatomical data showing axonal regions that give rise to collaterals (branch points) (see Supplementary Movie 1).
To test for the assumption that the internodal regions invaded by an AP with a delay are myelinated, we carried out similar measurements from axons of newborn mice (P5–P7), which lack myelination at this stage of development (Rasband et al. 1999; Oh et al. 2003). In contrast to the myelinated axons, the propagation of the AP in unmyelinated axons was clearly monotonic with no evidence for saltatory conduction. A typical example in Fig. 10 illustrates a monotonic spread of the AP depolarizing wave along the unmyelinated axon (see Supplementary Movie 2). In unmyelinated axons, the initiation of the first AP was restricted to an area of 13.9 ± 2.4 μm in length with its centre located 25 ± 3.7 μm distal to the edge of the soma (n = 7). These values obtained, from newborn mice, suggesting a trend toward smaller and more proximally localized spike TZ. However, these values are not differ significantly from those obtained in mature, myelinated axons.
The optical data contain detailed spatiotemporal information on membrane potential signalling in the axon. Previously, this information was not available and comparative data could be generated only by numerical simulations. To obtain a more complete insight into the dynamics of these processes, we constructed a 3D plot of the membrane potential as a function of space and time for a myelinated (Fig. 11A–D) and an unmyelinated axon (Fig. 11E). Figure 11A–C indicates how the 3D plot shown in Fig. 11A was rotated to assume the perspective illustrated in Fig. 11D and E. The 3D plot illustrates the striking differences in the dynamic membrane potential spatial maps during saltatory AP propagation in myelinated axons and monotonic AP propagation in unmyelinated axons. Probably the most convenient format for visualizing the entire process of spike initiation and propagation is a movie (Supplementary Movies 1 and 2).
Figure 11. The colour coded map of axonal membrane potential plotted as a function of time and space during 1500 μs of AP initiation and propagation.
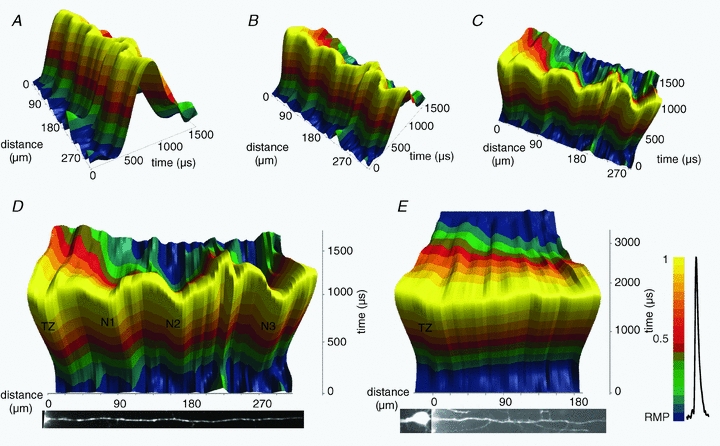
A–C, rotation of the 3D plot indicating how the projections in D and E were constructed. D, spike initiation and propagation in a myelinated axon. E, spike initiation and propagation in an unmyelinated axon. Membrane potential colour scale shown on right.
AP TZ is stable during repetitive firing
In the next series of experiments we explored the spatial stability of the spike TZ during high frequency repetitive firing. These measurements required single trial resolution because it was not possible to use temporal averaging without confirmation that the complex evoked response was the same in each individual trial. Figure 12 illustrates results from a typical experiment. A neuron was stimulated by a train of brief (0.5 ms) suprathreshold transmembrane current pulses delivered from the somatic patch pipette at a frequency of 150 Hz. This frequency was selected because it is close to the highest firing rate recorded under physiological conditions in vivo (de Kock et al. 2007; Grewe et al. 2010). A train of evoke APs was monitored by an electrode in the soma and optically from the proximal axonal region. The axonal region in the recording position was approximately 300 μm in length and included the spike TZ and one or two nodes of Ranvier. To determine whether every AP in a train was initiated at the spike TZ or the initiation site sometimes moved to the nodes, the AP signals from the spike TZ and from the first node recorded in single trials were compared on an expanded time scale (Fig. 12C). The results from 47 measurements from n = 6 neurons showed that the total of 282 spikes generated in short bursts invariably initiated in the spike TZ. It was, however, not possible to demonstrate consistent and statistically significant differences in the spike TZ-to-first node latency for different spikes in the train.
Action potentials propagate without failure
The voltage imaging technique provided a unique tool to explore possible AP initiation and/or propagation failures at the spike TZ and at the axonal branch points during discharges of different frequencies. We first determined, by monitoring the proximal axon, the highest instantaneous spike frequency that the main axon was able to support. A pair of APs was initiated by two closely spaced depolarizing current pulses 0.5 ms in duration delivered with a variable interstimulus interval from a patch electrode in the soma. The evoked spikes were monitored optically from the AIS (Fig. 13). When the interval between the onset times of the two pulses was 2.5 ms (firing frequency of 400 Hz) or longer, the two evoked and optically recorded APs consistently had similar characteristics in the axon. With the shorter interstimulus interval (1.5 to 2 ms) the second AP failed to initiate in the TZ in about 50% of cases. Summary data showed that the mean upper limit for high frequency firing in the AIS was 590 ± 30 Hz (n = 10). This value is a function of the duration of the action potential and its afterhyperpolarization which determines the relative and absolute refractory period of the excitable membrane (Hasenstaub et al. 2005).
Figure 13. Upper limit in spike discharge frequency.
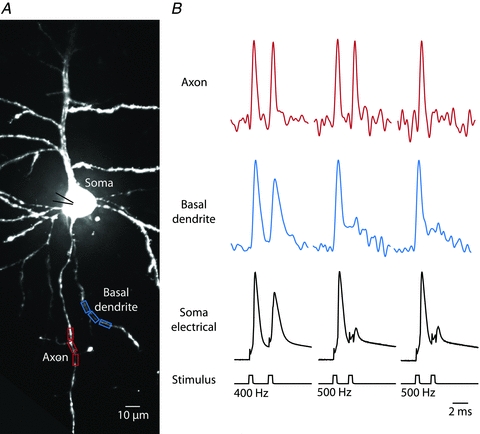
A, fluorescence confocal image of a dye loaded L5 pyramidal neuron; the soma, basal, apical and oblique dendrites, as well as the proximal part of the axon, are clearly visible. Recording sites marked by red rectangles (axon) and blue rectangles (basal dendrite). B, AP signals in response to a pair of depolarizing current pulses delivered to the soma at different frequencies. Both axon and basal dendrite reliably follow instantaneous spiking frequencies of 400 Hz. At 500 Hz the second AP fails to initiate in about 50% of trials. When initiated, the second AP consistently failed in the basal dendrite.
Following these experiments, we examined the reliability of AP propagation from the spike TZ into the main axon and its collaterals (118 measurements from different areas of the axonal arbour obtained from n = 7 neurons). Typically, the main axon of L5 cortical pyramidal neurons gives rise to several primary collaterals within the first 300 μm of its proximal region (Debanne, 2004). The primary collaterals, as a rule, give rise to secondary, tertiary and higher order collaterals which constitute an elaborate axonal branching structure (e.g. Binzegger et al. 2004, 2007). Optical recordings of a total of 1770 APs from the main axon and collaterals revealed that the propagation of APs was reliable for all frequencies of firing supported by the spike TZ. For all 1770 APs, every spike that initiated at the spike TZ was reliably propagated into every part of the monitored axonal arbour. Figure 14 illustrates a successful propagation of a train of 15 APs evoked at the frequency of 400 Hz.
Figure 14. Reliability of AP propagation in the axonal arbour.
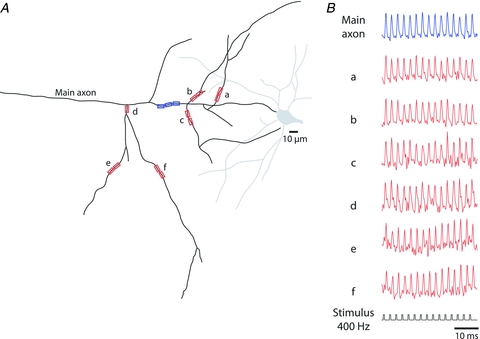
A, a schematic representation of the axonal arbour reconstructed from a confocal image of a L5 pyramidal neuron loaded with the voltage-sensitive dye. Seven recording locations on the main axon and several collaterals are indicated by blue and red rectangles. B, a typical optical recordings of a train of APs evoked at 400 Hz from multiple locations on the axonal arbour. No evidence for AP failures was found.
Discussion
The principal findings of our study are based on the optical readout of the dynamic spatial profile of the membrane potential along individual axons. This approach allowed us to determine the location and length of the spike TZ in the AIS of pyramidal neurons, as defined in functional terms. In addition, we characterized the AP propagation pattern in the main axon and collaterals. It is plausible to predict that this approach will facilitate the analysis of signal interactions underlying input–output transformations carried out in neuronal processes of different classes of nerve cells.
Size and position of the trigger zone – functional implications
The exact position of the spike TZ in the AIS of layer 5 cortical neurons reported here is consistent with the data obtained in prior Vm imaging (Palmer & Stuart, 2006) and electrophysiological studies (Meeks & Mennerick, 2007; Shu et al. 2007; Kole et al. 2007, 2008). Two recent studies on Purkinje cells employing Vm imaging (Foust et al. 2010; Palmer et al. 2010) found that the spike TZ is also located in the AIS, albeit at a more proximal location. In most of the prior reports, the location of the first regenerative response was characterized by a single parameter – the distance from the soma. While the exact length of the site of initiation has been difficult to determine using conventional electrophysiological methods, the combination of extracellular electrode recordings and numerical simulations suggested that the spike TZ is a region extending from 10 to 100 μm from the soma in unmyelinated fibres (Meeks & Mennerick, 2007). The question of TZ dimensions is of fundamental importance because the size of the initiation site is a critical functional parameter. Successful initiation and propagation of the action potential wave requires that a certain length of an axon is brought to threshold for excitation to generate an action current large enough to propagate. This follows from intuitive considerations, from the classical theory (Rushton, 1937), as well as from more recent experimental studies (Colbert & Pan, 2002; Meeks & Mennerick, 2007). Additionally, Na+ channel clustering in the axon, which is critical in determining the spike TZ location and length, serves an important specific function in tuning neuronal computation underlying a well defined function (sound localization) in auditory neurons (Carr & Boudreau, 1993; Kuba et al. 2006; Kuba & Ohmori, 2009). These findings advocate that the size and position of the spike TZ might be cell specific in other central neurons, depending on their function. Additionally, new data (Kuba et al. 2010; Grubb & Burrone, 2010) show that the structure (and, by extrapolation, the function) of the spike TZ participates in neuronal plasticity and might, in fact, be one of the key factors controlling neuronal excitability and computation (Grubb & Burrone, 2010; Kuba et al. 2010; Rasband, 2010). Our results provide direct evidence on location and length of the spike TZ in layer 5 pyramidal neurons and describe an experimental protocol to monitor these parameters in other cell types and under different conditions.
Our data show that the spike TZ, defined in functional terms, is a subsection of the AIS characterized by a mean length of ∼16 μm with its centre positioned ∼30 μm from the edge of the soma. This experimental result substantiates earlier suggestions from modelling studies (Colbert & Pan, 2002; Meeks & Mennerick, 2007) that it is more correct to think of a region of initiation rather than a discrete site. The measured size and position of the TZ indicate that spike initiation occurs in the distal half of the 40–50 μm long AIS, as predicted by an early modelling study (Mainen et al. 1995). We envision that with each action potential there is a unique spatiotemporal pattern to Na+ channel opening within this region, with a statistical distribution in which the average point of initiation over several action potentials is approximately 30 μm from the soma. With the initiation of each action potential, Na+ (and K+, Ca2+) ion channels open throughout the region over time, with nearby channels not necessarily opening in sequence. Each action potential can be thought of as initiating at the ‘centre of mass’ of the Na+ channels that are open when threshold is reached, with this exact location varying over the TZ from action potential to action potential, depending upon conditions within the neuron as well as prior experience of the cell. The shallow nature of the probability of Na+ channel opening as a function of Vm at threshold insures that a significant portion of the TZ will experience a similar membrane potential at this critical juncture in action potential generation. Thus, the entire ∼20 μm length of the TZ is likely to be very nearly isopotential when invaded by the front of a depolarizing wave of threshold amplitude, as recorded in our experiments (also see modelling prediction in Colbert & Pan, 2002; their Fig. 4a).
Relationship to immunohistochemistry data (function vs. structure)
The exact position and length of the AP initiation zone is not simply a reflection of the density of Na+ channels (Hu et al. 2009; Fleidervish et al. 2010; Johnston, 2010). The precise location of the action potential TZ depends not only on the density and properties of multiple subtypes of Na+ channel (particularly Nav1.6 and Nav1.2; Hu et al. 2009), but also the properties and distribution of K+, Ca2+ and Ca2+-activated K+ channels (Shu et al. 2007; Kole et al. 2007, 2008; Yu et al. 2010). In addition to channel density and distribution, the electrotonic structure of the neuron will also make a significant contribution (Mainen et al. 1995; Colbert & Pan, 2002; Kress et al. 2010). Thus, it is not surprising that structural data showing uniform distribution of pan-sodium channels along the entire proximal axon (including the hillock and the AIS) of layer-5 pyramidal neurons, obtained by fluorescence immunohistochemistry, cannot be directly extrapolated to deduce the site of spike initiation (Lorincz & Nusser, 2008; Kole et al. 2008; Hu et al. 2009).
Spatiotemporal profile of AP Initiation
Our results demonstrate that it is possible to obtain an extensive spatiotemporal profile of Vm during the initiation and propagation of action potentials using Vm imaging. Thus, the optical approach removes a critical limitation in studying electrical events in neuronal processes using conventional microelectrodes. The long-standing drawback in electrode measurement is that it reports Vm changes from a single location on a neuron, while the electrical behaviour of other parts of the cell remains uncertain. Using several electrodes attached to the soma and dendrites alleviates this problem, albeit only partially (e.g. Stuart & Sakmann, 1994; Larkum et al. 2001). It is clear that microelectrodes cannot fulfil the need for high spatial resolution recording from neuronal processes. The optical approach overcomes this limitation and, when linked to a numerical simulation, is likely to facilitate further understand of signal integration and plasticity mediated by axons and dendrites.
AP initiation and/or propagation failure
Communication between cortical neurons is probabilistic, with the initiation of action potentials resulting in the activation of postsynaptic potentials on only a fraction of trials. One possibility is that ‘failures’ of synaptic transmission result from the inability of some action potentials to invade presynaptic terminals (Debanne, 2004). Direct tests of axonal conduction failures in axon collaterals, or at branch points, in the mammalian brain have been difficult to obtain because of their small size and low spatial resolution of electrode measurements. Previously, calcium imaging has been used to investigate these questions in neocortical slices (Cox et al. 2000; Koester & Sakmann, 2000). The main limitation of this approach is that Ca2+ signals are slow and secondary to membrane potential transients. Thus, the interpretation of the results is not straightforward. Notwithstanding these limitations, the data obtained through Ca2+ imaging argue that APs reliably invade the axonal arbours of neocortical pyramidal neurons (Cox et al. 2000; Koester & Sakmann, 2000).
A different approach based on Vm imaging from axons of invertebrate neurons (Antic et al. 2000) introduced a direct way to analyse the reliability of AP initiation and propagation. In mammalian Purkinje cells investigations in our laboratories by the same imaging technique used here showed that, at discharge frequencies of less than ∼250 Hz, spikes propagated faithfully through the axon and axon collaterals (Foust et al. 2010). Propagation failures in a small percentage of trials were only observed for discharge frequencies higher than naturally occur in awake behaving animals, or for the spikelets associated with complex spikes. In the present study, the results showed that the propagation of APs from the main axon and collaterals was reliable for all frequencies of firing supported by the spike TZ. Because the physiological AP patterns of layer-5 pyramidal neurons recorded in vivo are relatively short bursts of impulses at the firing rates in the range of 1–200 Hz (Manns et al. 2004; de Kock et al. 2007; Grewe et al. 2010) we conclude that failures of propagation of spike activity along the main, myelinated axon and unmyelinated axon collaterals are likely to be either rare or non-existent under normal conditions. The failures of synaptic transmission are likely to represent true failures to release synaptic vesicles, rather than failure of the action potential to invade axon collaterals and en passant synaptic terminals.
Acknowledgments
We are grateful to Larry Cohen for useful discussions and to Leslie M. Loew and Joseph P. Wuskell (Center for Cell Analysis and Modeling, UConn Health Center, Farmington, CT 06030, USA) for kindly providing dyes. This work was supported by NIH (D.A.M. and D.Z.) and NSF (D.Z.), by an NSF graduate research fellowship (A.J.F.) and by the Kavli Institute for Neuroscience at Yale.
Glossary
Abbreviations
- AP
action potential
- AIS
axon initial segment
- DIC
differential interference contrast
- SHG
second harmonic generation
- TZ
trigger zone
- Vm
membrane potential
Author contributions
Conception and design of the experiments: M.A.P., A.J.F., D.A.M. and D.Z.; collection of data: M.A.P. and A.J.F.; analysis and interpretation of data: M.A.P., A.J.F., D.A.M. and D.Z.; drafting and revising the manuscript: M.A.P., A.J.F., D.A.M. and D.Z. All authors approved the final version of the manuscript.
Supplementary material
Supplementary Figure S1
Supplementary Movie 1
Supplementary Movie 2
As a service to our authors and readers, this journal provides supporting information supplied by the authors. Such materials are peer-reviewed and may be re-organized for online delivery, but are not copy-edited or typeset. Technical support issues arising from supporting information (other than missing files) should be addressed to the authors
References
- Antic SD. Action potentials in basal and oblique dendrites of rat neocortical pyramidal neurons. J Physiol. 2003;550:35–50. doi: 10.1113/jphysiol.2002.033746. [DOI] [PMC free article] [PubMed] [Google Scholar]
- Antic S, Zecevic D. Optical signals from neurons with internally applied voltage-sensitive dyes. J Neurosci. 1995;15:1392–1405. doi: 10.1523/JNEUROSCI.15-02-01392.1995. [DOI] [PMC free article] [PubMed] [Google Scholar]
- Antic S, Major G, Zecevic D. Fast optical recordings of membrane potential changes from dendrites of pyramidal neurons. J Neurophysiol. 1999;82:1615–1621. doi: 10.1152/jn.1999.82.3.1615. [DOI] [PubMed] [Google Scholar]
- Antic S, Wuskell JP, Loew L, Zecevic D. Functional profile of the giant metacerebral neuron of Helix aspersa: temporal and spatial dynamics of electrical activity in situ. J Physiol. 2000;527:55–69. doi: 10.1111/j.1469-7793.2000.00055.x. [DOI] [PMC free article] [PubMed] [Google Scholar]
- Binzegger T, Douglas RJ, Martin KA. Axons in cat visual cortex are topologically self-similar. Cereb Cortex. 2004;15:152–165. doi: 10.1093/cercor/bhh118. [DOI] [PubMed] [Google Scholar]
- Binzegger T, Douglas RJ, Martin KA. Stereotypical bouton clustering of individual neurons in cat primary visual cortex. J Neurosci. 2007;27:12 242–12 254. doi: 10.1523/JNEUROSCI.3753-07.2007. [DOI] [PMC free article] [PubMed] [Google Scholar]
- Blunck R, Chanda B, Bezanilla F. Nano to micro – fluorescence measurements of electric fields in molecules and genetically specified neurons. J Membr Biol. 2005;208:91–102. doi: 10.1007/s00232-005-0822-z. [DOI] [PubMed] [Google Scholar]
- Canepari M, Willadt S, Zecevic D, Vogt KE. Iimaging inhibitory synaptic potentials using voltage sensitive dyes. Biophysical J. 2010;98:2032–2040. doi: 10.1016/j.bpj.2010.01.024. [DOI] [PMC free article] [PubMed] [Google Scholar]
- Canepari M, Djurisic M, Zecevic D. Dendritic signals from rat hippocampal CA1 pyramidal neurons during coincident pre- and post-synaptic activity: a combined voltage and calcium imaging study. J Physiol. 2007;580:463–484. doi: 10.1113/jphysiol.2006.125005. [DOI] [PMC free article] [PubMed] [Google Scholar]
- Carr CE, Boudreau RE. An axon with a myelinated initial segment in the bird auditory system. Brain Research. 1993;628:330–334. doi: 10.1016/0006-8993(93)90975-s. [DOI] [PubMed] [Google Scholar]
- Colbert CM, Johnston D. Axonal action-potential initiation and Na+ channel densities in the soma and axon initial segment of subicular pyramidal neurons. J Neurosci. 1996;16:6676–6686. doi: 10.1523/JNEUROSCI.16-21-06676.1996. [DOI] [PMC free article] [PubMed] [Google Scholar]
- Colbert CM, Pan E. Ion channel properties underlying axonal action potential initiation in pyramidal neurons. Nat Neurosci. 2002;5:533–538. doi: 10.1038/nn0602-857. [DOI] [PubMed] [Google Scholar]
- Cox CL, Denk W, Tank DW, Svoboda K. Action potentials reliably invade axonal arbors of rat neocortical neurons. Proc Natl Acad Sci U S A. 2000;97:9724–9728. doi: 10.1073/pnas.170278697. [DOI] [PMC free article] [PubMed] [Google Scholar]
- de Kock CP, Bruno R, Spors H, Sakmann B. Layer- and cell-type-specific suprathreshold stimulus representation in rat primary somatosensory cortex. J Physiol. 2007;581:139–154. doi: 10.1113/jphysiol.2006.124321. [DOI] [PMC free article] [PubMed] [Google Scholar]
- Debanne D. Information processing in the axon. Nat Rev Neurosci. 2004;5:304–316. doi: 10.1038/nrn1397. [DOI] [PubMed] [Google Scholar]
- Djurisic M, Antic S, Chen WR, Zecevic D. Voltage imaging from dendrites of mitral cells: EPSP attenuation and spike trigger zones. J Neurosci. 2004;24:6703–6714. doi: 10.1523/JNEUROSCI.0307-04.2004. [DOI] [PMC free article] [PubMed] [Google Scholar]
- Djurisic M, Popovic M, Carnevale N, Zecevic D. Functional structure of the mitral cell dendritic tuft in the rat olfactory bulb. J Neurosci. 2008;28:4057–4068. doi: 10.1523/JNEUROSCI.5296-07.2008. [DOI] [PMC free article] [PubMed] [Google Scholar]
- Dombeck DA, Sacconi L, Blanchard-Desce M, Webb WW. Optical recording of fast neuronal membrane potential transients in acute mammalian brain slices by second-harmonic generation microscopy. J Neurophysiol. 2005;94:3628–3636. doi: 10.1152/jn.00416.2005. [DOI] [PubMed] [Google Scholar]
- Drummond GB. Reporting ethical matters in The Journal of Physiology: standards and advice. J Physiol. 2009;587:713–719. doi: 10.1113/jphysiol.2008.167387. [DOI] [PMC free article] [PubMed] [Google Scholar]
- Farries MA, Kita H, Wilson CJ. Dynamic spike threshold and zero membrane slope conductance shape the response of subthalamic neurons to cortical input. J Neurosci. 2010;30:13 180–13 191. doi: 10.1523/JNEUROSCI.1909-10.2010. [DOI] [PMC free article] [PubMed] [Google Scholar]
- Fleidervish IA, Lasser-Ross N, Gutnick MJ, Ross WN. Na+ imaging reveals little difference in action potential-evoked Na+ influx between axon and soma. Nat Neurosci. 2010;13:852–860. doi: 10.1038/nn.2574. [DOI] [PMC free article] [PubMed] [Google Scholar]
- Foust A, Popovic M, Zecevic D, McCormick DA. Action potentials initiate in the axon initial segment and propagate through axon collaterals reliably in cerebellar purkinje neurons. J Neurosci. 2010;30:6891–6902. doi: 10.1523/JNEUROSCI.0552-10.2010. [DOI] [PMC free article] [PubMed] [Google Scholar]
- Gonzalez RC, Woods RE. Digital Image Processing. 3rd edn. Reading, MA: Addison-Wesley; 1992. [Google Scholar]
- Grinvald A, Hildesheim R, Farber IC, Anglister L. Improved fluorescent probes for the measurement of rapid changes in membrane potential. Biophys J. 1982;39:301–308. doi: 10.1016/S0006-3495(82)84520-7. [DOI] [PMC free article] [PubMed] [Google Scholar]
- Grubb MS, Burrone J. Activity-dependent relocation of the axon initial segment fine-tunes neuronal excitability. Nature. 2010;465:1070–1074. doi: 10.1038/nature09160. [DOI] [PMC free article] [PubMed] [Google Scholar]
- Grewe BF, Bonnan A, Frick A. Back-propagation of physiological action potential output in dendrites of slender-tufted L5A pyramidal neurons. Front Cell Neurosci. 2010;4:1–11. doi: 10.3389/fncel.2010.00013. [DOI] [PMC free article] [PubMed] [Google Scholar]
- Hasenstaub A, Shu Y, Haider B, Kraushaar U, Duque A, McCormick DA. Inhibitory postsynaptic potentials carry synchronized frequency information in active cortical networks. Neuron. 2005;47:423–435. doi: 10.1016/j.neuron.2005.06.016. [DOI] [PubMed] [Google Scholar]
- Holthoff K, Zecevic D, Konnerth A. Rapid time-course of action potentials in spines and remote dendrites of mouse visual cortical neurons. J Physiol. 2010;588:1085–1096. doi: 10.1113/jphysiol.2009.184960. [DOI] [PMC free article] [PubMed] [Google Scholar]
- Hu W, Tian C, Li T, Yang M, Hou H, Shu Y. Distinct contributions of Nav1.6 and Nav1.2 in action potential initiation and backpropagation. Nat Neurosci. 2009;12:996–1002. doi: 10.1038/nn.2359. [DOI] [PubMed] [Google Scholar]
- Iwasato T, Datwani A, Wolf AM, Nishiyama H, Taguchi Y, Tonegawa S, Knöpfel T, Erzurumlu RS, Itohara S. Cortex-restricted disruption of NMDAR1 impairs neuronal patterns in the barrel cortex. Nature. 2000;406:726–731. doi: 10.1038/35021059. [DOI] [PMC free article] [PubMed] [Google Scholar]
- Johnston D. The Na+ channel conundrum: axon structure versus function. Nat Neurosci. 2010;13:784–785. doi: 10.1038/nn0710-784. [DOI] [PubMed] [Google Scholar]
- Kerr JN, Denk W. Imaging in vivo: watching the brain in action. Nat Rev Neurosci. 2008;9:195–205. doi: 10.1038/nrn2338. [DOI] [PubMed] [Google Scholar]
- Khaliq ZM, Raman IM. Relative contributions of axonal and somatic Na+ channels to action potential initiation in cerebellar Purkinje neurons. J Neurosci. 2006;26:1935–1944. doi: 10.1523/JNEUROSCI.4664-05.2006. [DOI] [PMC free article] [PubMed] [Google Scholar]
- Koester HJ, Sakmann B. Calcium dynamics associated with action potentials in single nerve terminals of pyramidal cells in layer 2/3 of the young rat neocortex. J Physiol. 2000;529:625–646. doi: 10.1111/j.1469-7793.2000.00625.x. [DOI] [PMC free article] [PubMed] [Google Scholar]
- Kole MHP, Letzkus JJ, Stuart GJ. Axon initial segment Kv1 channels control axonal action potential waveform and synaptic efficacy. Neuron. 2007;55:633–647. doi: 10.1016/j.neuron.2007.07.031. [DOI] [PubMed] [Google Scholar]
- Kole MHP, Ilschner SU, Kampa BM, Williams SR, Ruben PC, Stuart GJ. Action potential generation requires a high sodium channel density in the axon initial segment. Nat Neurosci. 2008;11:178–186. doi: 10.1038/nn2040. [DOI] [PubMed] [Google Scholar]
- Kress GJ, Dowling MJ, Eisenman LN, Mennerick S. Axonal sodium channel distribution shapes the depolarized action potential threshold of dentate granule neurons. Hippocampus. 2010;20:558–571. doi: 10.1002/hipo.20667. [DOI] [PMC free article] [PubMed] [Google Scholar]
- Kuba H, Ishii TM, Ohmori H. Axonal site of spike initiation enhances auditory coincidence detection. Nature. 2006;444:1069–1072. doi: 10.1038/nature05347. [DOI] [PubMed] [Google Scholar]
- Kuba H, Ohmori H. Roles of axonal sodium channels in precise auditory time coding at nucleus magnocellularis of the chick. J Physiol. 2009;587:87–100. doi: 10.1113/jphysiol.2008.162651. [DOI] [PMC free article] [PubMed] [Google Scholar]
- Kuba H, Oichi Y, Ohmori H. Presynaptic activity regulates Na1 channel distribution at the axon initial segment. Nature. 2010;465:1075–1078. doi: 10.1038/nature09087. [DOI] [PubMed] [Google Scholar]
- Kuhn B, Fromherz P, Denk W. High sensitivity of Stark-shift voltage-sensing dyes by one- or two-photon excitation near the red spectral edge. Biophys J. 2004;87:631–639. doi: 10.1529/biophysj.104.040477. [DOI] [PMC free article] [PubMed] [Google Scholar]
- Larkum ME, Zhu J, Sakmann B. Dendritic mechanisms underlying the coupling of the dendritic with the axonal action potential initiation zone of adult rat layer 5 pyramidal neurons. J Physiol. 2001;533:447–466. doi: 10.1111/j.1469-7793.2001.0447a.x. [DOI] [PMC free article] [PubMed] [Google Scholar]
- Loew LM. Design and characterization of electrochromic membrane probes. J Biochem Biophys Methods. 1982;3:243–260. doi: 10.1016/0165-022x(82)90047-1. [DOI] [PubMed] [Google Scholar]
- Lorincz A, Nusser Z. Cell-type-dependent molecular composition of the axon initial segment. J Neurosci. 2008;28:14 329–14 340. doi: 10.1523/JNEUROSCI.4833-08.2008. [DOI] [PMC free article] [PubMed] [Google Scholar]
- Mainen ZF, Joerges J, Huguenard JR, Sejnowski TJ. A model of spike initiation in neocortical pyramidal neurons. Neuron. 1995;15:1427–1439. doi: 10.1016/0896-6273(95)90020-9. [DOI] [PubMed] [Google Scholar]
- Malmstadt H, Enke CG, Grouch SR. Electronic Measurements for Scientists. Menlo Park, CA: W. A. Benjamin; 1974. [Google Scholar]
- Manns ID, Sakmann B, Brecht M. Sub- and suprathreshold receptive field properties of pyramidal neurones in layers 5A and 5B of rat somatosensory barrel cortex. J Physiol. 2004;556:601–622. doi: 10.1113/jphysiol.2003.053132. [DOI] [PMC free article] [PubMed] [Google Scholar]
- Matsukawa H, Wolf AM, Matsushita S, Joho RH, Knöpfel T. Motor dysfunction and altered synaptic transmission at the parallel fiber-purkinje cell synapse in mice lacking potassium channels Kv3.1 and Kv3.3. J Neurosci. 2003;23:7677–7684. doi: 10.1523/JNEUROSCI.23-20-07677.2003. [DOI] [PMC free article] [PubMed] [Google Scholar]
- Marquardt D. An algorithm for least-squares estimation of nonlinear parameters. SIAM Journal on Applied Mathematics. 1963;11:431–441. [Google Scholar]
- Meeks JP, Mennerick S. Action potential initiation and propagation in CA3 pyramidal axons. J Neurophysiol. 2007;97:3460–3472. doi: 10.1152/jn.01288.2006. [DOI] [PubMed] [Google Scholar]
- Mathews JH, Fink KD. Numerical Methods Using MATLAB. Upper Saddle River, NJ: Pearson Prentice Hall; 2004. [Google Scholar]
- Oh LYS, Denninger A, Colvin JS, Vyas A, Tole S, Ornitz DM, Bansal R. Fibroblast growth factor receptor 3 signaling regulates the onset of oligodendrocyte terminal differentiation. J Neurosci. 2003;23:883–894. doi: 10.1523/JNEUROSCI.23-03-00883.2003. [DOI] [PMC free article] [PubMed] [Google Scholar]
- Palmer LM, Stuart GJ. Site of action potential initiation in layer V pyramidal neurons. J Neurosci. 2006;26:1854–1863. doi: 10.1523/JNEUROSCI.4812-05.2006. [DOI] [PMC free article] [PubMed] [Google Scholar]
- Palmer LM, Clark BA, Grundemann J, Roth A, Stuart G, Hausser M. Initiation of simple and complex spikes in cerebellar Purkinje cells. J Physiol. 2010;588:1709–1717. doi: 10.1113/jphysiol.2010.188300. [DOI] [PMC free article] [PubMed] [Google Scholar]
- Rasband MN, Trimmer JS, Peles E, Levinson SR, Shrager P. Dependence of nodal sodium channel clustering on paranodal axoglial contact in the developing CNS. J Neurocytol. 1999;28:319–331. doi: 10.1523/JNEUROSCI.19-17-07516.1999. [DOI] [PMC free article] [PubMed] [Google Scholar]
- Rasband MN. The axon initial segment and the maintenance of neuronal polarity. Nat Rev Neurosci. 2010;11:552–562. doi: 10.1038/nrn2852. [DOI] [PubMed] [Google Scholar]
- Ross WN, Krauthamer V. Optical measurements of potential changes in axons and processes of neurons of a barnacle ganglion. J Neurosci. 1984;4:659–672. doi: 10.1523/JNEUROSCI.04-03-00659.1984. [DOI] [PMC free article] [PubMed] [Google Scholar]
- Rushton WAH. Initiation of the propagated disturbance. Proc R Soc Lond B Biol Sci. 1937;124:210–243. [Google Scholar]
- Shu Y, Duque A, Yu Y, Haider B, McCormick DA. Properties of action potential initiation in neocortical pyramidal cells: evidence from whole cell axon recordings. J Neurophysiol. 2007;97:746–760. doi: 10.1152/jn.00922.2006. [DOI] [PubMed] [Google Scholar]
- Stuart GJ, Sakmann B. Active propagation of somatic action potentials into neocortical pyramidal cell dendrites. Nature. 1994;367:69–72. doi: 10.1038/367069a0. [DOI] [PubMed] [Google Scholar]
- Van Wart A, Trimmer JS, Matthews G. Polarized distribution of ion channels within microdomains of the axon initial segment. J Comp Neurol. 2007;500:339–352. doi: 10.1002/cne.21173. [DOI] [PubMed] [Google Scholar]
- Wilent WB, Contreras D. Stimulus-dependent changes in spike threshold enhance feature selectivity in rat barrel cortex neurons. J Neurosci. 2005;25:2983–2991. doi: 10.1523/JNEUROSCI.4906-04.2005. [DOI] [PMC free article] [PubMed] [Google Scholar]
- Zecevic D, Antic S. Fast optical measurement of membrane potential changes at multiple sites on an individual nerve cell. Histochem J. 1995;30:29–32. doi: 10.1023/a:1003299420524. [DOI] [PubMed] [Google Scholar]
- Zecevic D. Multiple spike-initiation zones in single neurons revealed by voltage-sensitive dyes. Nature. 1996;381:322–325. doi: 10.1038/381322a0. [DOI] [PubMed] [Google Scholar]
- Zhou WL, Yan P, Wuskell JP, Loew LM, Antic SD. Intracellular long-wavelength voltage-sensitive dyes for studying the dynamics of action potentials in axons and thin dendrites. J Neurosci Methods. 2007;164:225–239. doi: 10.1016/j.jneumeth.2007.05.002. [DOI] [PMC free article] [PubMed] [Google Scholar]
- Yu Y, Shu Y, McCormick DA. Cortical action potential backpropagation explains spike threshold variability and rapid-onset kinetics. J Neurosci. 2008;28:7260–7272. doi: 10.1523/JNEUROSCI.1613-08.2008. [DOI] [PMC free article] [PubMed] [Google Scholar]
- Yu Y, Maureira C, Liu X, McCormick D. P/Q and N channels control baseline and spike-triggered calcium levels in neocortical axons and synaptic boutons. J Neurosci. 2010;30:11 858–11 869. doi: 10.1523/JNEUROSCI.2651-10.2010. [DOI] [PMC free article] [PubMed] [Google Scholar]
Associated Data
This section collects any data citations, data availability statements, or supplementary materials included in this article.