

Non-technical summary
Parkinson's disease, a neurodegenerative pathology, causes motor and cognitive impairments such as tremor at rest, muscle rigidity and depression. An efficient surgical therapy, deep brain stimulation, allows treatment of most symptoms of Parkinson's disease. The principle of deep brain stimulation is to stimulate electrically, at high frequency and low intensity, the subthalamic nucleus. However, how deep brain stimulation works is still not fully elucidated. We investigated the mechanism of deep brain stimulation of the subthalamic nucleus by recording the activity of neurons that are directly under the control of subthalamic nucleus neurons. We demonstrate that deep brain stimulation of the subthalamic nucleus activates local subthalamic glutamatergic neurons as well as GABAergic fibres travelling through this structure inducing a synaptic excitation–inhibition balance in the output structure. Thus, we conclude that deep brain stimulation restores the activity of the pathological brain network by providing a proper excitation–inhibition balance.
Abstract
Abstract
Deep brain stimulation is an efficient treatment for various neurological pathologies and a promising tool for neuropsychiatric disorders. This is particularly exemplified by high-frequency stimulation of the subthalamic nucleus (STN-HFS), which has emerged as an efficient symptomatic treatment for Parkinson's disease. How STN-HFS works is still not fully elucidated. With dual patch-clamp recordings in rat brain slices, we analysed the cellular responses of STN stimulation on SNr neurons by simultaneously recording synaptic currents and firing activity. We showed that STN-HFS caused an increase of the spontaneous spiking activity in half of SNr neurons while the remaining ones displayed a decrease. At the synaptic level, STN stimulation triggered inward current in 58% of whole-cell recorded neurons and outward current in the remaining ones. Using a pharmacological approach, we showed that STN-HFS-evoked responses were mediated in all neurons by a balance between AMPA/NMDA receptors and GABAA receptors, whose ratio promotes either a net excitation or a net inhibition. Interestingly, we observed a higher excitation occurrence in 6-hydroxydopamine (6-OHDA)-treated rats. In vivo injections of phaseolus revealed that GABAergic pallido-nigral fibres travel through the STN whereas striato-nigral fibres travel below it. Therefore, electrical stimulation of the STN does not only recruit glutamatergic axons from the STN, but also GABAergic passing fibres probably from the globus pallidus. For the first time, we showed that STN-HFS induces concomitant excitatory–inhibitory synaptic currents in SNr neurons by recruitment of efferences and passing fibres allowing a tight control on basal ganglia outflow.
Introduction
Deep brain stimulation of various brain structures has been successfully used for symptomatic treatment of diverse neurological and neuropsychiatric disorders (Kringelbach et al. 2007; Mallet et al. 2008; Gubellini et al. 2009; Deniau et al. 2010). For example, high-frequency stimulation of the subthalamic nucleus (STN-HFS) has emerged as a remarkable tool in alleviating motor symptoms of Parkinson's disease such as akinesia, rigidity or resting tremor (Rezai et al. 2008; Benabid et al. 2009). Despite these promising results, the cellular substrates of STN-HFS are still a matter of controversy (Dostrovsky & Lozano 2002; Vitek 2002; McIntyre et al. 2004b; Hammond et al. 2008).
The first hypothesis explaining the working mode of STN-HFS has been the functional inactivation of the STN, suspected to be hyperactive in Parkinson's disease (Albin et al. 1989; Steigerwald et al. 2008). This hypothesis was supported by studies showing that STN-HFS induces similar beneficial effects to a lesion of the STN (Benazzouz et al. 1995; Benazzouz & Hallett, 2000; Beurrier et al. 2001; Magarinos-Ascone et al. 2002). This hypothesis has since been challenged by a second hypothesis proposing that STN-HFS induces an activation of STN efferent neurons (Garcia et al. 2005; Meissner et al. 2005; Carlson et al. 2010) and also of afferent axons and/or passing fibres (Windels et al. 2000; Maurice et al. 2003; Gradinaru et al. 2009; Miocinovic et al. 2009). More specifically, neurochemical and in vivo extracellular recordings suggested that STN-HFS leads to the release of glutamate and GABA in the substantia nigra pars reticulata (SNr), the output structure of the basal ganglia (Windels et al. 2000; Maurice et al. 2003). Here, we aimed at determining synaptic responses occurring in SNr neurons during STN stimulation. For this purpose, we performed dual patch-clamp recordings and analysed simultaneously the synaptic currents and the related changes of spontaneous firing rate occurring in SNr neurons during STN stimulation. We demonstrated by pharmacological analysis and anatomical 3-D reconstruction, that electrical stimulation of the STN produces in SNr neurons a synaptic excitation–inhibition balance by recruiting glutamatergic axons from the STN as well as GABAergic passing fibres probably from the globus pallidus. Together, these results help in the understanding of synaptic mechanisms induced by STN-HFS.
Methods
Ethical approval
OFA (Oncins France Strain A) rats (Charles River, L'Arbresle, France) (postnatal days 15–26), were killed by decapitation and their brains were immediately removed. All experiments were performed in accordance with local animal welfare committee (Institute of Biology, Centre for Interdisciplinary Research in Biology and College de France) and EU guidelines (directive 86/609/EEC). We, the authors, confirm that our experiments comply with the policies and regulations of The Journal of Physiology (see Drummond, 2009). Every precaution was taken to minimize stress and the number of animals used in each series of experiments.
Electrophysiological whole-cell recordings
Patch-clamp recordings of SNr neurons were performed on parasagittal brain slices (330 μm) from rats (postnatal days 15–26). These parasagittal slices included the STN and the corresponding SNr projection field and were prepared with a vibrating blade microtome (VT1200S, Leica Micosystems, Nussloch, Germany). Patch-clamp recordings were made as previously described (Venance et al. 2004; Fino et al. 2005). Briefly, borosilicate glass pipettes of 9–15 MΩ resistance contained (mm): 105 potassium gluconate, 30 KCl, 10 Hepes, 10 phosphocreatine, 4 ATP-Mg, 0.3 GTP-Na, 0.3 EGTA (adjusted to pH 7.35 with KOH). The composition of the extracellular solution was (mm): 125 NaCl, 2.5 KCl, 25 glucose, 25 NaHCO3, 1.25 NaH2PO4, 2 CaCl2, 1 MgCl2, 10 μm pyruvic acid bubbled with 95% O2 and 5% CO2. All recordings were performed at 34°C using a temperature control system (Badcontroller V, Luigs & Neumann, Ratingen, Germany) and slices were continuously superfused at 2–3 ml min−1 with the extracellular solution. Individual neurons were identified using infrared-differential interference contrast microscopy with CCD camera (Optronis VX45; Kehl, Germany). Signals were amplified using either EPC10-3 or EPC10-4 USB amplifiers (HEKA Elektronik, Lambrecht, Germany). Current-clamp recordings were sampled at 10 kHz and filtered at 2.5 kHz, and voltage-clamp recordings were filtered at 5 kHz and sampled at 20 kHz using Patchmaster v2X35 software (HEKA Elektronik). The series resistance was compensated at 75–80%.
dl-2-amino-5-phosphono-pentanoic acid (AP5, 50 μm) (Tocris, Ellisville, MO, USA) and 6-cyano-7-nitroquinoxaline-2,3-dione (CNQX, 10 μm) (Tocris) were dissolved directly in the extracellular solution and bath applied. Picrotoxin (50 mm) (Sigma, Saint Quentin Fallavier, France) was dissolved in ethanol and then added to the extracellular solution at a final concentration of ethanol of 0.001% and of picrotoxin of 50 μm. It should be noted that spontaneous firing rate of SNr neurons was unaffected by co-application of AP5 and CNQX (9.6 ± 2.2 Hz in control vs. 9.7 ± 1.6 Hz with AP5–CNQX, n = 17, P > 0.05) or by picrotoxin application (8.9 ± 1.3 Hz, vs. 10 ± 1.6 Hz, n = 15, P > 0.05); these results were obtained in SNr neurons recorded in whole-cell (n = 18) and cell-attached (n = 14) modes.
In a subset of experiments, biocytin (Sigma) at 5 mg ml−1 was dissolved in the patch-clamp pipette solution, and cells were filled during at least 20 min of recording. Subsequently, slices were fixed overnight in 4% paraformaldehyde at 4°C. Biocytin-filled cells were visualized using the avidin–biotin–horseradish peroxidase reaction (ABC Elite peroxidase kit; Vector Laboratories) according to the instructions of the manufacturer.
Cell-attached patch-clamp recordings
Cell-attached patch-clamp recordings were performed to record the spontaneous firing activity of SNr neurons, while preserving the cytoplasm content. Cell-attached recordings were performed exclusively in voltage-clamp mode, taking care to tune the injected current to 0 pA (Perkins, 2006). The pipette was filled with extracellular solution (minus pyruvic acid) resulting in a null liquid junction potential (V0). Most of the cell-attached recordings were performed while recording simultaneously a neighbouring neuron (<50 μm) in whole-cell configuration to ensure that the recordings were taking place in the SNr by electrophysiological identification.
Stimulation protocols
Electrical stimulations of the STN were performed with a bipolar concentric electrode (Phymep, Paris, France). Electrical stimulations were monophasic at constant current (ISO-Flex stimulator controlled by a Master-8, A.M.P.I., Jerusalem, Israel). STN single stimulations were applied at 0.2 Hz and neurons were recorded for 5 min during baseline. STN stimulation evoked synaptic currents in SNr neurons with a success rate of 100% (n = 45) and a null failure rate, highlighting a very reliable and efficient transmission. STN-HFS protocols consisted of 100 μs pulses at 130 Hz for 30 s, with 30 s of baseline activity before and after HFS. We tested also STN-HFS over a 2 min period with 2 min baseline activity before and after (n = 19). In a subset of neurons, we tested the effect of the stimulation frequency (n = 32) and intensity (n = 60). For each neuron, the lower intensity of stimulation was chosen based on a significant minimal effect on firing rate; note that 2/3 of applied current leaks in the bath when an electrical stimulation was applied in an acute brain slice (Garcia et al. 2005). Then, the second and third intensities were incremented by ∼1 mA.
Data analysis
Off-line analysis was performed using Igor-Pro (Wavemetrics, Lake Oswego, OR, USA) and Spike2 (Cambridge Electronic Design, Cambridge, UK). Statistical analysis was performed using Prism 5.0 software (San Diego, CA, USA). All results were expressed as mean ± SEM. We compared each group of experiments to a theoretical value of 100 using the non-parametric Wilcoxon signed-rank test (for STN-HFS, we used one average value for each neuron; for STN single stimulation, we used 15 measurements per neuron). When needed, we compared two groups of experiments using the non-parametric Mann–Withney test.
In whole-cell configuration, post-synaptic current (PSCs) mean amplitudes were the average of 15 evoked PSCs. We have considered inward current as positive values and outward current as negative values. Input resistances were monitored and calculated from the response to a hyperpolarizing potential (−5 mV) step during each sweep throughout the experiment and a variation above 20% led to the rejection of the experiment.
In cell-attached configuration, four instantaneous firing frequencies (Fi) preceding immediately the single stimulation were measured and averaged (Fbaseline); these averages were then compared to the Fi of spikes occurring while stimulating the STN (F0).
Regarding HFS stimulation, the average of firing rate occurring during the HFS protocol (30 s duration) was normalized to the mean frequency of the 30 s preceding HFS for each neuron. In a few cases, we observed antidromic responses (n = 3 neurons out of 115), due to the activation of SNr-STN fibres (Maurice et al. 2003); these neurons were discarded from the present study.
Unilaterally 6-hydroxydopamine (6-OHDA)-lesioned animals
Juvenile OFA rats weighing 30–35 g (Charles River) were anaesthetized with ketamine HCl–xylazine HCl (80–12 mg ml−1; 18 mg kg−1i.p.; Sigma, Saint-Quentin Fallavier, France). Control and 6-OHDA experiments were performed on animal of similar ages. Thirty minutes before the injection of the neurotoxin 6-OHDA (Sigma), all animals received a bolus of desipramine dissolved in saline (20 mg kg−1, i.p.; Sigma) to preserve the noradrenergic neurons. Animals were placed in a stereotaxic head frame (Kopf Instruments, Tujunga, CA, USA). Body temperature was maintained at 36.5°C with a homeothermic blanket (Harvard Apparatus, Kent, UK). A small craniotomy was made unilaterally over the left medial forebrain bundle, and the overlying dura mater was removed. A single injection of 6-OHDA was delivered into the medial forebrain bundle on the left side. Stereotaxic coordinates were: anteriority from the bregma line (A), 2.08 mm; laterality from the midline (L), 1.6 mm; depth from the cortical surface (H), −7.7 mm. 6-OHDA was dissolved immediately prior to use in ice-cold 0.9% w/v NaCl solution containing 0.01% w/v ascorbic acid to a final concentration of 10.0 mg ml−1. Then, 1 μl of this 6-OHDA solution was injected at a rate of 0.5 μl min−1 via a 1 μl Hamilton microsyringe (Cole-Parmer, London, UK) controlled by an electrical pump (KDS310; KD Scientific, Holliston, MA, USA). A delay of 5 min was observed between the time the needle of the syringe was inserted in the medial forebrain bundle and the onset of the 6-OHDA injection, and the needle was left in place for 10 min following the end of injection before removal. The weight of the lesioned rats was measured daily and animals were manually fed and/or hydrated if necessary. The efficiency of the lesion was assessed by tyrosine hydroxylase (TH) immunostaining 7–17 days after 6-OHDA injection.
TH immunostaining was performed by incubation of the slices in a 1/300 dilution of mouse anti-(tyrosine hydroxylase) monoclonal antibody (Chemicon International, Temecula, CA, USA) overnight at 4°C. Goat anti-rabbit secondary antibody, coupled to TRITC (Southern Biotechnology, Birmingham, AL, USA) was incubated at a dilution of 1/200 for 2 h at room temperature.
In vivo phaseolus injection: anatomical analysis of pallido- and striato-nigral projections
In rats weighing 305–320 g (8 weeks old), the pallidal and striatal terminals were labelled by extracellular deposit of phaseolus (2.5%; Vector Laboratories) in phosphate-buffered saline (PBS) into, respectively, the globus pallidus and the striatum. Phaseolus was ejected iontophoretically by positive current pulses of 4.5 μA (7 s on–7 s off) for 10–15 cycles. Stereotaxic coordinates for phaseolus injection in the striatum were: A, 8.7–9 mm; L, 3.5–4 mm; H, −5.2–5.4 mm and for the globus pallidus were: A, 8.3 mm; L, 3.1–3.2 mm; H, −6 mm. Following a survival period of 1 week, animals were deeply anaesthetized with sodium pentobarbital (150 mg kg−1i.p.) and intracardially perfused with Ringer solution (500 ml) followed by 0.1 m PBS (pH 7.4; 500 ml) containing 4% paraformaldehyde (Carlo Erba Reagents, Val de Reuil, France). Brains were removed and, following a 2 h post-fixation in the 4% paraformaldehyde PBS, were stored until sectioning at 4°C in 30% phosphate-buffered sucrose. Frontal sections (50 μm) were cut using a freezing microtome and collected in 0.1 m potassium PBS (pH 7.4). Sections were then processed for phaseolus immunohistochemistry as previously described (Degos et al. 2008). Briefly, slices were incubated for 1 h at room temperature and overnight at 4°C with rabbit anti-phaseolus vulgaris agglutinin (E+L) (1:1000; Vector Laboratories) and then incubated for 150 min with biotin-labelled goat anti-rabbit IgG (H+L, 1:500; P.A.R.I.S., Compiegne, France). Secondary antibody was revealed using avidin–biotin–horseradish peroxidase complex (1:100; Vector Laboratories) for at least 12 h at 4°C. Sections were mounted onto chrome-alum-coated slides and counterstained with safranin.
Three-dimensional (3-D) reconstructions were made as previously described (Mailly et al. 2009). Briefly, phaseolus-labelled bundles of the globus pallidus and the striatum, brain border, major fibre bundle and structures of interest (STN, SNr, internal capsule, globus pallidus, striatum) from successive serial sections were delineated manually under 10–40× objectives using a light microscope (Laborlux S. Leitz, France) driven by Neurolucida software (MicroBrightField, Inc., Colchester, USA). All contours were then plotted in 3-D using IMOD package software (Kremer et al. 1996). 3-D reconstructed models of pallido-nigral and striato-nigral bundles could be rotated around any of the x-, y- and z-axes and virtual slices could be made.
Results
Dual recordings of identified SNr neurons
Simultaneous cell-attached and whole-cell recordings were performed on pairs of neighbouring SNr neurons (Fig. 1A). SNr GABAergic neurons were identified and distinguished from neighbouring dopaminergic neurons based on morphological and electrophysiological properties (Nakanishi et al. 1987; Richards et al. 1997) (Fig. 1B and C and Supplemental Table S1). Briefly, when clamped at −60 mV, SNr neurons displayed a high inward resistance (Ri) (395 ± 28 MΩ, n = 45), and a characteristic complex I–V relationship (Ibanez-Sandoval et al. 2006) (Fig. 1C). Action potentials were characterized by a short duration (1.32 ± 0.03 ms), a medium range peak amplitude (57.4 ± 0.8 mV) and a large after-hyperpolarization (AHP) amplitude and duration (14.6 ± 0.7 mV and 16.3 ± 0.7 ms, respectively). SNr neurons displayed a tonic firing activity which significantly differed in cell-attached and in whole-cell configuration (7.9 ± 1.5 Hz, n = 36 vs. 14.6 ± 1.5 Hz, n = 45, respectively, P < 0.0001) (Fig. 1D and E). Such variation could be explained by different ionic compositions between the patch-clamp pipette intracellular solution and the cytoplasmic medium. Lastly, SNr neurons displayed regular spiking activity in both cell-attached and whole-cell configurations, as indicated by the low coefficient of variation (CV) of firing frequency (0.10 ± 0.01, n = 36 and 0.09 ± 0.01, n = 45, respectively, P > 0.05) (Fig. 1F).
Figure 1. Morphological and electrophysiological characterization of SNr neurons.
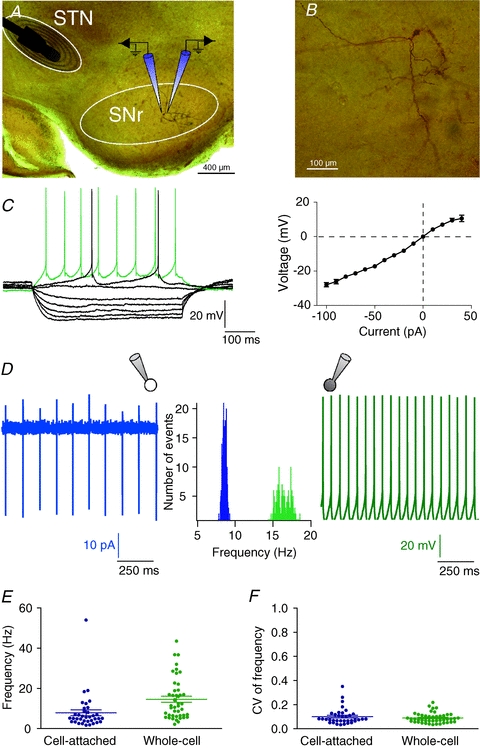
A, brightfield micrograph of a parasagittal STN-SNr slice counterstained with safranin. The stimulation electrode was placed in the STN and SNr neurons were recorded by double patch-clamp; one cell of the pair was recorded in cell-attached and the other neuron in whole-cell configuration. B, high magnification view of the SNr neuron shown in A, injected with biocytin. C, characteristic membrane properties and spiking pattern of one SNr neuron recorded in whole-cell mode. Note the inward and outward rectification illustrated in the steady-state I–V relationship, right. Raw traces show individual voltage responses to series of 500 ms current pulses of −100, −80, −60, −40, −20, 0, 10 and 40 pA. D, example of tonic firing activity of two neighbouring SNr neurons, one in cell-attached (left) and one in whole-cell (right) mode. The firing rate distribution (middle panel) of this representative neuronal pair illustrates the significant difference existing between the recording modes (9.24 ± 1.9 Hz, n = 36 in cell-attached vs. 16.9 ± 1.54 Hz, n = 37 in whole-cell, P < 0.0001). E, distributions of the firing frequency (left) and the coefficient of variation (CV) of the firing frequency (right) of recorded neurons, in cell-attached (n = 36 neurons) and in whole-cell (n = 45 neurons) configurations. Note that in both configurations, SNr neurons displayed a regular spiking.
STN single stimulation induced excitatory as well as inhibitory responses in SNr neurons
We analysed the effect of STN single stimulation on SNr neurons, in whole-cell mode to measure synaptic currents and in cell-attached mode to evaluate changes in firing rate. In whole-cell recording, STN single stimulation evoked inward currents in 58% of the SNr neurons (mean amplitude: 97 ± 23 pA, n = 26) (Fig. 2A) while the remaining ones displayed outward currents (−160 ± 31 pA, n = 19) (Fig. 2B). Latencies and amplitudes of the inward and outward currents displayed Gaussian distributions (Fig. 2A and B). In addition, latency SD values for inward and outward currents were <1 ms for all recorded neurons, denoting monosynaptic transmissions. In a subset of neurons (n = 21), we tested the effect of a STN single stimulation on tonic activity in current-clamp mode. SNr neurons exhibiting inward currents displayed excitatory post-synaptic potentials (EPSPs) that induced on average a significant increase of the spontaneous firing rate (140 ± 17%, n = 11, P < 0.01) (Fig. 2C). Conversely, neurons showing outward currents displayed inhibitory post-synaptic potentials (IPSPs) that induced on average a significant decrease of the firing rate (78 ± 7%, n = 10, P < 0.001) (Fig. 2D). In cell-attached mode, STN single stimulation increased the firing rate in 53% of the neurons (168 ± 20% of baseline frequency, n = 19, P < 0.001) and decreased it in 47% of the neurons (87 ± 2%, n = 17, P < 0.001) (Fig. 2E and F). Therefore, a STN single stimulation was efficient enough to affect spontaneous firing rate of SNr neurons.
Figure 2. STN single stimulation induced excitatory and inhibitory evoked responses in SNr neurons.

A and B, characterization of inward and outward currents evoked by STN single stimulation. Inward currents show in A and outward currents in B, correspond to whole-cell recordings in the same neurons in C and D, respectively. The black line represents the average of 35 inward currents (A) and 30 consecutive outward currents (B) raw traces (grey lines). Top histograms: representative histograms of latency and amplitude distributions of 35 inward currents (A) and 30 outward currents (B). Bottom histograms: latency distribution of 390 inward currents recorded in 26 SNr neurons (15 measurements per neuron) (A) and 285 outward currents recorded in 19 neurons (15 measurements per neuron) (B). Boxes and bars represent SD of latency of 26 (A) and 19 neurons (B); bars represent minimal and maximal values; the median value is represented by the horizontal line in each box. SD of latency (<1 ms) indicates that inward and outward currents were monosynaptic. C and D, whole-cell recordings of PSPs and spontaneous frequencies (C: EPSP; D: IPSP). E and F, a STN single stimulation induced either a significant increase (E) or decrease (F) of the spontaneous firing rate (cell-attached recordings) in two representative SNr neurons (20 trials per neuron). The vertical dashed line indicates the STN single stimulation. ISIn: number of the interspike interval related to the ISI0 (at STN single stimulation).
STN-HFS induced excitatory as well as inhibitory responses in SNr neurons
We investigated the effects of STN-HFS on firing activity of SNr neurons. Firing rate of SNr neurons displayed an abrupt change at the onset of the STN-HFS (130 Hz, 30 s or 2 min with 100 μs pulses duration) and this change was maintained throughout the stimulation duration; neurons rapidly recovered the pre-stimulation firing rate after STN-HFS offset (Fig. 3). The STN-HFS increased the firing rate in 52% of recorded SNr neurons (n = 101) (193 ± 8% of baseline firing rate, n = 52, P < 0.0001) (Fig. 3A and D) while decreasing it in 48% of the cells (49 ± 2%, n = 49, P < 0.0001) (Fig. 3B and D). The variation of the firing rate of SNr neurons upon STN-HFS displayed a large range of magnitude: from complete inhibition to a large increase (up to 700%) (Fig. 3C and E). The magnitude of the excitatory or inhibitory responses induced by STN-HFS was independent of the recording mode, cell-attached vs. whole-cell (excitatory response: 220 ± 28%, n = 24 vs. 170 ± 16%, n = 27, P > 0.05; inhibitory response: 50 ± 7%, n = 12 vs. 49 ± 5%, n = 38, P > 0.05). Therefore, cell-attached and whole-cell recordings for STN-HFS were pooled for the analysis. Lastly, we did not observe any significant difference of excitatory or inhibitory responses induced by 30 s or 2 min duration STN stimulation at 180, 130, 75 or 25 Hz (n = 15–19, P > 0.05). In conclusion, STN-HFS could induce either an excitation or an inhibition in SNr neurons.
Figure 3. STN-HFS induces excitatory and inhibitory evoked responses in SNr neurons.
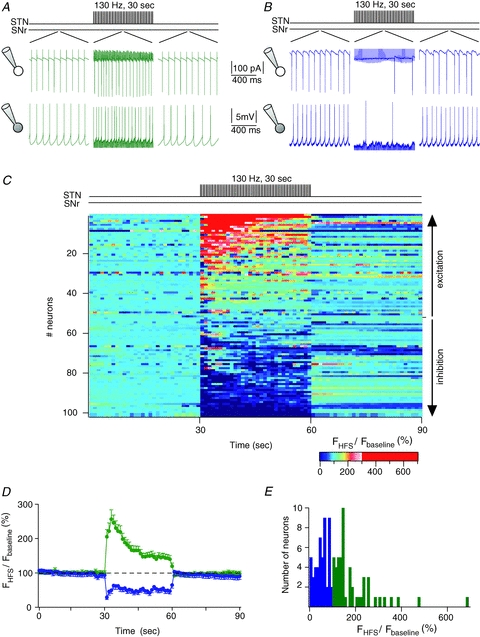
A and B, examples of excitatory (A) and inhibitory (B) evoked effects induced by STN-HFS. Firing activity of SNr neurons, 1 s before, during and after a STN-HFS, are illustrated by raw traces recorded in cell-attached (top traces) and in whole-cell (bottom traces) recordings. Stimulation artifacts due to STN-HFS were partly removed for the clarity of the figure. In A, the mean firing rate was increased to 242% and 146% during STN-HFS, in cell-attached and whole-cell, respectively. In B, the mean spiking frequency was decreased by 53% and 21%, in cell-attached and whole-cell, respectively. C, colour-coded firing rates of SNr neurons (n = 101) before (30 s) STN-HFS, during STN-HFS (30 s) and just after the STN-HFS (30 s). Each line represents one SNr neuron (time bin size, 1 s). The mean firing frequency per second is colour-coded (normalized for each neuron to the mean firing rate observed during the 30 s preceding the STN-HFS). SNr neurons were organized from the most excited (top line) to the most inhibited cells (bottom line) by STN-HFS, as indicated by vertical arrows (right side). D, mean discharge frequency of SNr neurons during STN-HFS (FHFS) normalized to the mean discharge frequency during 30 s before the stimulation (Fbaseline) (mean% s−1± SD). SNr neurons were separated into two groups depending on their excitatory evoked response (n = 52, green) or inhibitory evoked response (n = 49, blue) during STN-HFS. E, distribution of mean evoked effect across recorded neurons (bin size, 10%). In blue are represented the neurons that are inhibited by the STN-HFS and in green, the neurons that are excited.
Significant correlations linked the magnitude of the responses induced by STN-HFS and by STN single stimulation performed in the same SNr neuron in cell-attached or in whole-cell configuration. Indeed, variation of spontaneous firing rate induced by a STN single stimulation was significantly correlated with STN-HFS evoked responses (r2 = 0.27, n = 31, P < 0.005). Similarly, sign and amplitude of synaptic currents were significantly correlated with the magnitude of the effect induced by STN-HFS (r2 = 0.26, n = 30, P < 0.005).
We investigated the occurrence of excitatory and inhibitory evoked responses with varying stimulation parameters: intensity or frequency. In a subset of neurons (n = 74), reliability of the STN-HFS-evoked effect was assessed by applying three stimulation intensities: 1.8 ± 0.1, 2.7 ± 0.1 and 3.8 ± 0.2 mA (Fig. 4A). First, we assessed that none of the three intensities of stimulation were significantly different in SNr neurons exhibiting excitation (n = 28) vs. inhibition (n = 32) (intensity 1: excitation: 2.01 ± 0.17 mA vs. inhibition 1.63 ± 0.12 mA, P > 0.05; intensity 2: excitation: 2.98 ± 0.21 mA vs. inhibition 2.5 ± 0.17 mA, P > 0.05; intensity 3: excitation: 4 ± 0.26 mA vs. inhibition 3.58 ± 0.24 mA, P > 0.05). In most of the cases (81%, n = 74), the sign of the evoked effect (excitatory vs. inhibitory) was not affected by increasing intensities (Fig. 4A). This result indicates that 19% of the neurons switch from excitation to inhibition (n = 8) or from inhibition to excitation (n = 6) with increasing intensities of stimulation; this result is in line with in vivo data (Maurice et al. 2003). Concerning the remaining 81% of the neurons (n = 60), the magnitude of the excitatory or inhibitory evoked effect gradually increased with strength of the stimulation (Fig. 4A).
Figure 4. Excitation–inhibition balance in SNr neurons depends on intensity and frequency of STN stimulation.
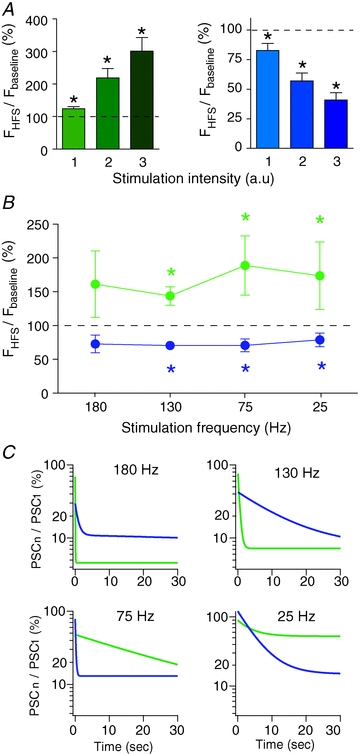
A, impact of the intensity of STN-HFS stimulation on the evoked effect in SNr neurons. The excitatory (left graph) and inhibitory (right graph) responses increased with increasing intensities. Intensity of the STN stimulation was divided into three groups in arbitrary units (a.u.): excited neurons: group 1: 2.01 ± 0.17 mA, group 2: 2.98 ± 0.21 mA, group 3: 4 ± 0.26 mA; inhibited neurons: group 1: 1.63 ± 0.12 mA, group 2: 2.5 ± 0.17 mA, group 3: 3.58 ± 0.24 mA. B, relationship between excitatory and inhibitory responses and STN stimulation frequency (excitation: green; inhibition: blue). C, evolution of synaptic currents during STN stimulation for 180, 130, 75 and 25 Hz. Each PSC (PSCn), evoked by STN stimulation, was normalized to the first PSC (PSC1). Curves (excitatory currents: green; inhibitory currents: blue) result from exponential fits (n = 10–12 neurons per frequency). *P < 0.05.
We investigated STN-HFS-evoked responses when lowering frequency of STN-HFS from 180 to 25 Hz (n = 32 cells). We observed inhibitory (n = 15) and excitatory (n = 17) responses for 130, 75 and 25 Hz STN-HFS. However, 180 Hz STN-HFS did not evoke any significant inhibitory or excitatory responses (Fig. 4B). When synaptic currents were investigated, we found that for 180 and 130 Hz outward currents were more reliable than inward ones; a reverse picture was obtained for currents evoked during STN stimulation at 75 and 25 Hz (Fig. 4C).
STN stimulation induced concomitantly excitatory and inhibitory evoked responses in SNr neurons
Dual patch-clamp recordings of the SNr neurons showed that STN stimulation induced, in 35% of the neuronal pairs (n = 21 pairs), an excitatory evoked effect in one neuron while the neighbouring cell (distance range <50 μm) displayed an inhibitory evoked effect (Fig. 5). Such opposite evoked responses in neighbouring SNr neurons were observed in double cell-attached (Fig. 5A and C) as well as in double whole-cell configuration (Fig. 5B and D). We investigated if occurrence of an excitatory or inhibitory effect could be predicted by parameters related to the age of animals, neuronal membrane properties (Ri, rheobase and spontaneous firing rate) or electrical stimulation (location and intensity) (Supplemental Fig. S1). No significant correlation was observed between the age of animals, Ri, rheobase (whole-cell recordings only) or spontaneous firing rate, and polarity and magnitude of the STN-HFS-evoked effect. Similarly, we did not observe any significant correlation between the location or the intensity of the STN-HFS, and the polarity of evoked responses. Accordingly, the polarity of the evoked effect could not be predicted by neuronal membrane properties or stimulation parameters.
Figure 5. STN-HFS and STN single stimulation can induce opposite responses in neighbouring SNr neurons.

A and B, STN-HFS evoked opposite responses in neighbouring SNr neurons; paired recordings in whole-cell (A) and in cell-attached (B) configurations. Stimulation artifacts were partly removed for clarity of the figure. C and D, STN single stimulation performed in the same neurons as in A and B, respectively. Similarly to STN-HFS, STN single stimulation induced opposite evoked responses in neighbouring SNr neurons recorded in double patch-clamp. Note in the upper panel in D, the action potential (recorded in voltage-clamp mode) evoked by a STN single stimulation. In the lower panel in D, stimulation artifact was partly removed for clarity of the figure.
Glutamatergic–GABAergic balance in excitatory evoked responses in SNr neurons
Excitatory responses induced by STN-HFS or STN single stimulation in SNr neurons were underlaid by ionotropic glutamatergic receptors activation (Fig. 6A–C). Indeed, blockade of NMDA receptors with AP5 (a NMDA-receptor antagonist, 50 μm) precluded the excitatory effect of the STN-HFS (177 ± 35% in control vs. 109 ± 9% with AP5, n = 7, P < 0.05). Co-application of AP5 and CNQX (an AMPA-receptor antagonist, 10 μm) revealed a significant inhibition in 5 out of 8 neurons for STN-HFS and in all cases (n = 4) for STN single stimulation (STN-HFS: 277 ± 22%, n = 8, P < 0.001, and 87 ± 10%, n = 8, P > 0.05 before and after AP5–CNQX, respectively; STN single stimulation: 285 ± 65%, n = 4, P < 0.0001 and 73 ± 9%, n = 4, P < 0.0001, before and after AP5–CNQX, respectively) (Fig. 6A and B). Then, using whole-cell recordings, we investigated if a similar effect occurred at the synaptic level. AP5–CNQX treatment efficiently abolished inward currents and unmasked outward currents (42 ± 9 pA, n = 4, P < 0.0001 vs. −33 ± 5 pA, n = 4, P < 0.0001, respectively) (Fig. 6C). The residual inhibition was totally abolished when picrotoxin (50 μm) was co-applied with AP5–CNQX (STN-HFS: 110 ± 9%, n = 6, P > 0.05 and STN single stimulation: 101 ± 1%, n = 4, P > 0.05) (Fig. 6D and E). This result indicates that the excitatory evoked effect by STN stimulation was composed of a main excitatory component, which masked an inhibitory current.
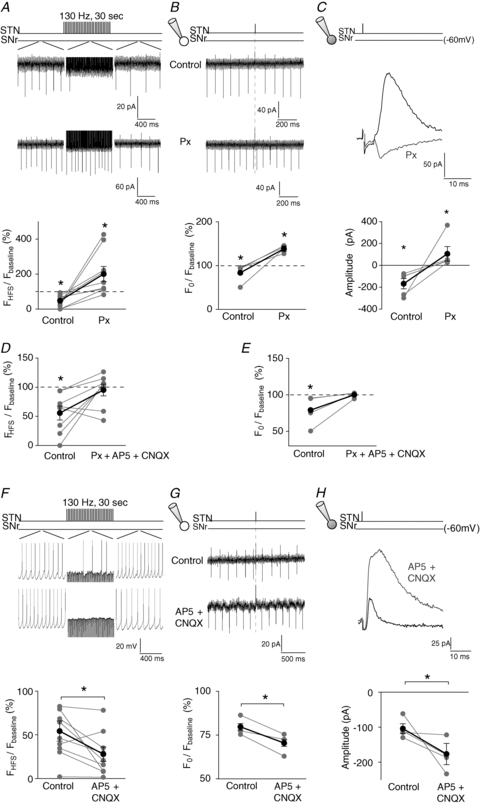
Figure 6. A glutamatergic–GABAergic balance underlies excitatory evoked responses.
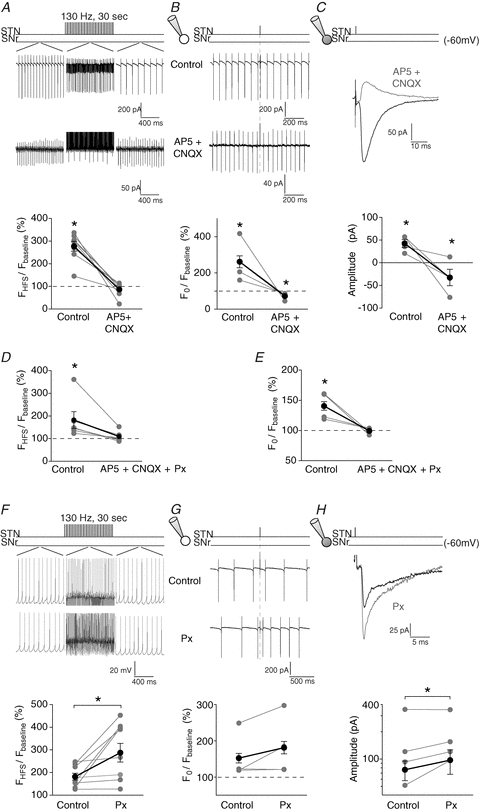
A–C, the excitatory evoked effect in SNr neurons induced by STN-HFS (A) or STN single stimulation in (B and C) were abolished with AP5–CNQX co-application. Top traces represent illustrative raw traces in SNr neurons in control and with AP5–CNQX during STN-HFS (A) or STN single stimulation (B and C). Bottom graphs represent the effect of AP5–CNQX treatment on excitatory evoked responses induced by STN-HFS (A) or STN single stimulation (B and C); grey dots represent single neurons and black dots the mean values. Note that AP5–CNQX treatments unmasked an inhibitory component. Stimulation artifacts were partly removed for clarity of the figure. D and E, AP5–CNQX–picrotoxin treatments totally abolished the evoked effect induced by STN-HFS (D) or by single STN stimulation (E) (SNr neurons recorded in cell-attached mode). F–H, inhibition of GABAA receptors with picrotoxin increases the excitatory evoked effect induced by STN-HFS (F, SNr neurons recorded in cell-attached), or STN single stimulation (G, SNr neurons recorded in cell-attached and H, SNr recorded in whole-cell mode). Raw traces (top) and graphs (bottom panels) illustrate the significant potentiation of excitatory responses with picrotoxin on the firing rate (F) or the inward current amplitude (H). Px, picrotoxin; *P < 0.05.
We estimated the impact of the inhibitory component on the excitatory evoked responses by blocking specifically GABAA receptors with picrotoxin. STN-HFS excitatory evoked effect and mean inward current amplitudes induced by STN single stimulation became significantly larger with picrotoxin (STN-HFS: 182 ± 15% in control vs. 288 ± 41% with picrotoxin, n = 9, P < 0.01 and STN single stimulation: 76 ± 7 pA in control vs. 97 ± 7 pA with picrotoxin, n = 4, P < 0.01) (Fig. 6F and H). Therefore, the inhibitory component modulates significantly the magnitude of the excitatory evoked response (Fig. 6G).
Glutamatergic/GABAergic balance in inhibitory evoked responses in SNr neurons
Inhibitory evoked responses in SNr neurons were shaped mainly by GABAA receptors but also by glutamatergic receptor activation. No significant inhibitory evoked response was detected with STN-HFS or STN single stimulation with picrotoxin (Fig. 7A–C). This indicates that STN stimulation recruits a GABAergic transmission. Moreover, an excitatory evoked effect was revealed since a picrotoxin treatment transformed the inhibition induced by a STN-HFS or a STN single stimulation into an excitatory effect (control: 48 ± 12%, n = 9, P < 0.01 and 85 ± 4%, n = 4, P < 0.01, respectively; picrotoxin: 201 ± 43%, n = 9, P < 0.05 and 145 ± 9%, n = 4, P < 0.0001, respectively) (Fig. 7A and B). A similar observation was made at a synaptic level by whole-cell recordings since the suppression of outward currents by picrotoxin unmasked inward currents (control: −182 ± 10 pA, n = 5, P < 0.0001; picrotoxin: 117 ± 15 pA, n = 5, P < 0.0001) (Fig. 7C). The residual excitatory evoked effect was totally abolished with AP5–CNQX (Fig. 7D and E). These results indicate that the inhibitory evoked effect induced by STN stimulation is the outcome of a synaptic excitation–inhibition balance in which the inhibitory component surpasses the excitatory one.
Figure 7. A GABAergic–glutamatergic balance underlies inhibitory evoked responses.
A–C, the inhibitory evoked responses in SNr neurons induced by STN-HFS (A) or single STN stimulation in (B and C) were abolished with picrotoxin application. Top traces represent illustrative raw traces in SNr neurons in control and with picrotoxin during STN-HFS (A) or STN single stimulation (B and C). Bottom graphs represent the effect of picrotoxin treatment on inhibitory responses induced by STN-HFS (A) or STN single stimulation (B and C); grey dots represent single neurons and black dots the mean values. Note that picrotoxin treatments unmasked a significant excitatory component for STN-HFS or STN single stimulation. Stimulation artifacts were partly removed for clarity of the figure. D and E, picrotoxin–AP5–CNQX treatments totally abolished the evoked effect induced by STN-HFS (D) or by single STN stimulation (SNr neurons recorded in cell-attached). F–H, inhibition of ionotropic glutamatergic receptors with AP5–CNQX increases the inhibitory evoked effect induced by STN-HFS (F, SNr neurons recorded in cell-attached), or single STN stimulation (G and H, SNr recorded in cell-attached and whole-cell, respectively). Raw traces (top) and graphs (bottom panels) illustrate the significant potentiation of inhibitory responses with AP5–CNQX co-application on the firing rate (F and G) or the outward currents amplitude (H). Px, picrotoxin; *P < 0.05.
Lastly, we estimated the impact of the glutamatergic component in inhibitory evoked responses by blocking ionotropic glutamatergic receptors with AP5–CNQX (Fig. 7F–H). The inhibitory effect induced by STN-HFS or STN single stimulation became significantly larger with AP5–CNQX (STN-HFS: 54 ± 12% in control vs. 28 ± 8% with AP5–CNQX, n = 9, P < 0.05; STN single stimulation: 80 ± 2% in control vs. 70 ± 2% with AP5–CNQX, n = 4, P < 0.001) (Fig. 7F and G). Such net effect was confirmed at a synaptic level since outward current mean amplitudes were significantly increased with AP5–CNQX (−103 ± 4 pA in control vs. −176 ± 8 pA with AP5–CNQX, n = 4, P < 0.0001,) (Fig. 7H). Therefore, the excitatory component influences the magnitude of the inhibitory evoked effect.
Excitation–inhibition balance in 6-OHDA-lesioned rats
STN-HFS constitutes an efficient symptomatic therapy for Parkinson's disease (Kringelbach et al. 2007; Benabid et al. 2009; Deniau et al. 2010). However, cellular mechanisms of STN-HFS are still under debate. Therefore, we investigated if the excitation–inhibition balance in SNr neurons described here also occurred in conditions of nigro-striatal degeneration by using 6-OHDA-lesioned rats (left medial forebrain bundle). The efficacy of 6-OHDA lesions was assessed for each rat by TH immunostaining of brain slices in which STN-HFS experiments were performed (Supplemental Fig. S2). The spontaneous firing rate of SNr neurons from 6-OHDA-lesioned rats was not significantly different from that recorded in control rats (cell-attached: 15.9 ± 4.9 Hz, n = 6 vs. 9.2 ± 1.9 Hz, n = 36, P > 0.05, respectively; whole-cell: 15.3 ± 2.5 Hz, n = 18 vs. 14.6 ± 1.5 Hz, n = 45, P > 0.05, respectively). However, the CV of firing rate was significantly higher in 6-OHDA than in control animal (cell-attached: 0.19 ± 0.04, n = 6 vs. 0.10 ± 0.01, n = 36, P < 0.01, respectively; whole-cell: 0.19 ± 0.03, n = 20 vs. 0.09 ± 0.01, n = 45, P < 0.0001, respectively), indicating an increased irregularity of SNr firing rate in 6-OHDA animals (Tai et al. 2003).
STN-HFS increased the firing rate in 74% of SNr neurons (n = 23) and decreased it in the remaining ones (Fig. 8A). The magnitudes of the excitation or inhibition were not significantly different from that recorded in control rats (excitation: 193 ± 8% in control rats, n = 52 vs. 178 ± 16% in 6-OHDA-lesioned rats, n = 17, P > 0.05; inhibition: 49 ± 2%, n = 50 in control rats vs. 48 ± 10% in 6-OHDA-lesioned rats, n = 6, P > 0.05). AP5–CNQX treatment abolished excitatory evoked responses induced by STN-HFS (249 ± 50%vs. 82 ± 19% before and after AP5–CNQX, respectively, n = 5, P < 0.05) and a significant inhibition was unmasked for 3/6 neurons (Fig. 8B). Such residual inhibition was totally abolished when picrotoxin was co-applied with AP5–CNQX (Fig. 8D).
Figure 8. Excitation–inhibition balance in 6-OHDA-lesioned rats.

A, firing rate of SNr neurons during STN-HFS (FHFS) normalized to the mean discharge frequency during 30 s before the stimulation (Fbaseline) (mean% s−1± SD). SNr neurons were separated into two groups depending on their excitatory evoked effect (green) or inhibitory evoked effect (blue) during STN-HFS. B, inhibition of ionotropic glutamatergic receptors with AP5–CNQX treatment abolished the excitatory evoked effect induced by STN-HFS. Raw traces (top) and graph (bottom) show that AP5–CNQX treatments precluded the increase of the firing rate. C, inhibition of GABAA receptors with picrotoxin abolished the inhibitory evoked effect induced by STN-HFS. Raw traces (top) and graph (bottom) show that picrotoxin precluded the decrease of the firing rate. D, inhibition of ionotropic glutamatergic and GABAergic receptors with AP5–CNQX–picrotoxin treatments abolished both excitatory and inhibitory evoked responses induced by STN-HFS. Top raw traces show that AP5–CNQX–picrotoxin treatments abolished STN-HFS evoked effect. Bottom graphs represent all recorded SNr neurons (excited neurons, n = 3: green; inhibited neurons, n = 3: blue). No significant effect of STN-HFS could be observed in AP5–CNQX–picrotoxin treatments. E, excitation–inhibition balance depends on frequency of STN stimulation (excitation: green; inhibition: blue) (left panel). Evolution of PSCs amplitude during STN stimulation for 130 and 25 Hz. Each PSC (PSCn), evoked along STN stimulation, was normalized to the first PSC (PSC1) (n = 8 neurons per frequency). Px, picrotoxin; *P < 0.05.
Inhibitory evoked responses were abolished with picrotoxin (39 ± 16%vs. 197 ± 33% before and after picrotoxin, respectively, n = 5, P < 0.05) and a significant excitation was revealed for all neurons (Fig. 8C). The residual excitatory evoked effect was totally abolished when ionotropic GABAergic and glutamatergic receptors were blocked with picrotoxin–AP5–CNQX (102 ± 3%, n = 3, P > 0.05) (Fig. 8D).
We investigated STN stimulation-evoked responses when lowering frequency from 130 to 25 Hz (n = 14 cells). STN stimulation induced significant inhibitory responses only for 130 Hz, whereas excitatory responses remained significant for all frequencies (Fig. 8E). When synaptic currents were considered, we observed that excitatory currents were more stable with time than inhibitory currents (Fig. 8E).
In conclusion, STN-HFS in 6-OHDA-lesioned rats is able to induce an excitation–inhibition balance as observed in control rats, with the notable difference of an increased excitation occurrence.
STN-HFS recruits GABAergic fibres from the globus pallidus
STN stimulation induced excitatory as well as inhibitory responses. We demonstrated here that the inhibitory effect of STN stimulation was mediated by a GABAergic transmission. Due to the glutamatergic nature of the STN (Hammond et al. 1978), we investigated what could be the source of such GABAergic transmission. Three candidate sources could be activated by STN stimulation: (1) local GABAergic inhibition through SNr collaterals, (2) striato-nigral afferents and (3) pallido-nigral afferents. We ruled out the involvement of local GABAergic inhibition since we observed monosynaptic outward currents in SNr neurons induced by STN stimulation and no synaptic transmission could be observed in SNr–SNr pair recordings (n = 17 pairs, data not shown). We investigated the involvement of GABAergic striato-nigral and/or pallido-nigral afferences in evoked inhibition by STN stimulation. For this purpose, we injected in vivo the anterograde tracer phaseolus in the striatum or in the globus pallidus. Brains were then sliced coronally and serial sections were 3-D reconstructed (Fig. 9) (Mailly et al. 2009). We observed that pallidal-labelled fibres passed through the STN (Fig. 9A–C) whereas striatal fibres travelled below the STN, into the cerebral peduncles (Fig. 9D–F). Although we cannot rule out the involvement of striato-nigral afferents, it is likely that activation of pallido-nigral fibres might be responsible for the GABAergic inhibitory evoked responses observed in SNr during STN-HFS.
Figure 9. Anatomical 3-D reconstruction of pallido-nigral and striato-nigral fibres.

A and D, high magnification micrograph of coronal rat brain slices injected with phaseolus in the globus pallidus (A) and in the striatum (D) and counterstained with safranin. Pallidal fibres were detected in the STN (A, black arrow) whereas striatal fibres (D, black arrows) were located below the STN, in the cerebral peduncles. B and E, 3-D reconstruction of the rat brain in the parasagittal plan with a focus on the following structures: cortex (white), 9B: striatum (soft purple), globus pallidus (purple), 9E: striatum (purple), STN (red), SNr (blue). Pallidal fibres (B) and striatal fibres (E) are in yellow. C and F, high magnification view of B and E, respectively, showing that pallido-nigral fibres pass through the STN (C), whereas striato-nigral fibres travel below the STN (F).
Discussion
STN-HFS appears to be an efficient therapy for neurological disorders such as Parkinson's disease and dystonia (Kringelbach et al. 2007; Gubellini et al. 2009; Deniau et al. 2010). A better understanding of mechanisms underlying beneficial effects of HFS is crucial to optimize this surgical therapy and extend it to other neurological and neuropsychiatric disorders. STN-HFS through activation of STN afferents, efferents and passing fibres induces various effects in different structures. Here, we focused on the synaptic effects correlated with spiking activity in SNr neurons. Dual patch-clamp of neighbouring cells allowed us to record simultaneously synaptic currents in whole-cell configuration and spontaneous frequency in cell-attached configuration. We showed that STN stimulation induced a concomitant synaptic excitation–inhibition in SNr neurons resulting in a net increase of the spontaneous spiking activity in half of SNr neurons and a decreased activity in the remaining neurons. Such a synaptic excitation–inhibition balance, which tightly regulates SNr activity, arises probably from the concomitant activation of glutamatergic subthalamo-nigral and GABAergic pallido-nigral fibres passing through the STN.
In the present study, STN-HFS induced dual excitatory and inhibitory evoked responses among SNr neurons. These results are in line with in vivo extracellular recordings obtained in adult rats (Maurice et al. 2003; Degos et al. 2005; Shi et al. 2006; but see Burbaud et al. 1994 and Tai et al. 2003) showing the existence of both excitatory and inhibitory responses during STN-HFS. It was also reported with extracellular recordings in parkinsonian patients either mainly excitatory (Galati et al. 2006) or inhibitory (Maltête et al. 2007) responses evoked by STN-HFS. Here, pair recordings of SNr neurons revealed that STN-HFS could induce an excitatory evoked effect in one cell and an inhibition in the neighbouring cell. Increasing the intensity of STN stimulation reinforced both inhibitory and excitatory evoked effects.
The pharmacological analysis of synaptic currents and changes in firing rates induced by STN stimulation revealed that excitation relied on AMPA and NMDA receptor activation, whereas inhibition was mediated by GABAA receptor activation. Our data clearly demonstrate the involvement of GABA during STN stimulation, as previously suggested in vivo by extracellular recordings (Maurice et al. 2003) and by neurochemical measurements (Windels et al. 2000, 2005). In addition, STN stimulation triggered mixed evoked responses composed of both excitation and inhibition at a cellular level in nearly all neurons. Indeed, in SNr neurons, the ratio of excitation and inhibition promotes either a net excitatory evoked response or a net inhibition. The pharmacological blockade of AMPA and NMDA receptors unmasked an inhibition in neurons displaying a net excitatory evoked response and strengthened the inhibition in cells exhibiting a net inhibition. Conversely, blockade of GABAA receptors revealed, or reinforced, the excitatory component induced by STN stimulation. There exists a tight relationship between the firing rate of SNr neurons during STN-HFS, and the excitation–inhibition balance at a synaptic level. These findings indicate that net inhibitory and excitatory evoked responses observed in vivo resulted from a synaptic balance between excitation (inward currents) and inhibition (outward currents) whose ratio varied among cells.
Here, we show that the excitatory component arises from activation of subthalamo-nigral fibres, whereas the inhibitory component probably arises from the recruitment of pallido-nigral fibres. Concerning the glutamatergic subthalamo-nigral pathway, the effect of STN-HFS on STN neurons was debated since both a blockade of STN neurons (Beurrier et al. 2001; Magarinos-Ascone et al. 2002) and a genuine activation of these glutamatergic cells (Meissner et al. 2005; Carlson et al. 2010) have been reported. This discrepancy could be explained by the fact that STN-HFS probably silences the soma of STN neurons while activating efficiently their axons (McIntyre et al. 2004a). We demonstrated a potent glutamatergic-evoked response following STN stimulation, indicating that STN axons were recruited by the STN stimulation. Concerning the inhibitory evoked effect in SNr neurons, STN-HFS recruits GABAergic fibres passing through the STN. Indeed, we demonstrated that GABAergic pallido-nigral fibres reached the SNr by passing through the STN, whereas GABAergic striato-nigral fibres travelled in a bundle passing below the STN, in the cerebral peduncles. In addition, anatomical studies in non-human primates also showed that more than half of the pallido-nigral fibres travel through the STN before reaching the SNr (Parent et al. 1983; Sato et al. 2000, François et al. 2004). Experimental and theoretical analysis of the voltage generated by STN stimulation in primates, show that STN-HFS recruits STN neurons as well as passing fibres (Miocinovic et al. 2006, 2009). Thus, STN stimulation is more likely to recruit GABAergic pallido-nigral fibres than striato-nigral fibres. In the case of activation of striato-nigral fibres, STN-HFS should trigger antidromic spikes resulting in the blockade of orthodromic striato-nigral transmission. Nonetheless, as shown in vivo, the striato-nigral transmission is not impaired during STN-HFS (Degos et al. 2005). Moreover, the activation of the pallido-nigral pathway by involvement of the disynaptic subthalamo-pallido-nigral pathway can be ruled out. Indeed, globus pallidus was excluded from the parasagittal slices (pallido-nigral fibres were preserved) and we observed exclusively monosynaptic GABAergic responses in SNr neurons. Thus, the observed inhibition induced by STN stimulation in SNr neurons probably results from direct orthodromic activation of pallido-nigral fibres and eventually from an axonal reflex (Kita & Kitai, 1994). Electron microscopy analysis revealed that pallido-nigral fibres contact SNr neurons at their soma (Smith & Bolam, 1989). It is thus expected that inhibition conveyed by pallido-nigral fibres might be highly efficient. Thus, we can reasonably assume that STN-HFS in human patients activates GABAergic pallido-nigral fibres together with the glutamatergic STN axons, and hence also produces a synaptic excitation–inhibition balance into SNr neurons.
We propose that the existence of a synaptic excitation–inhibition balance in the SNr is a key element of STN-HFS. Indeed, therapeutic effects of STN-HFS on motor symptoms in 6-OHDA-lesioned rats were correlated with a combination of inhibited and excited SNr neurons (Shi et al. 2006). Interestingly, STN-HFS restored a cortico-SNr transmission that was abolished with neuroleptic treatment (Degos et al. 2005). In addition, it has been shown that in parkinsonian patients, a STN-HFS decreased the level of GABA in the motor thalamus, indicating a reduce activity of SNr neurons (Stefani et al. 2011). A recent optogenetic study using light-sensitive neuronal modulators driven by cell-type-specific promoters showed that increasing or decreasing activity in excitatory neurons in STN was not sufficient to mimic beneficial effect of STN-HFS (Gradinaru et al. 2009).
In conclusion, STN-HFS activates both glutamatergic subthalamo-nigral neurons and GABAergic pallido-nigral axons. Each SNr neuron receives a bulk of excitatory and inhibitory inputs preventing a complete extinction or over-excitation of the neuronal activity. It remains to be determined the precise mapping of the passing fibres within different functional areas of the human STN. Indeed, the correlation between the location of the stimulation electrode and the beneficial effects of STN-HFS would allow better identification of the proportion of passing fibres required to produce an optimal excitation–inhibition balance.
Acknowledgments
We would like to acknowledge Anne-Marie Godeheu for technical assistance for the immunohistochemistry and Philippe Mailly for the help for anatomical 3-D reconstruction. We would like to acknowledge for careful reading and pertinent comments: Teresa Morera-Herreras, Elodie Fino, Marie Vandecasteele and Franck Duriff.
Glossary
Abbreviations
- CV
coefficient of variation
- Px
picrotoxin
- Ri
inward resistance
- STN
subthalamic nucleus
- SNr
substantia nigra pars reticulate
- STN-HFS
high-frequency stimulation of the subthalamic nucleus
- TH
tyrosine hydroxylase
Author contributions
Conception and design of the experiments: C.B. and L.V. Collection, analysis and interpretation of data: C.B., B.D. and L.V. Drafting the article or revising it critically for important intellectual content: C.B., B.D., J.-M.D. and L.V. All authors approved the final version.
Supplementary material
Supplementary table 1
Supplementary figure 1
Supplementary figure 2
As a service to our authors and readers, this journal provides supporting information supplied by the authors. Such materials are peer-reviewed and may be re-organized for online delivery, but are not copy-edited or typeset. Technical support issues arising from supporting information (other than missing files) should be addressed to the authors
References
- Albin RL, Young AB, Penney JB. The functional anatomy of basal ganglia disorders. Trends Neurosci. 1989;12:366–375. doi: 10.1016/0166-2236(89)90074-x. [DOI] [PubMed] [Google Scholar]
- Benabid AL, Chabardes S, Mitrofanis J, Pollak P. Deep brain stimulation of the subthalamic nucleus for the treatment of Parkinson's disease. Lancet Neurol. 2009;8:67–81. doi: 10.1016/S1474-4422(08)70291-6. [DOI] [PubMed] [Google Scholar]
- Benazzouz A, Hallett M. Mechanism of action of deep brain stimulation. Neurology. 2000;55:S13–S16. [PubMed] [Google Scholar]
- Benazzouz A, Piallat B, Pollak P, Benabid AL. Responses of substantia nigra pars reticulata and globus pallidus complex to high frequency stimulation of the subthalamic nucleus in rats: electrophysiological data. Neurosci Lett. 1995;189:77–80. doi: 10.1016/0304-3940(95)11455-6. [DOI] [PubMed] [Google Scholar]
- Beurrier C, Bioulac B, Audin J, Hammond C. High-frequency stimulation produces a transient blockade of voltage-gated currents in subthalamic neurons. J Neurophysiol. 2001;85:1351–1356. doi: 10.1152/jn.2001.85.4.1351. [DOI] [PubMed] [Google Scholar]
- Burbaud P, Gross C, Bioulac B. Effect of subthalamic high frequency stimulation on substantia nigra pars reticulata and globus pallidus neurons in normal rats. J Physiol Paris. 1994;88:359–361. doi: 10.1016/0928-4257(94)90029-9. [DOI] [PubMed] [Google Scholar]
- Carlson JD, Cleary DR, Cetas JS, Heinricher MM, Burchiel KJ. Deep brain stimulation does not silence neurons in subthalamic nucleus in Parkinson's patients. J Neurophysiol. 2010;103:962–967. doi: 10.1152/jn.00363.2009. [DOI] [PMC free article] [PubMed] [Google Scholar]
- Degos B, Deniau JM, Le Cam J, Mailly P, Maurice N. Evidence for a direct subthalamo-cortical loop circuit in the rat. Eur J Neurosci. 2008;27:2599–2610. doi: 10.1111/j.1460-9568.2008.06229.x. [DOI] [PubMed] [Google Scholar]
- Degos B, Deniau JM, Thierry AM, Glowinski J, Pezard L, Maurice N. Neuroleptic-induced catalepsy: electrophysiological mechanisms of functional recovery induced by high-frequency stimulation of the subthalamic nucleus. J Neurosci. 2005;25:7687–7696. doi: 10.1523/JNEUROSCI.1056-05.2005. [DOI] [PMC free article] [PubMed] [Google Scholar]
- Deniau JM, Degos B, Bosch C, Maurice N. Deep brain stimulation mechanisms: beyond the concept of local functional inhibition. Eur J Neurosci. 2010;32:1080–1091. doi: 10.1111/j.1460-9568.2010.07413.x. [DOI] [PubMed] [Google Scholar]
- Dostrovsky JO, Lozano AM. Mechanisms of deep brain stimulation. Mov Disord. 2002;17(Suppl 3):S63–S68. doi: 10.1002/mds.10143. [DOI] [PubMed] [Google Scholar]
- Drummond GB. Reporting ethical matters in The Journal of Physiology: standarts and advice. J Physiol. 2009;587:713–719. doi: 10.1113/jphysiol.2008.167387. [DOI] [PMC free article] [PubMed] [Google Scholar]
- Fino E, Glowinski J, Venance L. Bidirectional activity-dependent plasticity at corticostriatal synapses. J Neurosci. 2005;25:11279–11287. doi: 10.1523/JNEUROSCI.4476-05.2005. [DOI] [PMC free article] [PubMed] [Google Scholar]
- Francois C, Grabli D, McCairn K, Jan C, Karachi C, Hirsch EC, Feger J, Tremblay L. Behavioural disorders induced by external globus pallidus dysfunction in primates IIAnatomical study. Brain. 2004;127:2055–2070. doi: 10.1093/brain/awh239. [DOI] [PubMed] [Google Scholar]
- Galati S, Mazzone P, Fedele E, Pisani A, Peppe A, Pierantozzi M, et al. Biochemical and electrophysiological changes of substantia nigra pars reticulata driven by subthalamic stimulation in patients with Parkinson's disease. Eur J Neurosci. 2006;23:2923–2928. doi: 10.1111/j.1460-9568.2006.04816.x. [DOI] [PubMed] [Google Scholar]
- Garcia L, D'Alessandro G, Fernagut PO, Bioulac B, Hammond C. Impact of high-frequency stimulation parameters on the pattern of discharge of subthalamic neurons. J Neurophysiol. 2005;94:3662–3669. doi: 10.1152/jn.00496.2005. [DOI] [PubMed] [Google Scholar]
- Gradinaru V, Mogri M, Thompson KR, Henderson JM, Deisseroth K. Optical deconstruction of parkinsonian neural circuitry. Science. 2009;324:354–359. doi: 10.1126/science.1167093. [DOI] [PMC free article] [PubMed] [Google Scholar]
- Gubellini P, Salin P, Kerkerian-Le Goff L, Baunez C. Deep brain stimulation in neurological diseases and experimental models: from molecule to complex behaviour. Prog Neurobiol. 2009;89:79–123. doi: 10.1016/j.pneurobio.2009.06.003. [DOI] [PubMed] [Google Scholar]
- Hammond C, Ammari R, Bioulac B, Garcia L. Latest view on the mechanism of action of deep brain stimulation. Mov Disord. 2008;23:2111–2121. doi: 10.1002/mds.22120. [DOI] [PubMed] [Google Scholar]
- Hammond C, Deniau JM, Rouzaire-Dubois B, Feger J. Pepipheral input to the rat subthalamic nucleus, an electrophysiological study. Neurosci Lett. 1978;9:171–176. doi: 10.1016/0304-3940(78)90067-8. [DOI] [PubMed] [Google Scholar]
- Ibanez-Sandoval O, Hernandez A, Floran B, Galarraga E, Tapia D, Valdiosera R, Erlij D, Aceves J, Bargas J. Control of the subthalamic innervation of substantia nigra pars reticulata by D1 and D2 dopamine receptors. J Neurophysiol. 2006;95:1800–1811. doi: 10.1152/jn.01074.2005. [DOI] [PubMed] [Google Scholar]
- Kita H, Kitai ST. The morphology of globus pallidus projection neurons in the rat: an intracellular staining study. Brain Res. 1994;636:308–319. doi: 10.1016/0006-8993(94)91030-8. [DOI] [PubMed] [Google Scholar]
- Kremer JR, Mastronarde DN, McIntosh JR. Computer visualization of three-dimensional image data using IMOD. J Struct Biol. 1996;116:71–76. doi: 10.1006/jsbi.1996.0013. [DOI] [PubMed] [Google Scholar]
- Kringelbach ML, Jenkinson N, Owen SL, Aziz TZ. Translational principles of deep brain stimulation. Nat Rev Neurosci. 2007;8:623–635. doi: 10.1038/nrn2196. [DOI] [PubMed] [Google Scholar]
- McIntyre CC, Grill WM, Sherman DL, Thakor NV. Cellular effects of deep brain stimulation: model-based analysis of activation and inhibition. J Neurophysiol. 2004a;91:1457–1469. doi: 10.1152/jn.00989.2003. [DOI] [PubMed] [Google Scholar]
- McIntyre CC, Savasta M, Walter BL, Vitek JL. How does deep brain stimulation work? Present understanding and future questions. J Clin Neurophysiol. 2004b;21:40–50. doi: 10.1097/00004691-200401000-00006. [DOI] [PubMed] [Google Scholar]
- Magarinos-Ascone C, Pazo JH, Macadar O, Buno W. High-frequency stimulation of the subthalamic nucleus silences subthalamic neurons: a possible cellular mechanism in Parkinson's disease. Neuroscience. 2002;115:1109–1117. doi: 10.1016/s0306-4522(02)00538-9. [DOI] [PubMed] [Google Scholar]
- Mailly P, Haber SN, Groenewegen HJ, Deniau JM. A 3D multi-modal and multi-dimensional digital brain model as a framework for data sharing. J Neurosci Methods. 2009;194:56–63. doi: 10.1016/j.jneumeth.2009.12.014. [DOI] [PubMed] [Google Scholar]
- Mallet L, Polosan M, Jaafari N, Baup N, Welter ML, Fontaine D, et al. Subthalamic nucleus stimulation in severe obsessive-compulsive disorder. N Engl J Med. 2008;359:2121–2134. doi: 10.1056/NEJMoa0708514. [DOI] [PubMed] [Google Scholar]
- Maltete D, Jodoin N, Karachi C, Houeto JL, Navarro S, Cornu P, Agid Y, Welter ML. Subthalamic stimulation and neuronal activity in the substantia nigra in Parkinson's disease. J Neurophysiol. 2007;97:4017–4022. doi: 10.1152/jn.01104.2006. [DOI] [PubMed] [Google Scholar]
- Maurice N, Thierry AM, Glowinski J, Deniau JM. Spontaneous and evoked activity of substantia nigra pars reticulata neurons during high-frequency stimulation of the subthalamic nucleus. J Neurosci. 2003;23:9929–9936. doi: 10.1523/JNEUROSCI.23-30-09929.2003. [DOI] [PMC free article] [PubMed] [Google Scholar]
- Meissner W, Leblois A, Hansel D, Bioulac B, Gross CE, Benazzouz A, Boraud T. Subthalamic high frequency stimulation resets subthalamic firing and reduces abnormal oscillations. Brain. 2005;128:2372–2382. doi: 10.1093/brain/awh616. [DOI] [PubMed] [Google Scholar]
- Miocinovic S, Lempka SF, Russo GS, Maks CB, Butson CR, Sakaie KE, Vitek JL, McIntyre CC. Experimental and theoretical characterization of the voltage distribution generated by deep brain stimulation. Exp Neurol. 2009;216:166–176. doi: 10.1016/j.expneurol.2008.11.024. [DOI] [PMC free article] [PubMed] [Google Scholar]
- Miocinovic S, Parent M, Butson CR, Hahn PJ, Russo GS, Vitek JL, McIntyre CC. Computational analysis of subthalamic nucleus and lenticular fasciculus activation during therapeutic deep brain stimulation. J Neurophysiol. 2006;96:1569–1580. doi: 10.1152/jn.00305.2006. [DOI] [PubMed] [Google Scholar]
- Nakanishi H, Kita H, Kitai ST. Intracellular study of rat substantia nigra pars reticulata neurons in an in vitro slice preparation: electrical membrane properties and response characteristics to subthalamic stimulation. Brain Res. 1987;437:45–55. doi: 10.1016/0006-8993(87)91525-3. [DOI] [PubMed] [Google Scholar]
- Parent A, De Bellefeuille L. The pallidointralaminar and pallidonigral projections in primate as studied by retrograde double-labelling method. Brain Res. 1983;278:11–27. doi: 10.1016/0006-8993(83)90222-6. [DOI] [PubMed] [Google Scholar]
- Perkins KL. Cell-attached voltage-clamp and current-clamp recording and stimulation techniques in brain slices. J Neurosci Methods. 2006;154:1–18. doi: 10.1016/j.jneumeth.2006.02.010. [DOI] [PMC free article] [PubMed] [Google Scholar]
- Rezai AR, Machado AG, Deogaonkar M, Azmi H, Kubu C, Boulis NM. Surgery for movement disorders. Neurosurgery. 2008;62:809–838. doi: 10.1227/01.neu.0000316285.52865.53. discussion 838–809. [DOI] [PubMed] [Google Scholar]
- Richards CD, Shiroyama T, Kitai ST. Electrophysiological and immunocytochemical characterization of GABA and dopamine neurons in the substantia nigra of the rat. Neuroscience. 1997;80:545–557. doi: 10.1016/s0306-4522(97)00093-6. [DOI] [PubMed] [Google Scholar]
- Sato F, Lavallee P, Levesque M, Parent A. Single-axon tracing study of neurons of the external segment of the globus pallidus in primate. J Comp Neurol. 2000;417:17–31. [PubMed] [Google Scholar]
- Shi LH, Luo F, Woodward DJ, Chang JY. Basal ganglia neural responses duringbehaviourally effective deep brain stimulation of the subthalamic nucleus in rats performing a treadmill locomotion test. Synapse. 2006;59:445–457. doi: 10.1002/syn.20261. [DOI] [PubMed] [Google Scholar]
- Smith Y, Bolam JP. Neurons of the substantia nigra reticulata receive a dense GABA-containing input from the globus pallidus in the rat. Brain Res. 1989;493:160–167. doi: 10.1016/0006-8993(89)91011-1. [DOI] [PubMed] [Google Scholar]
- Stefani A, Fedele E, Pierantozzi M, Galati S, Marzetti F, Peppe A, Pastore FS, Bernardi G, Stanzione P. Reduced GABA content in the motor thalamus during effective deep brain stimulation of the subthalamic nucleus. Front Syst Neurosci. 2011;5:5–17. doi: 10.3389/fnsys.2011.00017. [DOI] [PMC free article] [PubMed] [Google Scholar]
- Steigerwald F, Potter M, Herzog J, Pinsker M, Kopper F, Mehdorn H, Deuschl G, Volkmann J. Neuronal activity of the human subthalamic nucleus in the parkinsonian and nonparkinsonian state. J Neurophysiol. 2008;100:2515–2524. doi: 10.1152/jn.90574.2008. [DOI] [PubMed] [Google Scholar]
- Tai CH, Boraud T, Bezard E, Bioulac B, Gross C, Benazzouz A. Electrophysiological and metabolic evidence that high-frequency stimulation of the subthalamic nucleus bridles neuronal activity in the subthalamic nucleus and the substantia nigra reticulata. FASEB J. 2003;17:1820–1830. doi: 10.1096/fj.03-0163com. [DOI] [PubMed] [Google Scholar]
- Venance L, Glowinski J, Giaume C. Electrical and chemical transmission between striatal GABAergic output neurones in rat brain slices. J Physiol. 2004;559:215–230. doi: 10.1113/jphysiol.2004.065672. [DOI] [PMC free article] [PubMed] [Google Scholar]
- Vitek JL. Mechanisms of deep brain stimulation: excitation or inhibition. Mov Disord. 2002;17:S69–S72. doi: 10.1002/mds.10144. [DOI] [PubMed] [Google Scholar]
- Windels F, Bruet N, Poupard A, Urbain N, Chouvet G, Feuerstein C, Savasta M. Effects of high frequency stimulation of subthalamic nucleus on extracellular glutamate and GABA in substantia nigra and globus pallidus in the normal rat. Eur J Neurosci. 2000;12:4141–4146. doi: 10.1046/j.1460-9568.2000.00296.x. [DOI] [PubMed] [Google Scholar]
- Windels F, Carcenac C, Poupard A, Savasta M. Pallidal origin of GABA release within the substantia nigra pars reticulata during high-frequency stimulation of the subthalamic nucleus. J Neurosci. 2005;25:5079–5086. doi: 10.1523/JNEUROSCI.0360-05.2005. [DOI] [PMC free article] [PubMed] [Google Scholar]
Associated Data
This section collects any data citations, data availability statements, or supplementary materials included in this article.